


- Handling qualitative data
- Transcripts
- Field notes
- Memos
- Survey data and responses
- Visual and audio data
- Data organization
- Data coding
- Coding frame
- Auto and smart coding
- Organizing codes
- Qualitative data analysis
- Content analysis
- Thematic analysis
- Narrative research
- Phenomenological research
- Discourse analysis
- Grounded theory
- Deductive reasoning
- Inductive reasoning
- Inductive vs. deductive reasoning
- Qualitative data interpretation
- Qualitative data analysis software
- How to cite "The Ultimate Guide to Qualitative Research - Part 2"
- Thematic analysis vs. content analysis
Thematic analysis
One of the most straightforward forms of qualitative data analysis involves the identification of themes and patterns that appear in otherwise unstructured qualitative data. Thematic analysis is an integral component of qualitative research because it provides an entry point into analyzing qualitative data.
Let's look at thematic analysis, its role in qualitative research methods, and how ATLAS.ti can help you form themes from raw data to generate a theoretical framework.

What is meant by thematic analysis?
The main objective of research is to order data into meaningful patterns and generate new knowledge arising from theories about that data. Quantitative data is analyzed to measure a phenomenon's quantifiable aspects (e.g., an element's melting point, the effective income tax rate in the suburbs). The advantage of quantitative research is that data is often already structured, or at least easily structured, to quickly draw insights from numerical values.
On the other hand, some phenomena cannot be easily quantified, or they require conceptual development before they can be quantified. For example, what do people mean when they think of a movie or TV show as "good"? In the everyday world, people in a casual discussion may judge the quality of entertainment as a matter of personal preference, something that cannot be defined, let alone universally understood.

As a result, researchers analyze qualitative data for identifying themes or phenomena that occur often or in telling patterns. In the case of TV shows, a collection of reviews of TV shows may frequently mention the acting, the script writing, and the production values, among other things. If these aspects are mentioned the most often, researchers can think of these as the themes determining the quality of a given TV show.
A useful metaphor for thematic analysis
Even if this is an easy concept to grasp, realizing this concept in qualitative research is a significant challenge. The biggest consideration for thematic analysis is that qualitative data is often unstructured and requires some organization to make it relevant to researchers and their audience.
Imagine that you have a bag of marbles. Each marble has one of a set of different colors. If you were to sort the marbles by color, you could determine how many colors are in the bag and which colors are the most common.

The thematic analysis process is similar to sorting different-colored marbles. Instead of sorting colors, you are sorting themes in a data set to determine which themes appear the most often or to identify patterns among these themes.
After your initial analysis, you can take this one step further and separate "dark" colors from "light" colors or "warm" colors from "cool" colors. Blue and green are distinctly different colors, but you can group them under the "cool" category of colors to form a more overarching theme.
A simple example of thematic analysis
Imagine a simple research question: how do teachers determine if a student's essay is good? Suppose you have a set of transcripts of interviews with teachers discussing writing classes and students' essays. In this case, the objective of thematic analysis is to determine the main factors teachers use to determine the quality of a piece of writing.
As you read the transcripts, you might find that teachers share some common answers. Of course, you might have an intuition that correct grammar and spelling are important, which will likely be confirmed by the teachers in their interviews. However, other considerations might surface in the data.
The next question in this casual thematic analysis is, what considerations appear most often? A few teachers may occasionally mention the size and typeface of the text as deciding factors, but more often they might say that the flow and organization of students' writing are more important. Analyzing the occurrences and patterns among themes across your transcripts can help you develop an answer to your research question.
The subjectivity of themes
One challenge is that themes in qualitative analysis, as with determining the themes of good writing, are not as visible to the naked eye as colors on a marble. The color "red" is relatively easy to see, but the fields in which thematic analysis is often applied do not deal with concepts that can necessarily be seen "objectively." It is up to the researcher to derive themes from the data from an inductive approach. Researchers can also utilize deductive approaches if they want to analyze their data according to themes that have been previously identified in other research.

Think about the picture up above. To the naked eye, these children are holding hands. But themes that can be interpreted from this picture may include "friendship," "happiness," or even "family." The thematic analysis of pictures like this one often depends on a researcher's theoretical commitments, knowledge base, and cultural perspective.
This also means that you are responsible for explaining how you arrived at the themes arising from your data set. While colors are intuitively easy to distinguish, you are often required to explain more subjective codes and themes like "resilience" or "entitlement" so that you and your research audience have a common understanding of your data analysis.
This explanation should account for who you are as a researcher and how you see the data (since, after all, a word like "resilience" can mean different things to different people). A fully reflexive thematic analysis documents and presents where the researcher is relative to their data and to their research audience.

Applications for thematic analysis
Many disciplines within qualitative research employ thematic analysis to make sense of social phenomena. For instances, these fields might be:
- psychotherapy research
- qualitative psychology
- cultural anthropology
In a nutshell, any research discipline that relies on the understanding of social phenomena or insights that may not easily be quantifiable will attract researchers engaged in thematic analysis. Moreover, any exploratory research design lends itself easily to the identification of previously unknown themes that can later be used in a qualitative, quantitative, or confirmatory research project.
Common forms of data collection
Thematic analysis can involve any number of qualitative research methods to collect data, including:
Any unstructured data set, particularly any data set that captures social phenomena, can benefit from thematic analysis. The main consideration in ensuring rigor in data collection for thematic analysis is ensuring that your data is representative of the population or phenomenon you are trying to capture.
The thematic analysis process
Virginia Braun and Victoria Clarke are the key researchers involved in making thematic analysis a commonly utilized approach in qualitative research. A quick search for their scholarship will tell you the basic steps involved in thematic analysis:
- Become familiar with the data
- Generate codes from the data
- Generate themes based on the codes
- Review the potential themes
- Define the themes for the final reporting
In a nutshell, thematic analysis requires the researcher to look at their data, summarize their data with codes, and develop those codes to the extent that they can contribute a broader understanding of the context from which the data is collected.
While these are the key points in a robust and rigorous thematic analysis, there are understated parts of the qualitative research process that can often be taken for granted but must never be overlooked to ensure that researchers can analyze their data quickly and with as few challenges as possible.
The process in greater detail
Thematic analysis relies on research questions that are exploratory in nature, thus requiring an inductive approach to examining the data. While you might rely on an existing theoretical framework to decide your research questions and collect all the data for your project, thematic analysis primarily looks at your data inductively for what it says and what it says most often.
After data collection, you need to organize the data in some way to make the data analysis process easier (or, at minimum, possible). A data set in qualitative research is often akin to a crowd of people where individuals move in any direction without any sense of organization. This is a challenge if your research question involves understanding the crowd's age, gender, ethnicity, or style of clothing.

The role of qualitative researchers at this stage is to sort out the crowd. In this example, perhaps this means having the crowd split into different groups according to those demographic identifiers to see which groups are the largest. Reorganizing the crowd from what was previously a group of wandering individuals can offer a better sense of who is in the room.
Qualitative data is often similarly unstructured and in need of reorganization. When dealing with thematic analysis, you need to reorganize the information so that the themes become more apparent to you and your research audience. In most cases, this means reducing the entire data set, as large as it might be, into a more concise form that allows for a more feasible analysis.
Coded data

Codes and themes are forms of data reduction that address this need. In a thematic analysis involving qualitative data analysis software, researchers code their data by applying short but descriptive phrases to larger data segments to summarize them for later analysis. Later stages of thematic analysis reorganize these codes into larger categories and then themes, where ultimately the themes support contribution to meaningful insights and existing theory.
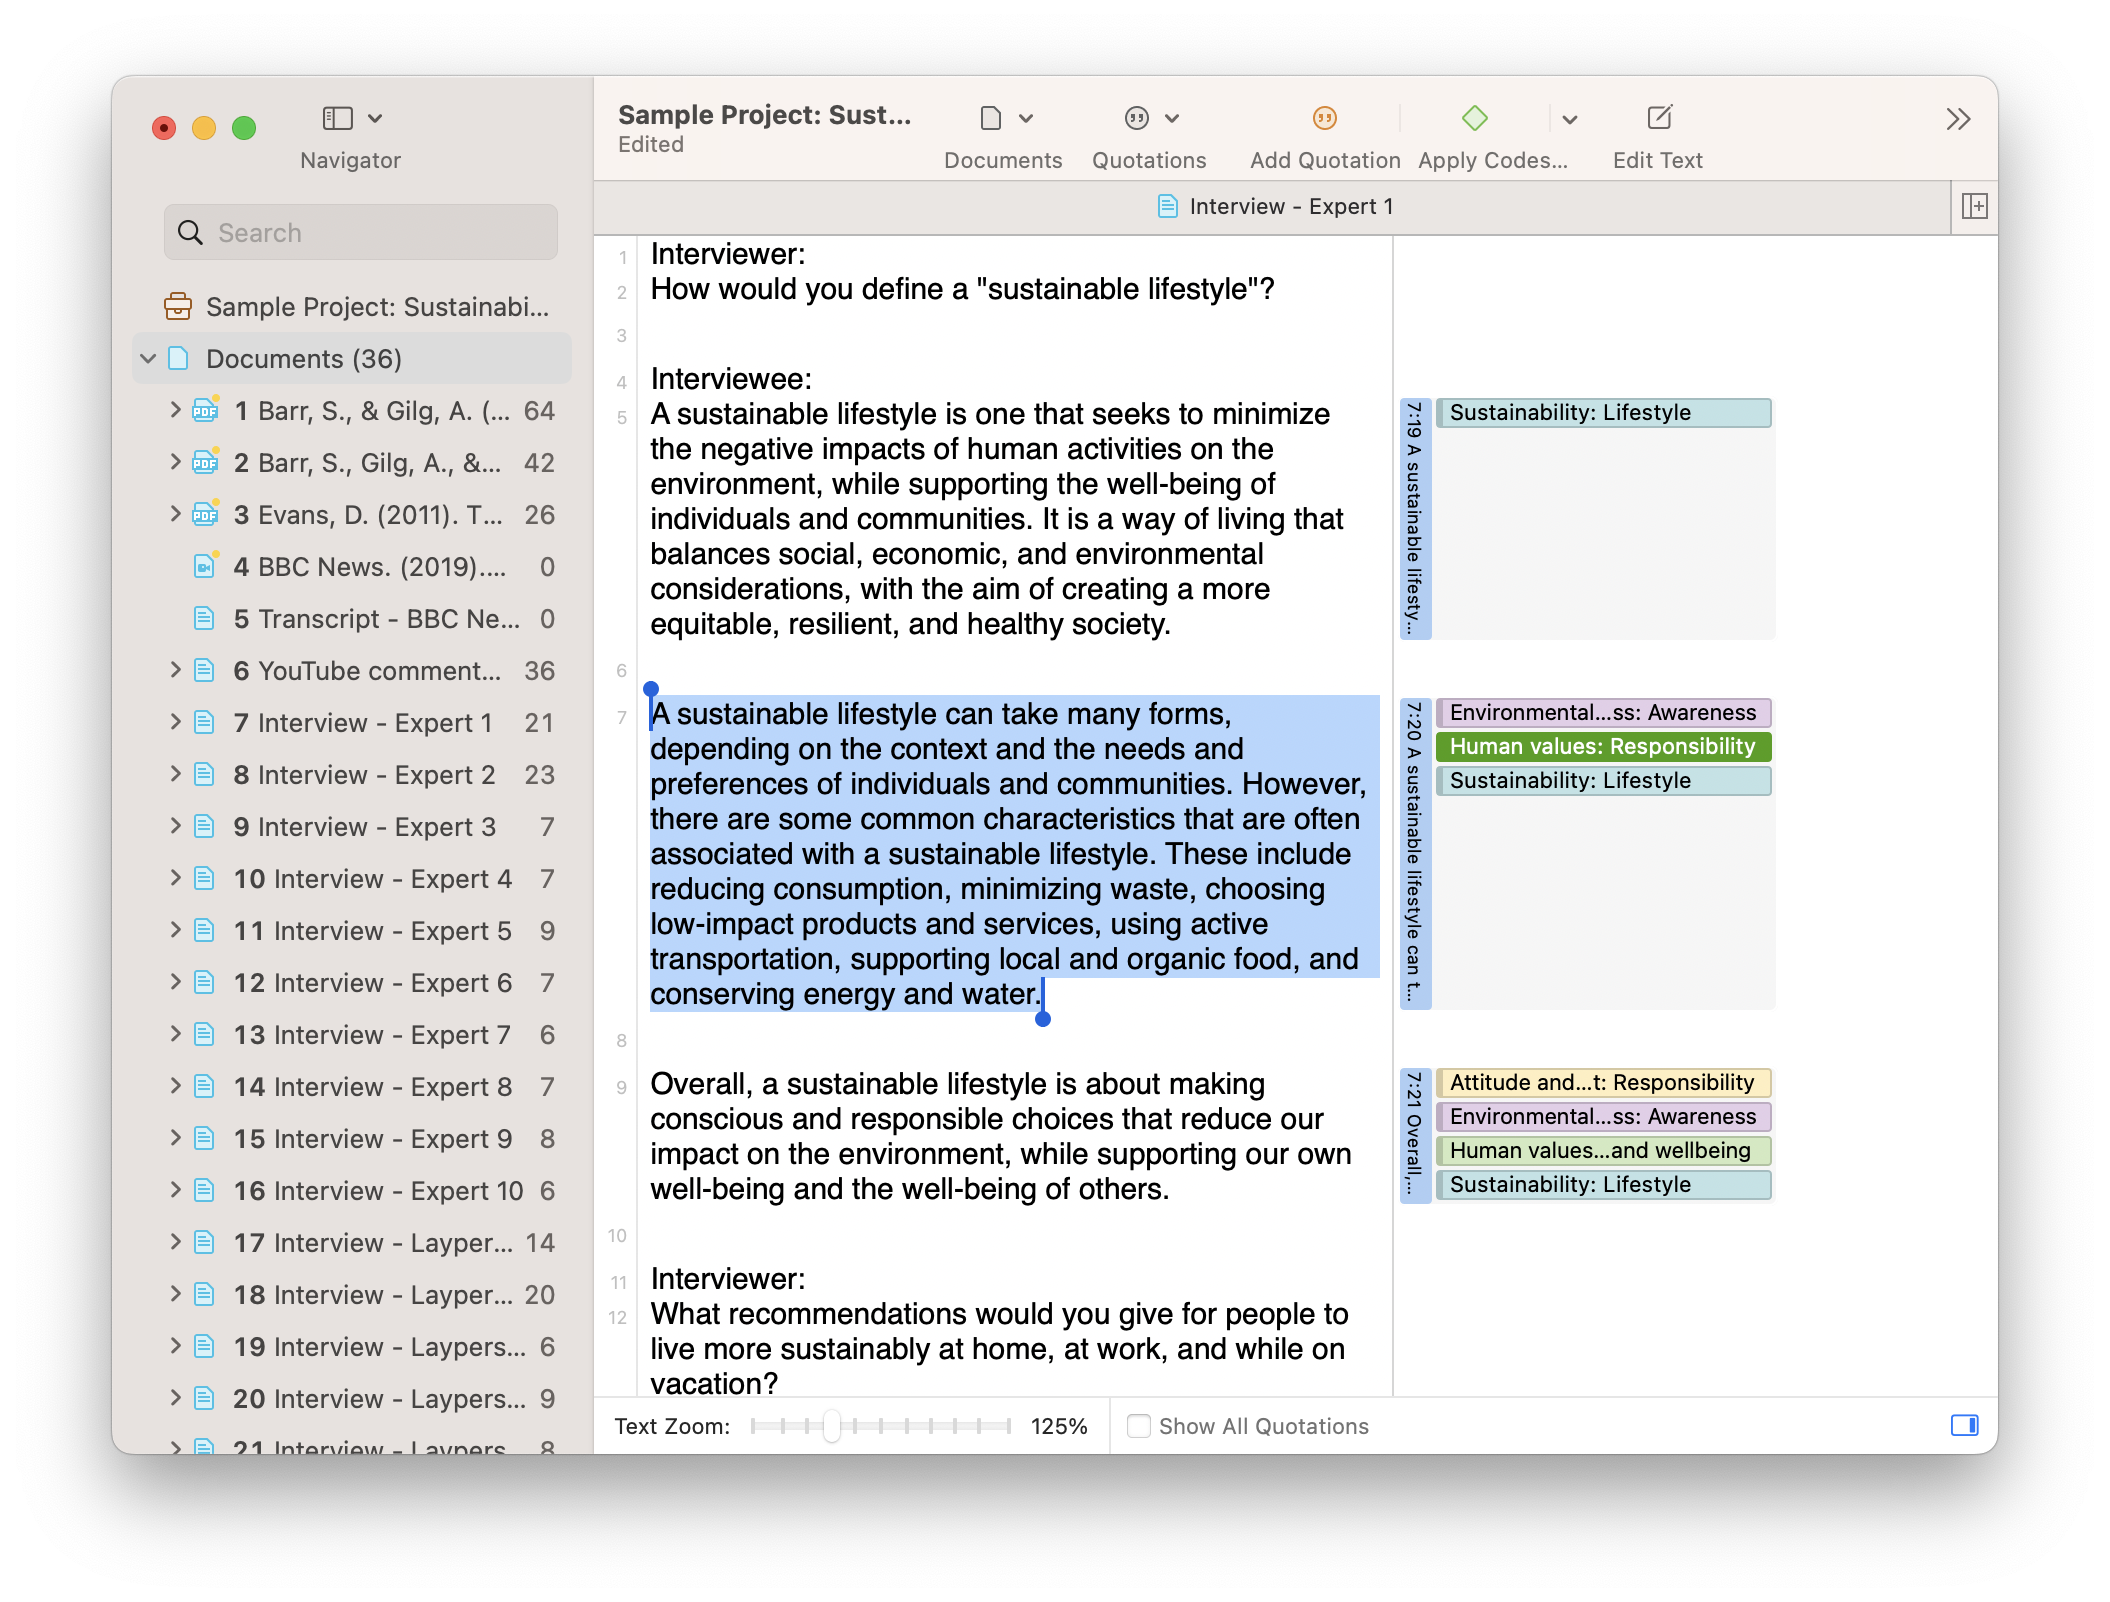
As you progress in the coding process, you should start to notice that distinct codes may be related to each other. In a sense, codes provide researchers with visual data that they can examine to generate useful themes. ATLAS.ti, for example, lets you examine your codes in the margin to give you a sense of which codes and themes frequently appear in your data. As you code your data, you can apply colors to your codes. This is a flexible method that allows you to create preliminary categories that you can examine visually for their abundance and patterns.
Later on, your codes can be organized into more formal categories or nested in hierarchies to contribute to a more robust thematic analysis.
Thematic analysis in other research methods
Especially in qualitative research, discrete analytical approaches overlap with each other, meaning that a sufficiently thorough analysis of your data can eventually yield themes useful to your research. Let's examine a few of the more prominent approaches in qualitative research and their relation to thematic analysis.
Grounded theory
Using grounded theory involves developing analysis iteratively through an inductive approach. While there is a great deal of overlap with thematic analysis approaches, grounded theory relies on incorporating more data to support the analysis in previous iterations of the research.
Nonetheless, the analytic process is largely the same for both approaches as they rely on seeking out phenomena that occur in abundance or distinct patterns. As you analyze qualitative data in either orientation, your main consideration is to observe which patterns emerge that can help contribute to a more universal understanding of the population or phenomenon under observation.
Narrative analysis
Understanding narratives is often less about taking large samples of data and more about unpacking the meaning that is produced in the data that is collected. In narrative research analysis, the data set is merely the narrative to be examined for its meaning, intent, and effect on its audience.
Searching for abundant or patterned themes is still a common objective when examining narratives. However, specific questions guide a narrative analysis, such as what the narrator is trying to say, how they say it, and how their audience receives the narrator's message.
Discourse analysis
Analyzing discourse is similar to analyzing narratives in that there is an examination of the subtext informing the use of words in communication. Research questions under both of these approaches focus specifically on language and communication, while thematic analysis can apply to all forms of data.
The scope of analysis is also different among approaches. Thematic analysis seeks to identify patterns in abundance. In contrast, discourse analysis can look at individual instances in discursive practices to more fully understand why people use language in a particular way.
However, the data resulting from an analysis of discursive practices can also be examined thematically. Discursive patterns within culturally-defined groups and cultural practices can be determined with a thematic analysis when utterances or interactional turns and patterns among them can be identified.
Content analysis
Among all the approaches in this section, content analysis is arguably the most quantitative. Strictly speaking, the words or phrases that appear most often in a body of textual data can tell something useful about the data as a whole. For example, imagine how we feel when a public speaker says "um" or "uh" an excessive number of times compared to another speaker who doesn't use these utterances at all. In another case, what can we say about the confidence of a person who frequently writes, "I don't know, but..."?
Content analysis seeks to determine the frequencies of aspects of language to understand a body of data. Unlike discourse analysis, however, content analysis looks strictly at what is said or written, with analysis primarily stemming from a statistical understanding of the data.
Oftentimes, content analysis is deductive in that it might apply previous theory to new data, unlike thematic analysis, which is primarily inductive in nature. That said, the findings from a content analysis can be used to determine themes, particularly if your research question can be addressed by directly looking at the textual data.
Using ATLAS.ti for qualitative analysis
For thematic analysis, software is especially useful for identifying themes within large data sets. After all, thematically analyzing data by hand can be time-consuming, and a researcher might miss nuanced data without software to help them look at all the data thoroughly.
Coding qualitative data
For qualitative researchers, the coding process is one of the key tools for structuring qualitative data to facilitate any data analysis. In ATLAS.ti, data is broken down into quotations or segments of data that can be reduced to a set of codes that can be analyzed later.
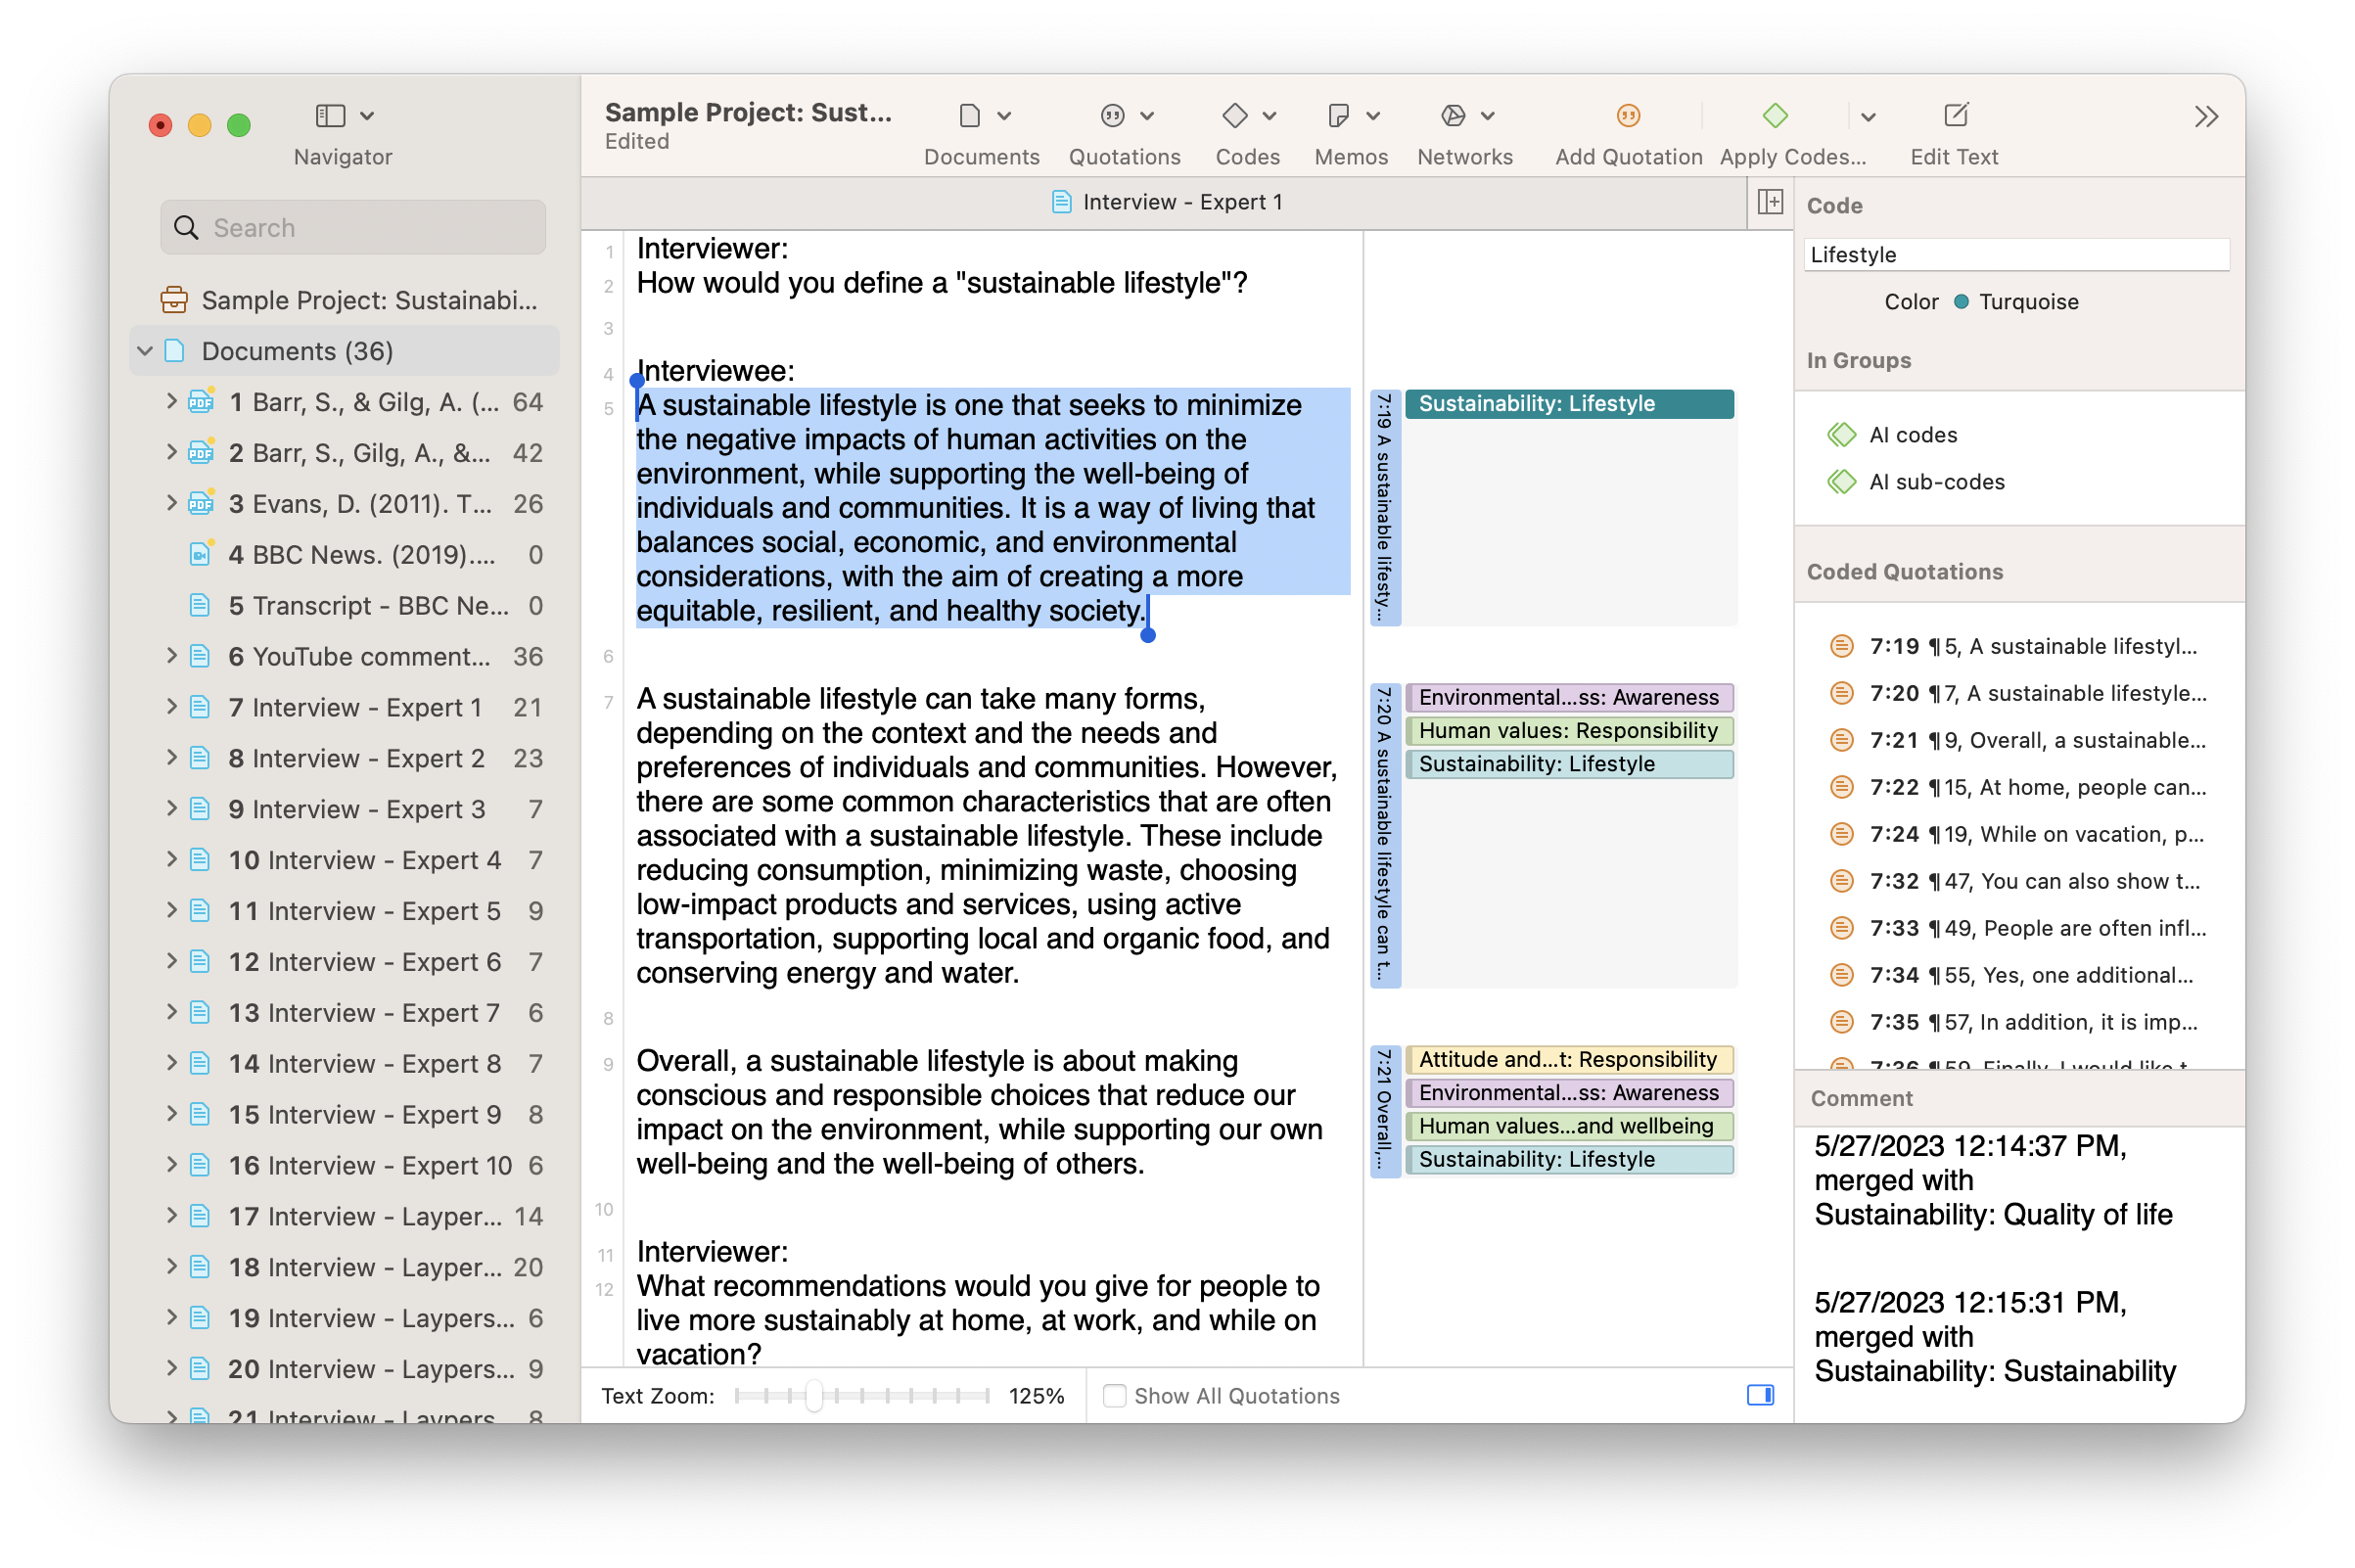
The codes and quotations appear in the margin next to a document in ATLAS.ti. This visualization is useful in showing how much of your data is coded and what concise meaning can be inferred from the data. In terms of thematic analysis, however, the codes can be assigned different colors based on what the researcher perceives as categories emerging from their project, as seen in the example above.
As you code the data iteratively, reviewing themes as they emerge, you can organize discrete codes within larger categories. ATLAS.ti provides spaces in your project called code groups and code categories where sets of codes in tandem represent broader, more theoretically developed themes. This approach to data organization, rather than merging codes together as broader units, allows for a more particular analysis of individual codes as your research questions evolve and develop over the course of your project.
ATLAS.ti tools for thematic analysis
As discussed above, analyzing qualitative data for themes can often be a matter of determining which codes and which categories of codes appear across the data and patterns among them. Indeed, any analysis software can assist you with this coding process for thematic analysis. The tools in ATLAS.ti, however, can help to make the process easier and more insightful. Let's look at a few of the many important features that are invaluable to conducting thematic analysis.
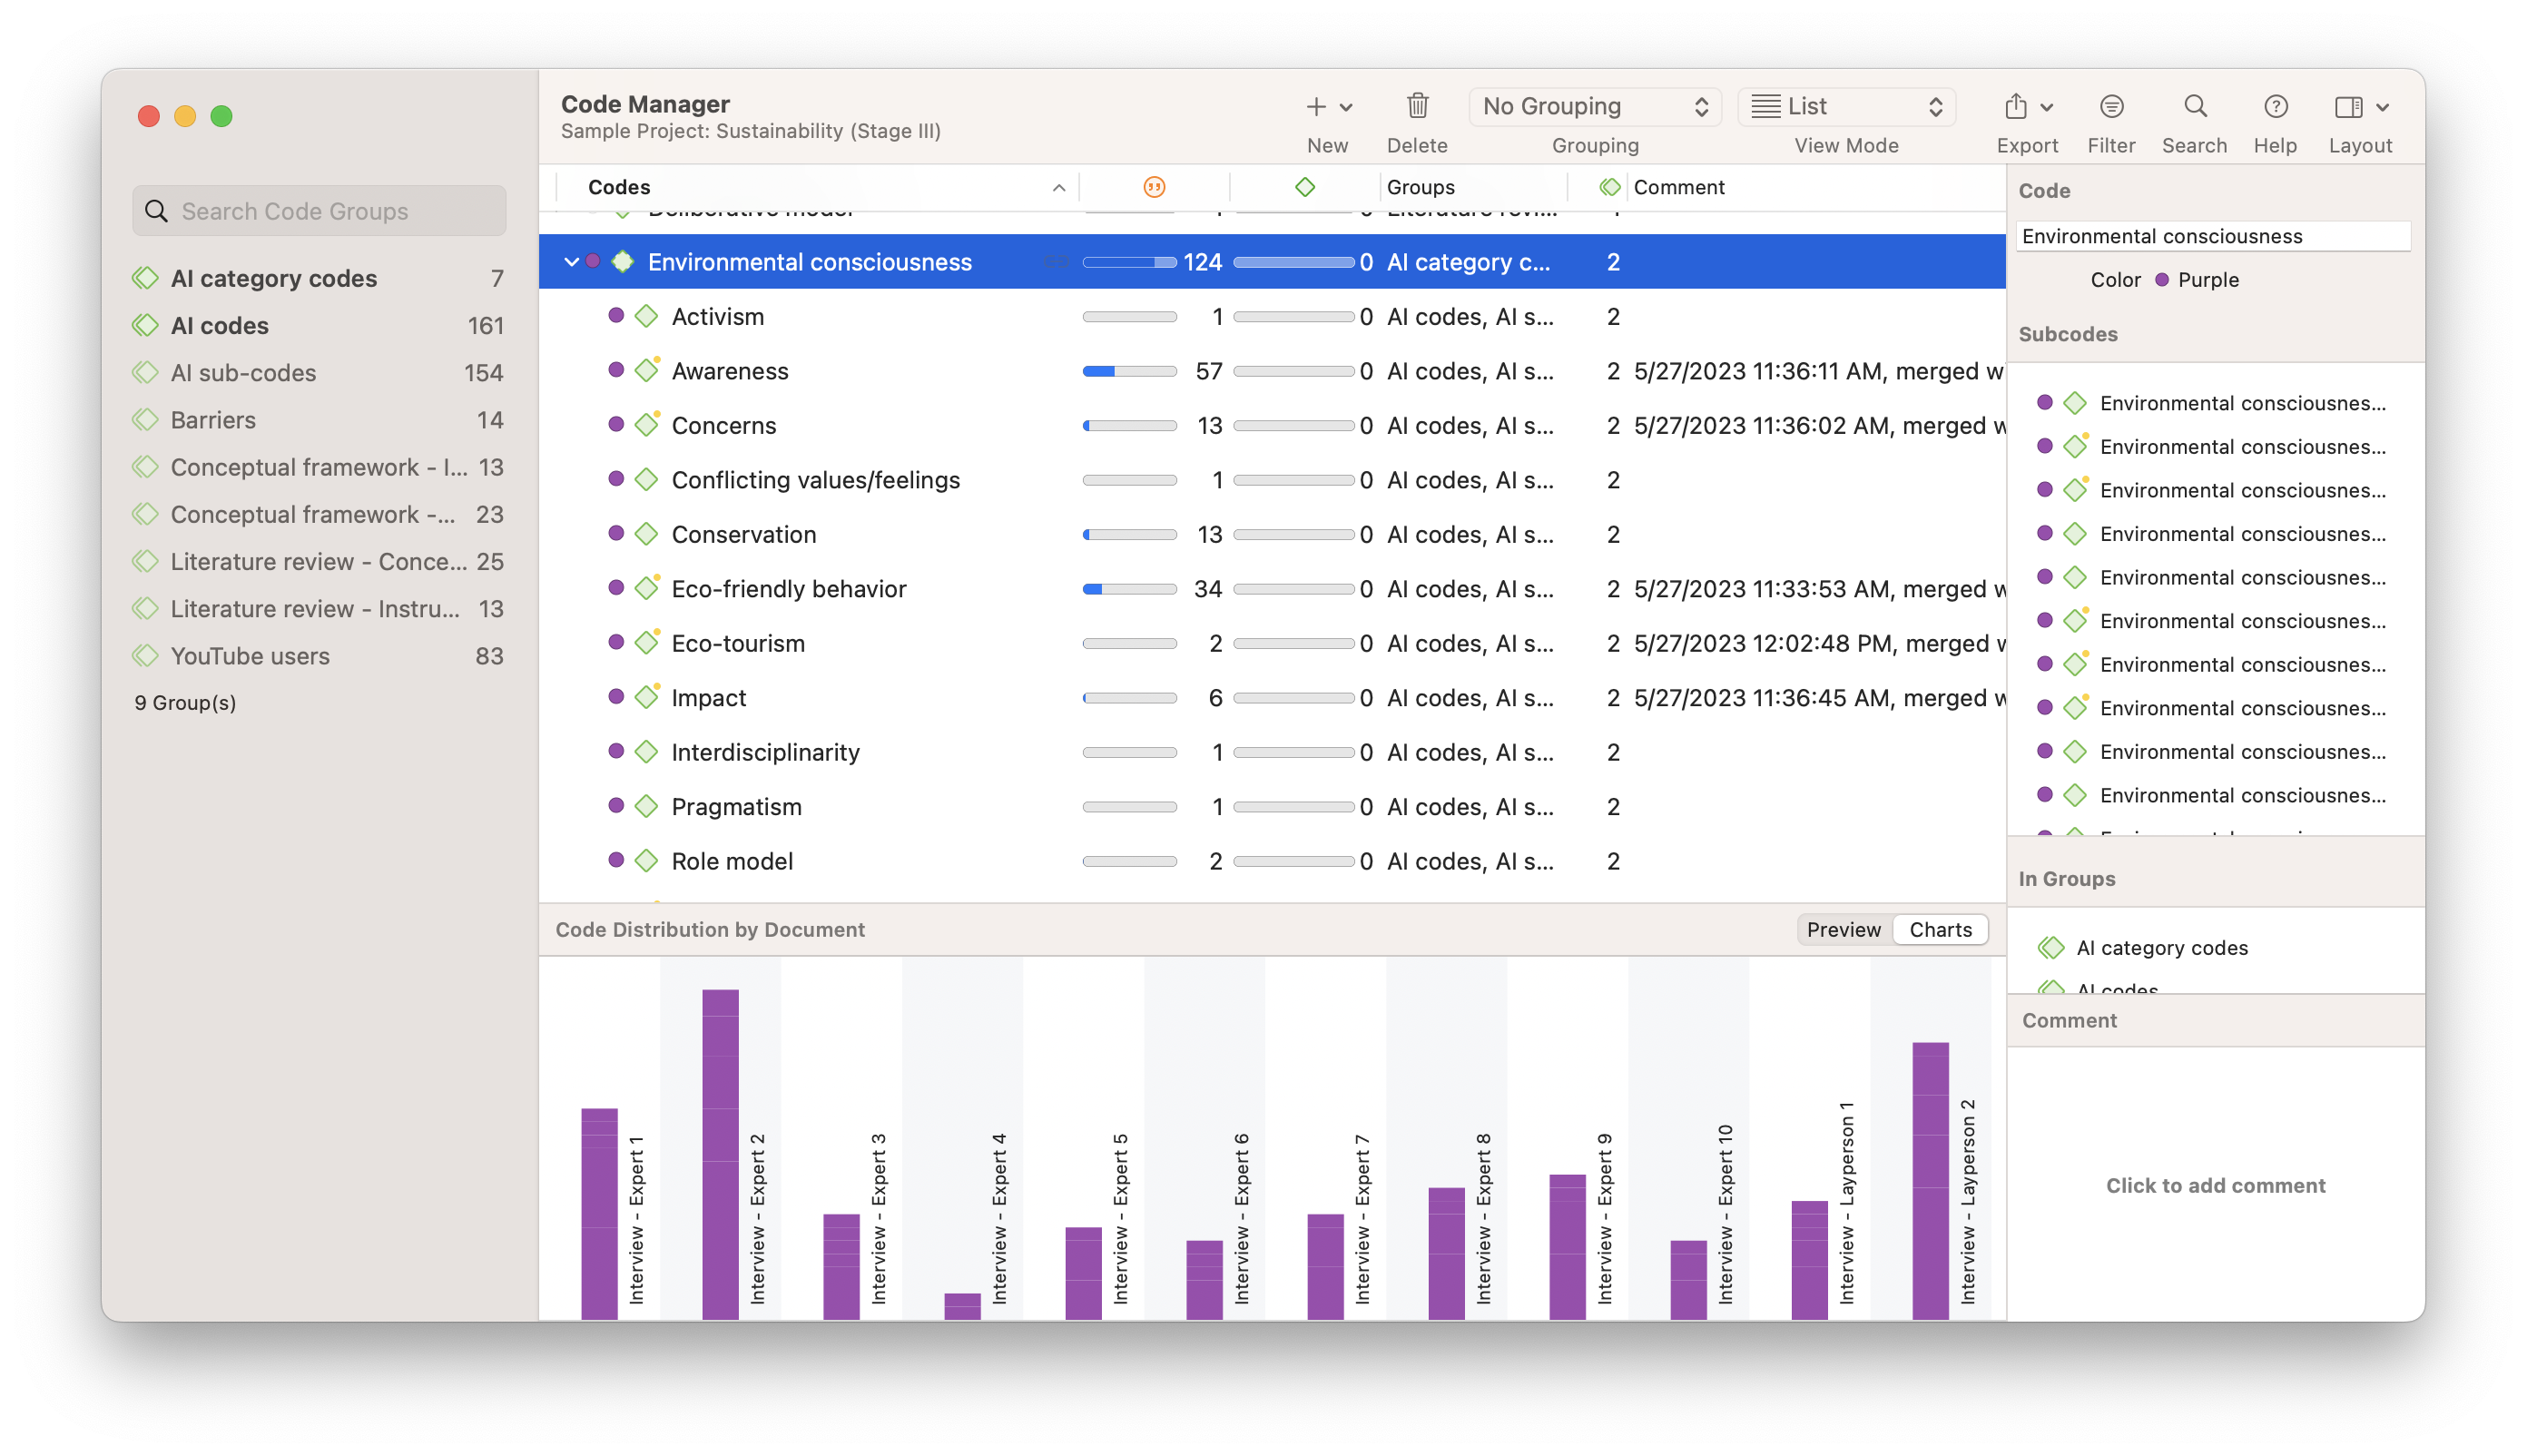
Code Manager
The Code Manager is ATLAS.ti's central space where researchers can organize and analyze their codes independent of the raw data. Researchers can perform numerous tasks in the Code Manager depending on their research questions and objectives, including looking just at the data that is associated with a particular code, organizing codes into hierarchies through code categories and nested sub-codes, and determining the frequencies and level of theoretical development for each code.
Co-Occurrence Analysis
Combinations of codes that overlap with each other can also illuminate themes in your data, perhaps more ably than discrete codes. This is different from understanding codes as groups, as an analysis for codes that frequently occur together in the data can give a sense of the relationships between different aspects of a phenomenon.
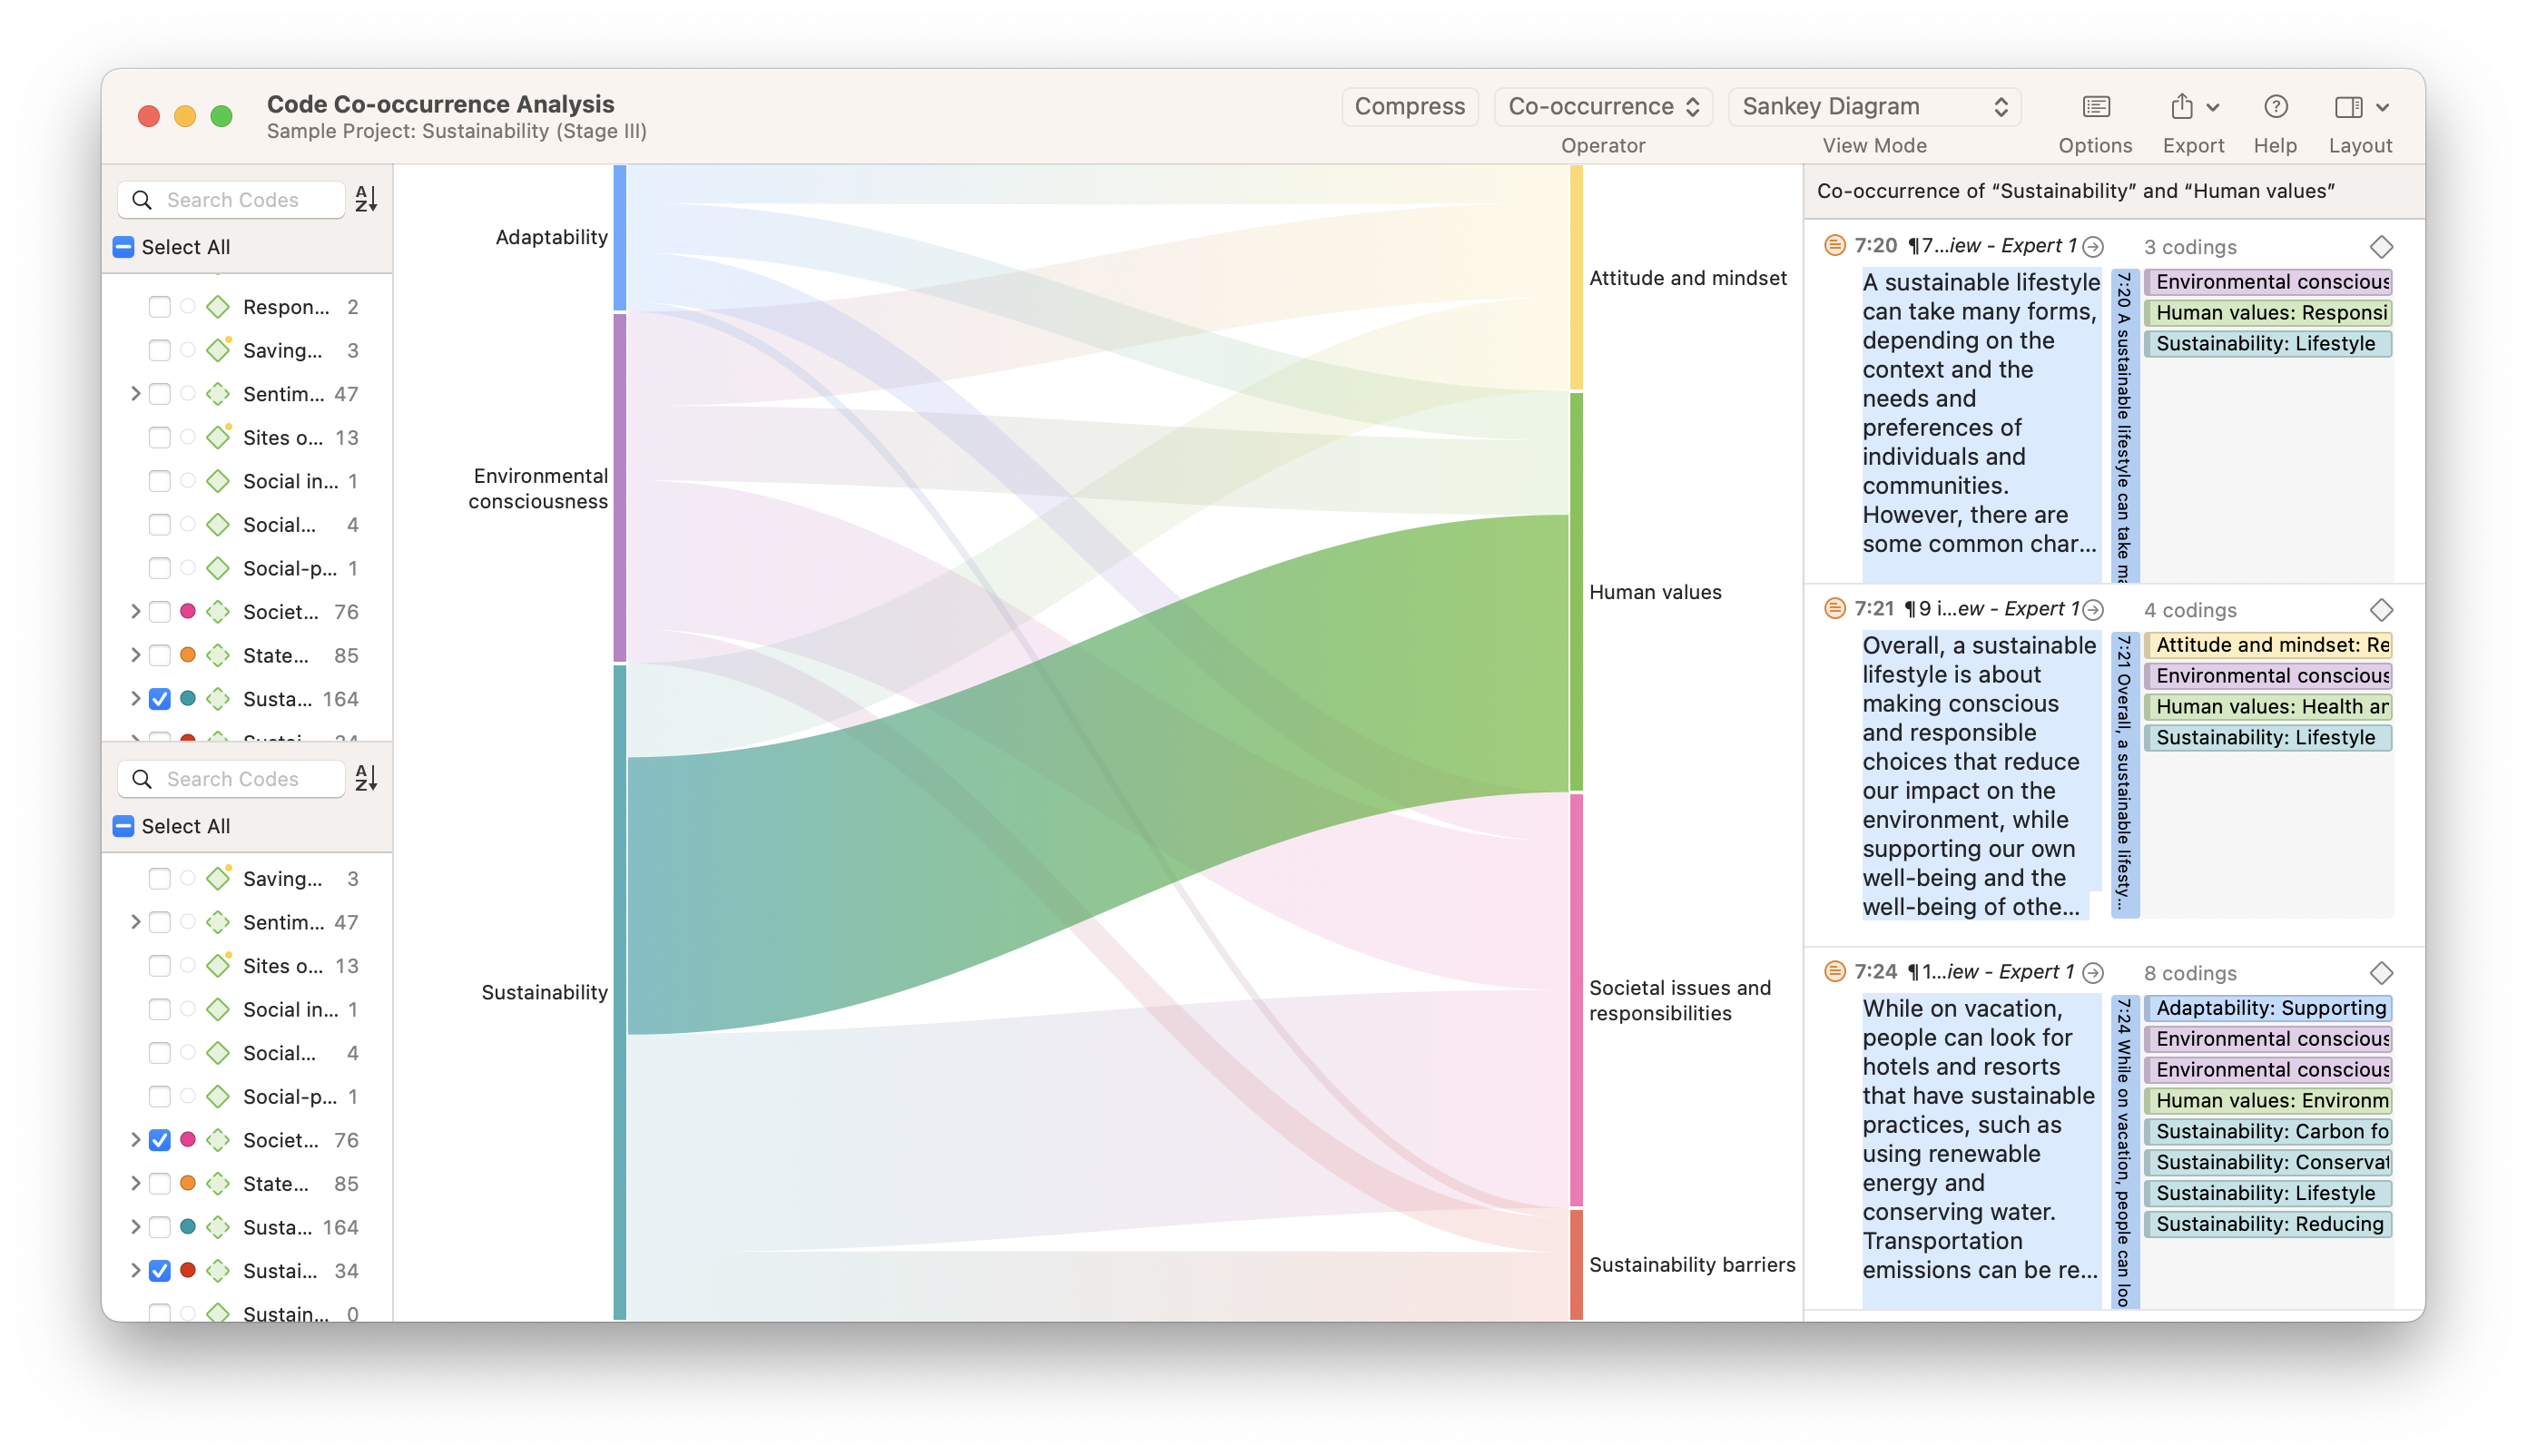
The Co-Occurrence Analysis tool helps researchers determine co-occurrence between different codes by placing them in a table, a bar chart, a Sankey diagram, or a force-directed graph. These visualizations can illustrate the strength of relationships between codes to you and your research audience. The relationships themselves can also be useful in generating themes useful for your analysis.
Word Frequencies
Qualitative content analysis depends on the frequencies of words, phrases, and other important aspects found in textual data. These frequencies can also help you in generating themes, particularly if your research questions are focused on the textual data itself.
The Word Frequencies tool in ATLAS.ti can facilitate a content analysis leading to a thematic analysis by giving you statistical data about what words appear most often in your project. Suppose these words can contribute to the development of themes. In that case, you can click on these words to find relevant quotations that you can code for thematic analysis. In addition, you can use ATLAS.ti’s Text Search tool to search for data segments that contain your word(s) of interest and automatically code them.
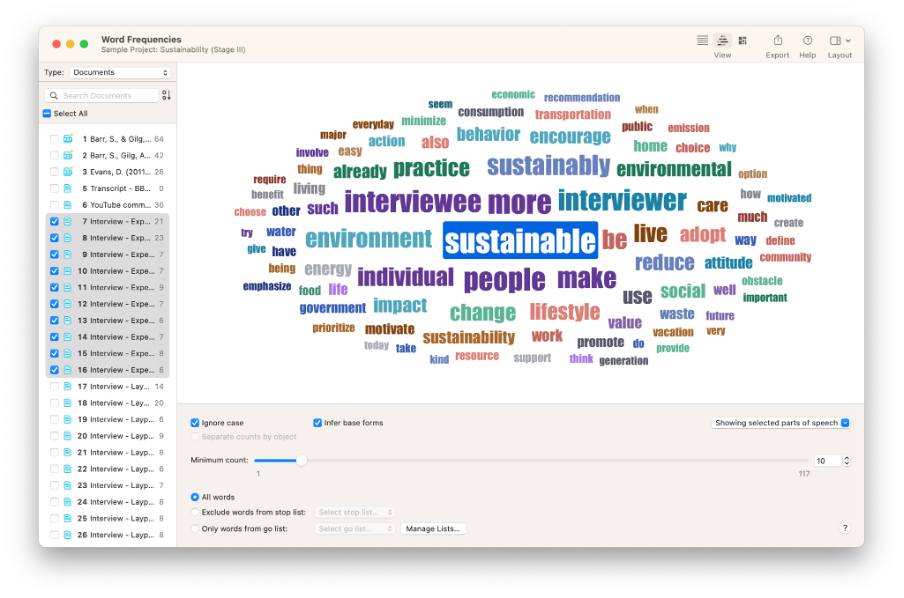
You can also use themes to refine the scope of the Word Frequencies tool. By default, Word Frequencies looks at documents, but the tool also allows researchers to filter the data by selecting the codes relevant to their query. That way, you can look at the most relevant data quotations that match your desired codes for a richer thematic analysis.
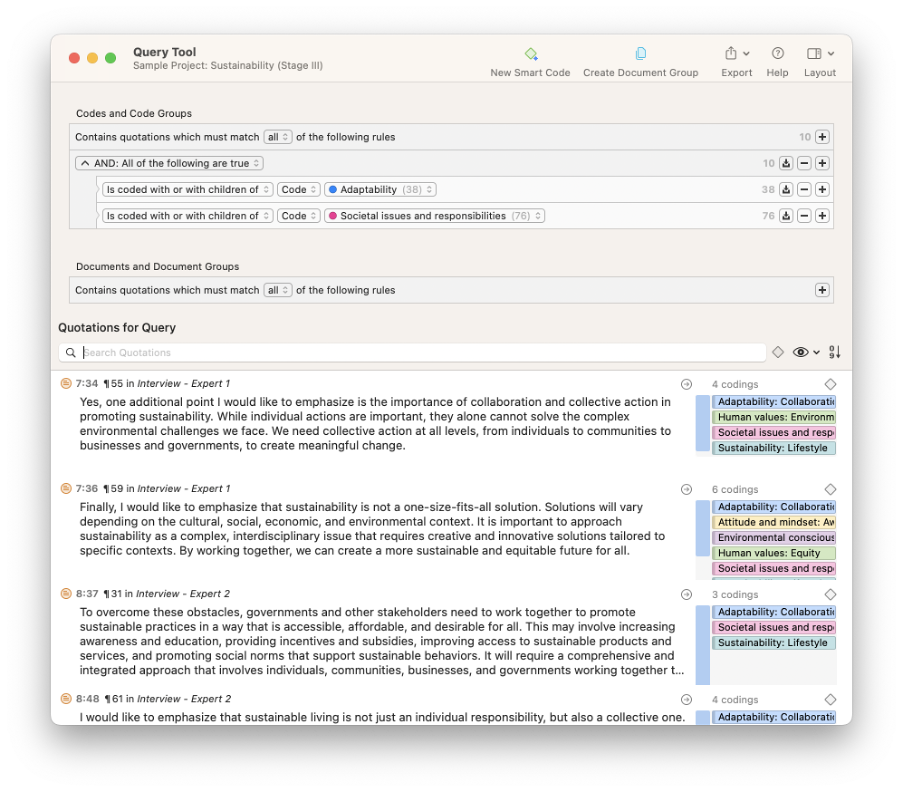
Query Tool
Patterns and themes may also emerge from combinations of codes, in which case the Query Tool can help you construct smart codes. Smart codes are more versatile than nested sub-codes or code groups as they allow you to set multiple criteria based on true/false conditions as well as proximity. For example, while a code group simply aggregates distinct codes together to show you quotations with any of the included codes, you can define a set of rules to filter the data and find the most relevant quotations for your thematic analysis.
TreeMaps
A systematic and rigorous approach to thematic analysis involves showing your research audience how you arrived at your codes and themes. In qualitative research, visualizations offer clarity about the data in your project, which is a critical skill when explaining the broader meaning derived from otherwise unstructured data.
A TreeMap of codes is a representation of the application of codes relative to each other. In other words, codes that have been applied the most often in your data occupy the largest portions of the TreeMap, while less frequently used codes appear smaller in your visualization. This can give you a sense of the prevalence of certain codes over other codes. Moreover, when you assign colors to codes along the lines of themes and categories, you can quickly get a visual understanding of the themes that appear most often in your project.
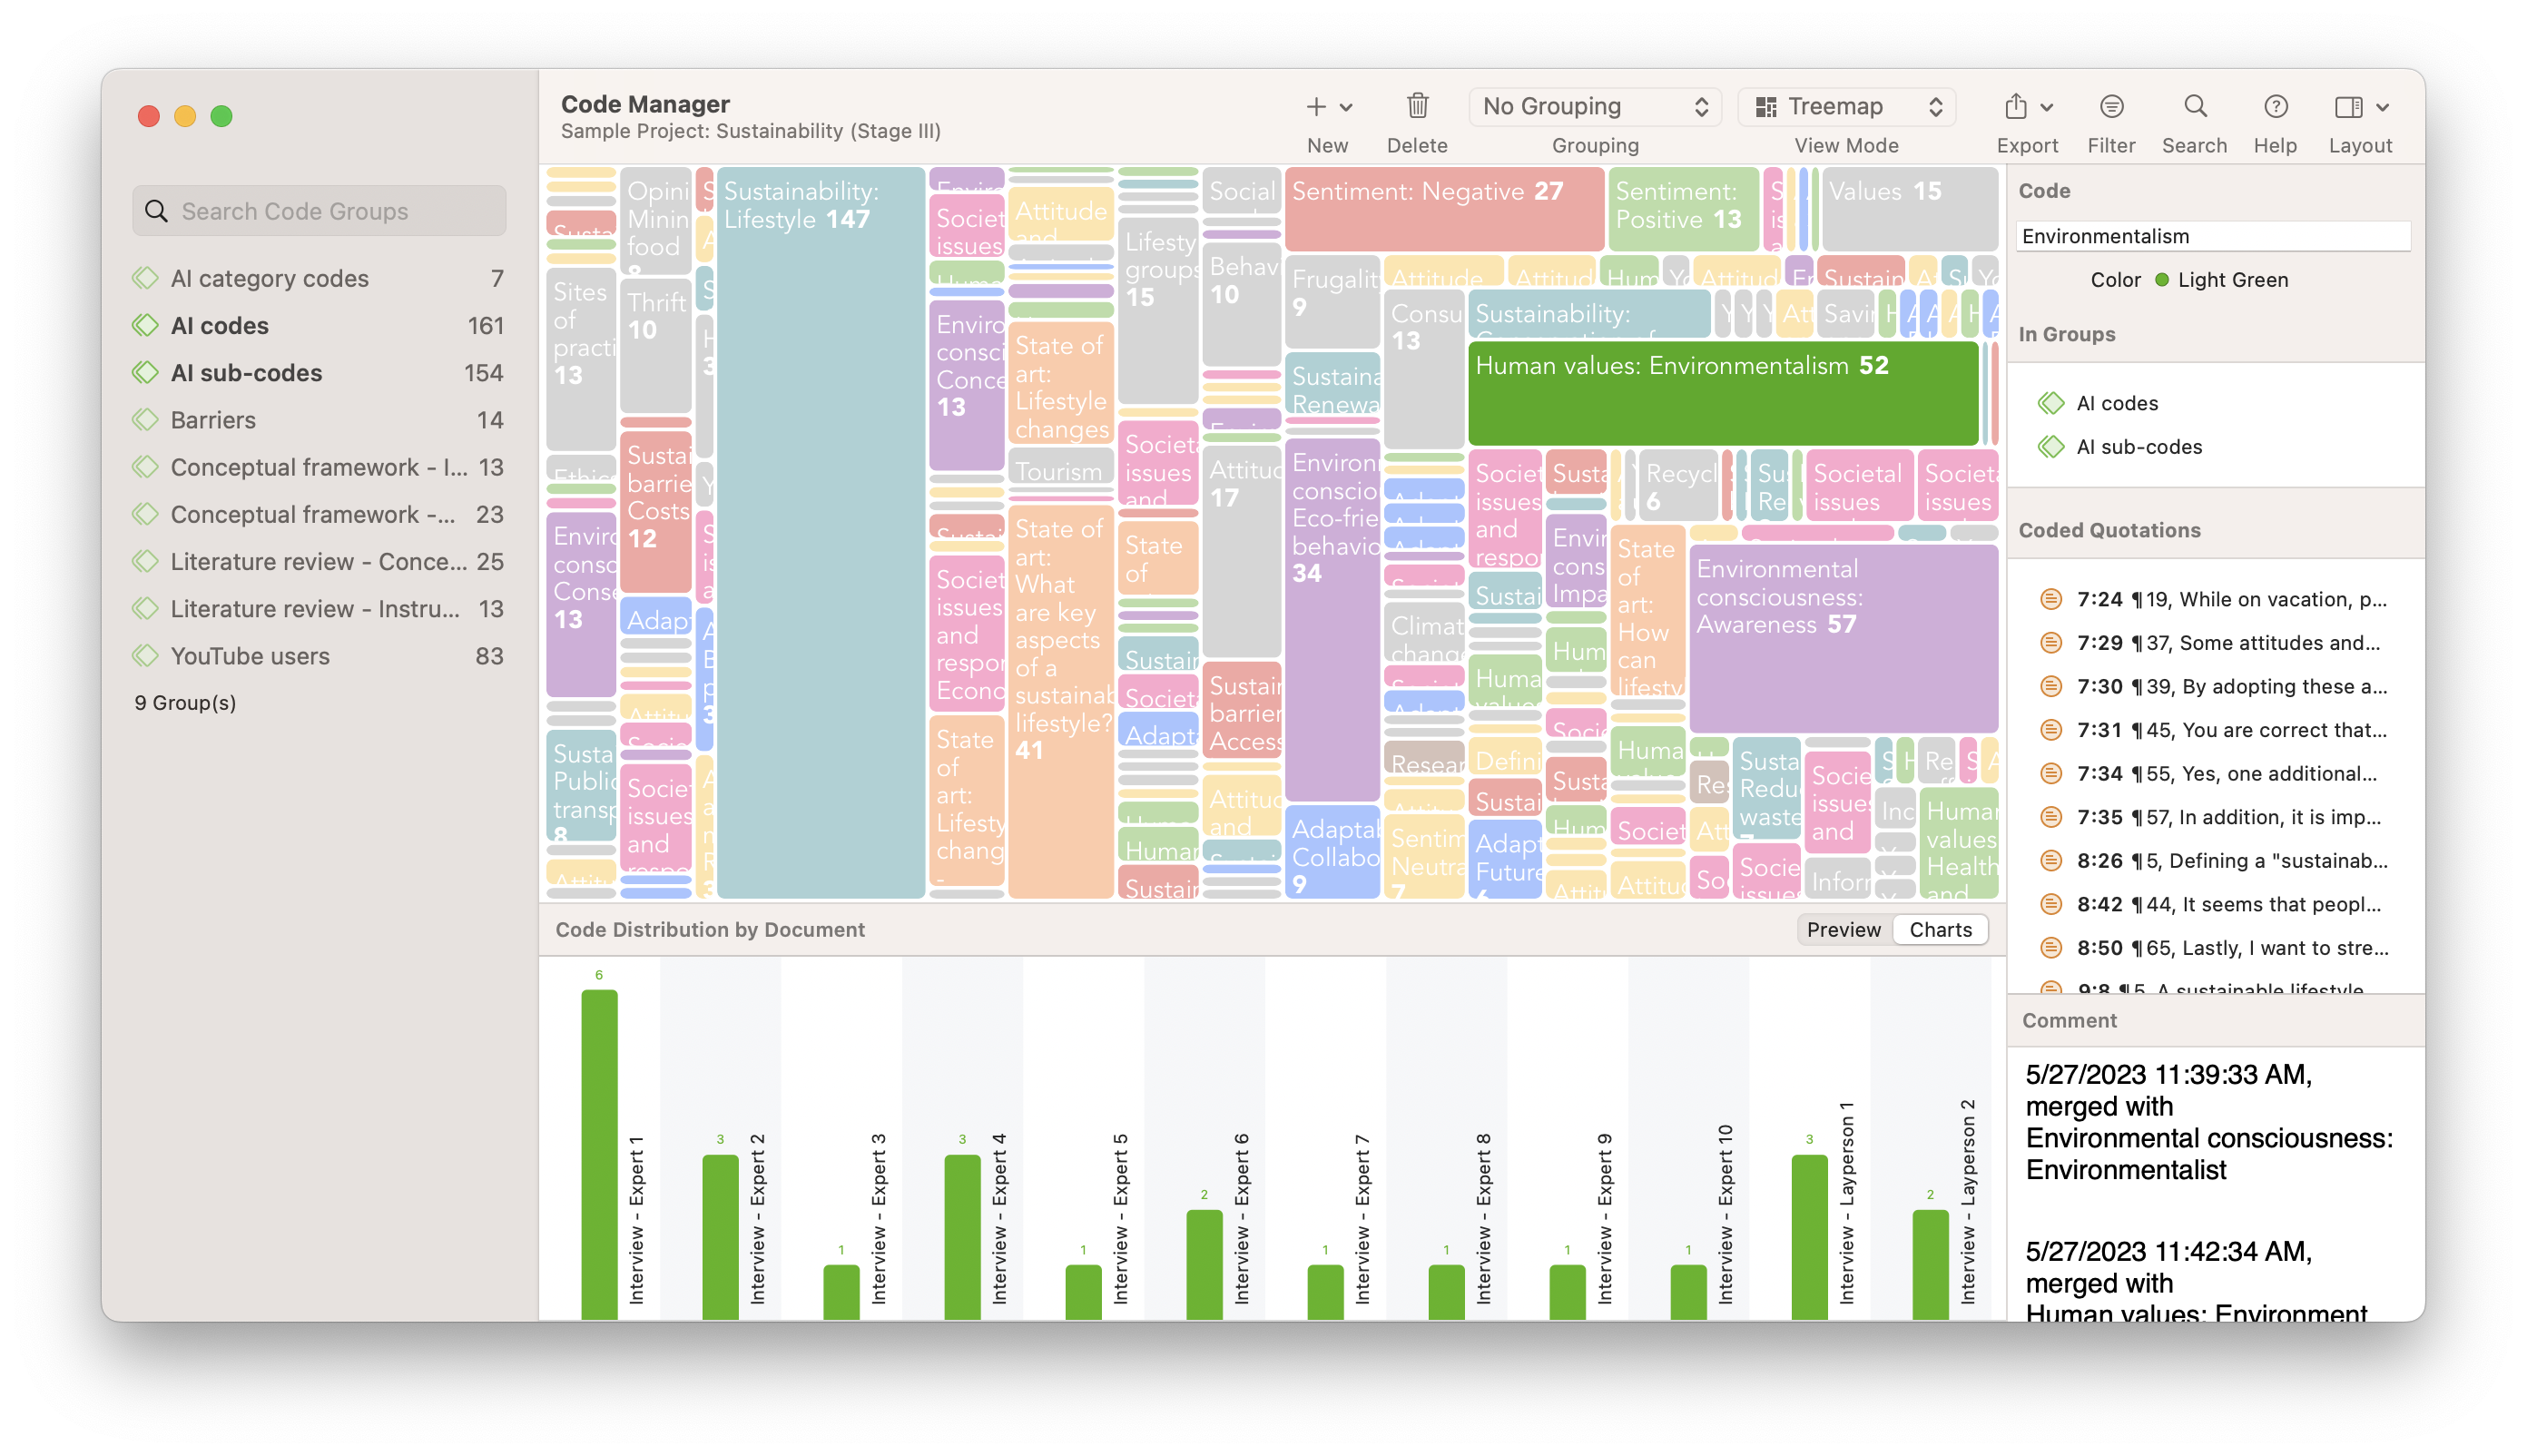
As a result, the TreeMap for codes can help provide a visual, thematic map that you can export as an image for use in explaining key themes in your research reports.
Considerations for thematic analysis
In qualitative research, thematic analysis is a useful means for generating a theoretical framework for qualitative concepts and phenomena. As always, though, theoretical development is best supported by thorough research. A theory that emerges from thematic analysis can be affirmed by additional inquiries, whether through a qualitative, quantitative, or mixed methods study.
Further research is always recommended for qualitative research, such as those that employ a thematic analysis, for the very reason that themes in qualitative concepts are socially constructed by the researcher. In turn, future research building on thematic analysis depends on a research design that is transparent and clearly defined so that other researchers can understand how the themes were generated in the first place. This requires a detailed accounting of the data and the analysis through comprehensive detail and visualizations in the final report.
To that end, ATLAS.ti's various tools are specifically designed to allow researchers to share and report their data to their research audiences through data reports and visualizations. Especially where qualitative research and thematic analysis are involved, researchers can benefit from transparently showing their analysis through data excerpts, visualizations, and descriptions of their methodology.