Improve decision-making with better survey analysis software

With ATLAS.ti, you can take a deep dive into the minds of your survey participants and unlock to-the-point qualitative findings in complex data.

Generate qualitative insights from surveys – fast and intuitive

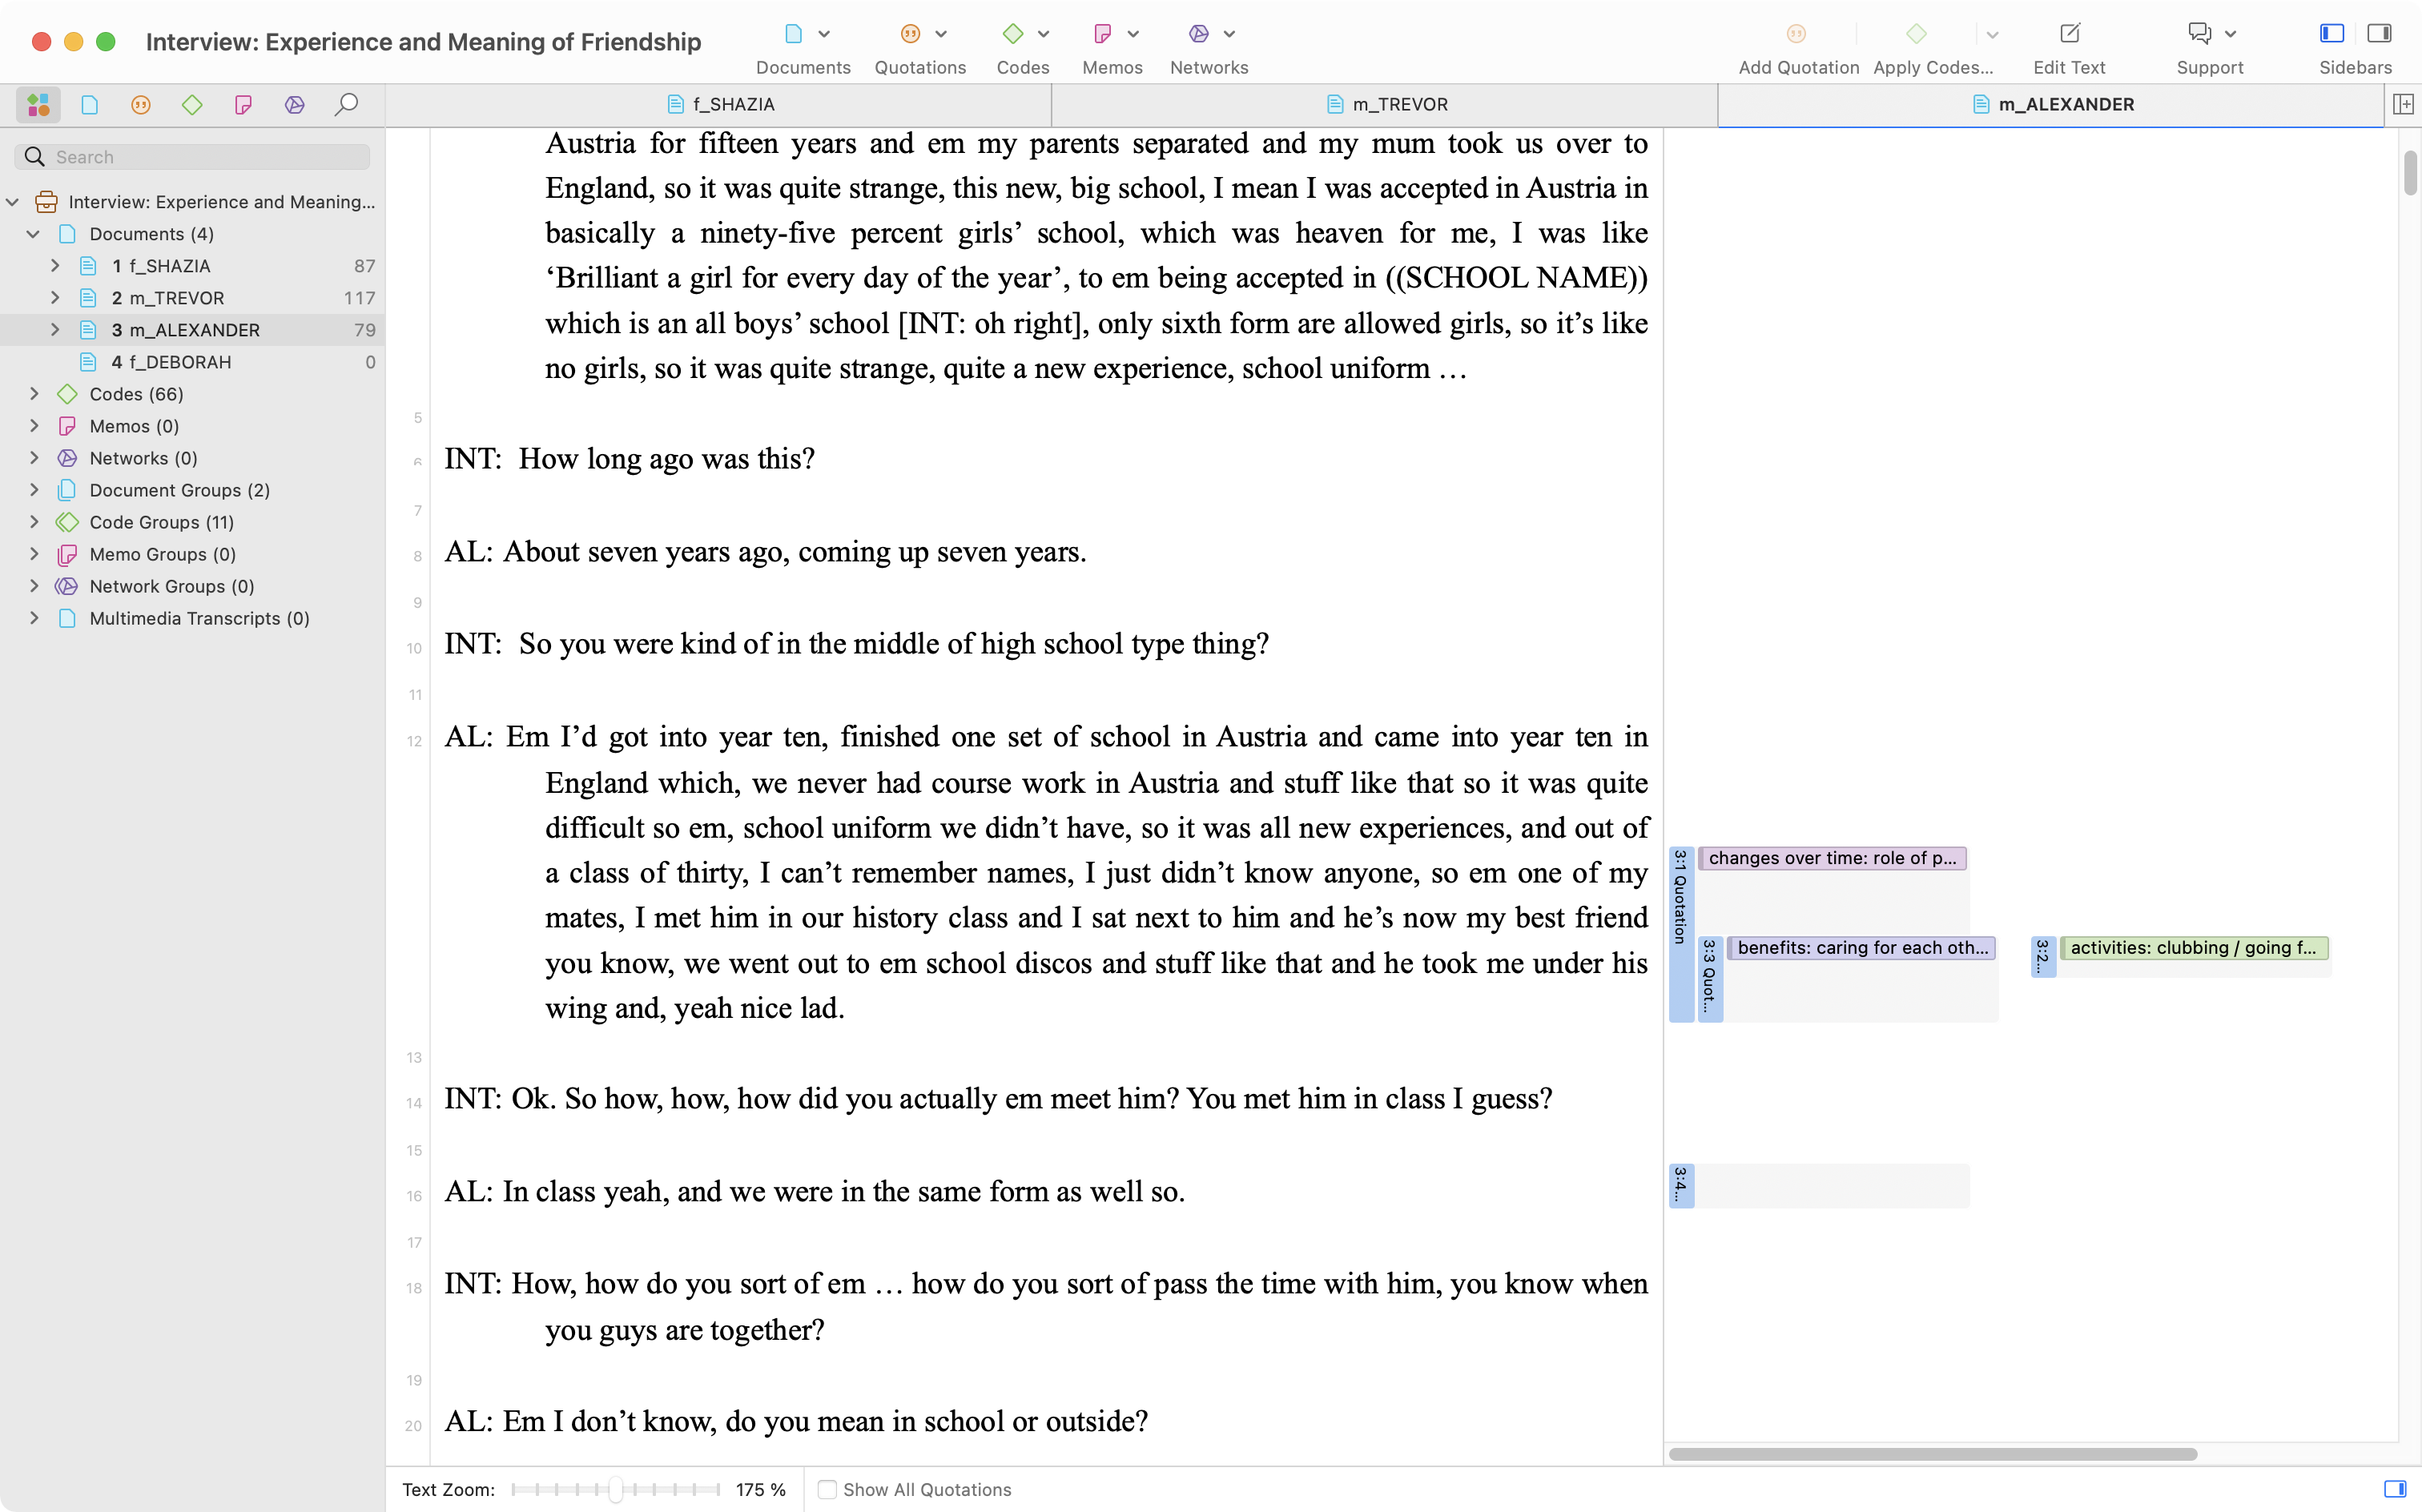
Leverage a seamless research workflow that saves you time without cutting corners. ATLAS.ti takes the confusion out of managing and analyzing your survey data. Our qualitative analysis tools help you reveal insights and share results without steep learning curves.
Unlock behaviors and emotions in survey data

Analyze responses to any type of question and discover your survey's participants' behavioral and emotional drivers. Our proven survey data analysis tools are powerful enough to help you identify even the most nuanced attitudes and motivations.

Go beyond quantitative data analysis

Get more than just quantitative reports and descriptive statistics: ATLAS.ti and its analysis capabilities provide you with research tools that help you uncover the "why" behind your participant's answers. Our survey analysis software enables you to grasp the full picture by discovering qualitative insights that lead to better results. ATLAS.ti is the easiest and most comfortable survey data analysis tool to use for analyzing survey data.

ATLAS.ti boasts many benefits including intuitive design. But its customer service really is what wins them the gold star. Especially for those who are not too technologically savvy, ATLAS.ti is the software that will have the patience to deal with you!
Cristina Parajon
Sociology student, Harvard University
ATLAS.ti is the easiest and most comfortable software to use for coding qualitative data.
Svetlana Poleschuk
PhD, Education Researcher, UNICEF
Qualitative data offers great value in really understanding the context for any research endeavour, and ATLAS.ti is the go-to software to pull analyses together in a systematic way.
Prof. Michelle J. Hindin
Founder and Director - Evidence 4 Global Impact, LLC
I want to say thank you for helping me today. With your help I am now able to use ATLAS.ti easier to finish my dissertation. Again, I want to say thank you. The ATLAS.ti support is by far the best support I have ever received from a software company
Nicholas Belongie, PhD
Nicholas Belongie, PhD - University at Buffalo, USA
The ATLAS.ti support desk helped me a great deal with several challenges in ATLAS.ti. On the way I learned how to solve issues in future! I can recommend working with ATLAS.ti and diving into its possibilities because you'll be surprised by what this fantastic analysis software can have you discover from your data!
Marieke De Wijse-Van Heeswijk
PhD researcher - Radboud University
I have been an ATLAS.ti user for over 20 years, and during that time the software has always been my first choice for qualitative research. ATLAS.ti continues to innovate and improve each year adding new features and benefits for its user community. I highly recommend it for your qualitative research.
Ken Riopelle
Research Professor, Wayne State University
ATLAS.ti has been a great tool for my PhD research which I have been using to analyze qualitative interviews from Ghana and Nigeria. It was the perfect solution, and we were happy to learn that we could collaborate with researchers in any country or institution without obtaining a special license.
Dr. Kwabena Kusi-Mensah
FWACP (Psych), MSc.CAMH (Ib.), PhD Candidate in Psychiatry, University of Cambridge
The Canadian Foundation for Animal-Assisted Support Services {CFAS} is a grateful recipient of the ATLAS.ti software. I have gradually learned more about using the software to share our charity's narrative, presentation content, and research project outcomes. ATLAS.ti staff have been highly supportive and patient with me as I continue to embark on this incredible journey of discovery.
Joanne Moss
CEO/Founder - The Canadian Foundation for Animal-Assisted Support Services {CFAS}
The ATLAS.ti organization has a strong support team available to researchers and the trainers are excellent. Their webinar presenters are world-class experts who show how ATLAS.ti can be used to analyze data from a wide variety of disciplines.
Dr. Karin Olson
PhD, RN, FAAN, Adjunct Professor, School of Nursing - The University of British Columbia
We are an early-stage startup building the world's first virtual clinic specialized in Team-Based Care. I used ATLAS.ti first in studies. Then I used it for my work at the World Health Organization. Now we are using it for many of our research activities at Consulto.
Basem Higazy
Co-founder and CEO of Consulto

Qualitative survey analysis doesn’t need to be complex

Import and manage survey data

With ATLAS.ti, you can easily import survey data from popular survey tools and analyze any type of questionnaire data – whether it's responses to standardized or open-ended questions.

Analyze surveys with ease and speed

Utilize easy-to-learn workflows that save valuable time, such as auto coding, sentiment analysis, team collaboration, and more.

Leverage AI-driven tools

Make efficiency a priority and let ATLAS.ti do your work with AI-powered research tools and features for faster results.

Visualize and present findings of your surveys

With just a few clicks, you can create meaningful visualizations like bar charts, word clouds, diagrams, networks, among others.

The faster way to make sense of your survey data. Try it for free, today.

FAQ
What is survey data analysis?

Survey data analysis helps you make sense of the data you've collected in your survey and gain insights for your study or business. Each survey respondent answers the same questions as other respondents, allowing for easy data organization of quantitative data in tables for further statistical analysis for reports and data visualizations.

What are the uses of survey data analysis?

Surveys help researchers collect and analyze data from large numbers of respondents at once. Targeted surveys can capture the opinions and perspectives of a particular population, allowing researchers to generate theoretical insights about that population.

In professional domains, survey data analysis is practical for market research and employee feedback, and the analysis of survey responses in an analysis software can help uncover insights for future research.

You can use survey data to plan for upcoming events (e.g., determine what activities appeal to your customers) or get feedback on product design (e.g., which color or logo draws the most positive response from respondents).

What are closed and open-ended questions?

Closed questions ask survey respondents to select from a set of potential choices when answering a survey item. For example, a survey item may ask respondents to choose their level of satisfaction with a product on a scale of 1 to 5.

An open-ended question allows respondents to provide a free response to an item. For example, a survey item may ask respondents to explain why they are satisfied or unsatisfied with a product. For survey items with no choices, a space for open-ended answers allows respondents to write whatever they want to address the question.

Closed questions may also provide a space for limited, open-ended answers, such as a space next to "Other" in a list of choices about a respondent's favorite brand or shopping habits. When a survey researcher lists brands to choose from, they may not be able to account for all potential brand names. A space to add an open-ended response can allow respondents to provide an answer when their choice is not on the list.

What is the difference between correlation and causation?

Correlation refers to two phenomena occurring in the same place or at the same time. A correlation tells you that there is a relationship between two variables.

The challenge with correlation is that it is not readily clear which variable influences which. Just because two things happen at the same time or in quick succession does not mean there is a relationship between the two.

For example, consider a survey asking respondents about their income and health. The data might indicate that those who report higher income levels also perceive their health to be better than those who report lower income levels.

This correlation raises many questions that can help determine causation. Are rich people healthier because, for example, they can afford better medicines, more nutritious foods, and exercise classes? Or are healthier people wealthier because it is easier for them to earn money?

Causality means that there is a clear cause-and-effect relationship between variables. In other words, causality is when you know for sure which variable affects which.

For example, it is quite certain that exercise has a positive influence on muscle building. Often other influencing variables are not considered. For example, vaccination skeptics argue that excess mortality increases among people who receive vaccinations against coronavirus.

Researchers should consider other variables, such as the age of the vaccinated. When the ages of those vaccinated are higher than average, the probability of dying may also be higher, placing into question any causation between vaccination and excess mortality.

What survey software can I use?

There are a number of platforms such as Survey Monkey and Qualtrics that can help you with the data collection phase of the survey process. In many platforms, survey results can often be exported into spreadsheets that aggregate the data points provided by all survey respondents.

Survey results and text data from these platforms can often be imported into ATLAS.ti to allow for advanced data analyses of open-ended responses. Tasks such as customer feedback analysis and market research can be started in survey research platforms for processing in qualitative analysis tools like ATLAS.ti.

How can I clean or prepare survey data for analysis?

Raw data cannot be easily analyzed, so researchers should perform data cleaning to organize survey responses to ensure efficient survey data analysis. Good survey design can help prevent user error, but there is always the possibility of flawed responses, which can affect the survey results.

You should consider cleaning the data in the following cases:

  • When respondents answer only part of your survey (e.g., blank answers toward the second half of your survey)
  • When respondents give nonsensical or unrealistic answers in your open-ended questions (e.g., respondents enter "40 hours" to a question about how much time they work in a day)
  • When respondents do not meet the criteria of your target group
  • When respondents have given mismatched answers (e.g., respondents provide an answer to one question but place it in a free response space for another question)

Whatever the data organization strategy you choose, keep in mind that the overall goal is to make it easy to perform data analysis later on.

How can I do a statistical analysis of survey data?

The survey data analysis you need to conduct depends on the makeup of your survey.

Statistical or quantitative analysis can address responses to closed questions, while responses to open-ended questions require qualitative analysis.

Integrating descriptive statistics and interpretive data

In ATLAS.ti, you can organize your survey data by respondents (i.e., create a document for each respondent's set of survey responses) and code data according to descriptive variables (e.g., income level) and their possible values (e.g., low-income, middle-income, high-income). Descriptive variables can be used to describe the demographic makeup of your survey respondents.

Interpretive statistics are often generated from survey results to determine the opinions and perspectives of survey respondents. Likert scales can provide numerical data about the relative value of data points such as product popularity or customer preferences, while open-ended responses must be analyzed qualitatively to allow researchers to determine the trends and patterns among respondents' perspectives.

The frequency of these codes can be used to calculate statistical significance and identify frequently occurring patterns and trends in survey results.

To determine correlations, you can create tables through the Code-Document Table tool to see which codes occur in the same document. You can export the resulting table as an Excel spreadsheet for further statistical analysis.

How do I analyze qualitative data from a survey?

Survey research often includes unstructured data from open-ended responses whose data may not be easily quantifiable or ordered to allow for a statistical software platform to conduct analysis.

In this case, researchers turn to a survey analysis tool to determine patterns that arise in free responses.

Frequencies in survey results

Qualitative research software such as ATLAS.ti has data analysis tools that can help you create visualizations such as word clouds, frequency tables of words, and concept clouds. Words and phrases that often appear in open-ended responses can help you uncover other data and insights for future research.

Artificial intelligence and machine learning tools

Other powerful tools employing machine learning such as Sentiment Analysis and Opinion Mining can allow you to identify positive or negative feedback written in open-ended responses. These insights can allow for advanced analysis of your structured data, particularly when you can isolate survey data by the emotions and sentiments that are apparent in the responses.

Identifying patterns

In traditional qualitative analysis, you can analyze survey data by coding open-ended responses of interest and creating tables through the Code Co-Occurrence tool to determine common themes expressed by survey respondents.

The objective of codes is to briefly summarize the qualitative data, particularly when the researcher has a large set of data to analyze. As a result, codes should be short but descriptive so that the resulting analysis is clear enough to understand and generate actionable insights.