MAXQDA vs. ATLAS.ti | Best Qualitative Data Analysis Software
Undecided about which computer-assisted qualitative data analysis software (CAQDAS) to use for your qualitative data? Let's compare the differences between ATLAS.ti and MAXQDA so you can make an informed decision about your ideal qualitative data analysis (QDA) platform.

|
MAXQDA
|
ATLAS.ti
|
|
|---|---|---|
| AI-powered Data Analysis | ||
| AI Suggested Codes | ||
| AI Summaries | ||
| AI-powered coding | Pricing based on usage | Unlimited use with paid license |
| Conversational AI | Chat with only one document at a time | Chat with multiple documents simultaneously |
| Intentional AI Coding | ||
| Paper Search capabilities | ||
| Free access to 200M+ papers through Paper Search 2.0 | ||
| Streamlined literature search | ||
| Advanced filters for relevant papers | ||
| Tailored AI summaries of top papers | ||
| Full integration with research projects | ||
| Auto-Coding Tools | ||
| Coding speakers in transcripts | ||
| Sentiment Analysis | ||
| Concepts Tool | ||
| Opinion Mining | ||
| Named Entity Recognition | ||
| Visualizations | ||
| Networks | ||
| Code clouds | ||
| Treemaps | ||
| Force-directed graphs | ||
| Sankey diagrams | ||
| Compatible Social Media Data | ||
| Twitter/X | ||
| YouTube | ||
| TikTok | ||
| Compatible Text Files | ||
| Microsoft Word | ||
| Plain text | ||
| Rich text files | ||
| PDF files | ||
| Open Office | ||
| HTML files | ||
| Open Office XML | ||
| Other Compatible Files | ||
| Images | ||
| Video files | ||
| Audio files | ||
| Geographical data | External link to a single geographic location | Interactive maps for coding multiple locations |
| MOBI eBook files | ||
| Support | ||
| Technical support | ||
| Methodological guidance | ||
| Project optimization | ||
| 24/5 support | ||
| Miscellaneous | ||
| Unlimited access to all software features and platforms with a single license | ||
| Real-time, online collaboration | ||
| Memos | Different types of memos without integration | Full flexibility to link memos to all project entities |
| Project sharing | Limited to 5 users | Unlimited users |
| Networks | Limited layout options | Automatic layout options and customizable links |
| Rich data retrieval capabilities | Limited capabilities in Code Explorer and Complex Coding Query | Simple interface for intricate data retrieval in Query Tool |
| Code-code and code-document analyses | Complex interface | Simple interface with easy learning curve in Code Co-Occurrence Analysis and Code-Document Analysis |
| Text analysis | Word cloud with options for base forms and stop lists | Word cloud with options for base forms, parts of speech, and stop and go lists |
| AI-powered Data Analysis |
|
AI Suggested Codes
|
|
AI Summaries
|
|
AI-powered coding
Pricing based on usage |
|
Conversational AI
Chat with only one document at a time |
|
Intentional AI Coding
|
| Paper Search capabilities |
|
Free access to 200M+ papers through Paper Search 2.0
|
|
Streamlined literature search
|
|
Advanced filters for relevant papers
|
|
Tailored AI summaries of top papers
|
|
Full integration with research projects
|
| Auto-Coding Tools |
|
Coding speakers in transcripts
|
|
Sentiment Analysis
|
|
Concepts Tool
|
|
Opinion Mining
|
|
Named Entity Recognition
|
| Visualizations |
|
Networks
|
|
Code clouds
|
|
Treemaps
|
|
Force-directed graphs
|
|
Sankey diagrams
|
| Compatible Social Media Data |
|
Twitter/X
|
|
YouTube
|
|
Facebook
|
|
Instagram
|
|
TikTok
|
| Compatible Text Files |
|
Microsoft Word
|
|
Plain text
|
|
Rich text files
|
|
PDF files
|
|
Open Office
|
|
HTML files
|
|
Open Office XML
|
| Other Compatible Files |
|
Images
|
|
Video files
|
|
Audio files
|
|
Geographical data
External link to a single geographic location |
|
MOBI eBook files
|
| Support |
|
Technical support
|
|
Methodological guidance
|
|
Project optimization
|
|
24/5 support
|
| Miscellaneous |
|
Unlimited access to all software features and platforms with a single license
|
|
Real-time, online collaboration
|
|
Memos
Different types of memos without integration |
|
Project sharing
Limited to 5 users |
|
Networks
Limited layout options |
|
Rich data retrieval capabilities
Limited capabilities in Code Explorer and Complex Coding Query |
|
Code-code and code-document analyses
Complex interface |
|
Text analysis
Word cloud with options for base forms and stop lists |
| AI-powered Data Analysis |
|
AI Suggested Codes
|
|
AI Summaries
|
|
AI-powered coding
Unlimited use with paid license |
|
Conversational AI
Chat with multiple documents simultaneously |
|
Intentional AI Coding
|
| Paper Search capabilities |
|
Free access to 200M+ papers through Paper Search 2.0
|
|
Streamlined literature search
|
|
Advanced filters for relevant papers
|
|
Tailored AI summaries of top papers
|
|
Full integration with research projects
|
| Auto-Coding Tools |
|
Coding speakers in transcripts
|
|
Sentiment Analysis
|
|
Concepts Tool
|
|
Opinion Mining
|
|
Named Entity Recognition
|
| Visualizations |
|
Networks
|
|
Code clouds
|
|
Treemaps
|
|
Force-directed graphs
|
|
Sankey diagrams
|
| Compatible Social Media Data |
|
Twitter/X
|
|
YouTube
|
|
Facebook
|
|
Instagram
|
|
TikTok
|
| Compatible Text Files |
|
Microsoft Word
|
|
Plain text
|
|
Rich text files
|
|
PDF files
|
|
Open Office
|
|
HTML files
|
|
Open Office XML
|
| Other Compatible Files |
|
Images
|
|
Video files
|
|
Audio files
|
|
Geographical data
Interactive maps for coding multiple locations |
|
MOBI eBook files
|
| Support |
|
Technical support
|
|
Methodological guidance
|
|
Project optimization
|
|
24/5 support
|
| Miscellaneous |
|
Unlimited access to all software features and platforms with a single license
|
|
Real-time, online collaboration
|
|
Memos
Full flexibility to link memos to all project entities |
|
Project sharing
Unlimited users |
|
Networks
Automatic layout options and customizable links |
|
Rich data retrieval capabilities
Simple interface for intricate data retrieval in Query Tool |
|
Code-code and code-document analyses
Simple interface with easy learning curve in Code Co-Occurrence Analysis and Code-Document Analysis |
|
Text analysis
Word cloud with options for base forms, parts of speech, and stop and go lists |
Choosing the right QDA platform
Qualitative researchers have a number of options to choose from when deciding what data analysis platform is best for them. Let's look at some of the important considerations that factor into the decision-making process, and why ATLAS.ti has advantages in all of these aspects.
MAXQDA vs. ATLAS.ti: What's the difference?
Let's look a little more deeply into the key features of both QDA platforms where ATLAS.ti has clear distinctions over MAXQDA.
- Coding
- Conducting Literature Reviews
- Auto-coding with Text Search
- AI-powered Data Analysis
- Data Analysis
- Visualizations
- Research Notes in Memos
- Interface and Ease-of-Use
- Organizing Data
- Collaboration with Team Members
- Cloud Storage for Project Sharing
- Compatible Data Types
- Comprehensive Support System
- Overall Benefits
Coding
When it comes to choosing a CAQDAS, you may be flooded with a whole host of choices for computer-based solutions to analyze qualitative data. Because qualitative data often eludes easy analysis (e.g., what are the emergent themes in this data set relevant to my research question?), you may understandably look for a CAQDAS package to help you code your data and provide a structure useful for data analysis.
To a certain extent, all major QDA platforms provide the capability to code data. Both ATLAS.ti and MAXQDA will provide you with the basic ability to code and structure your data to rigorously generate key insights.
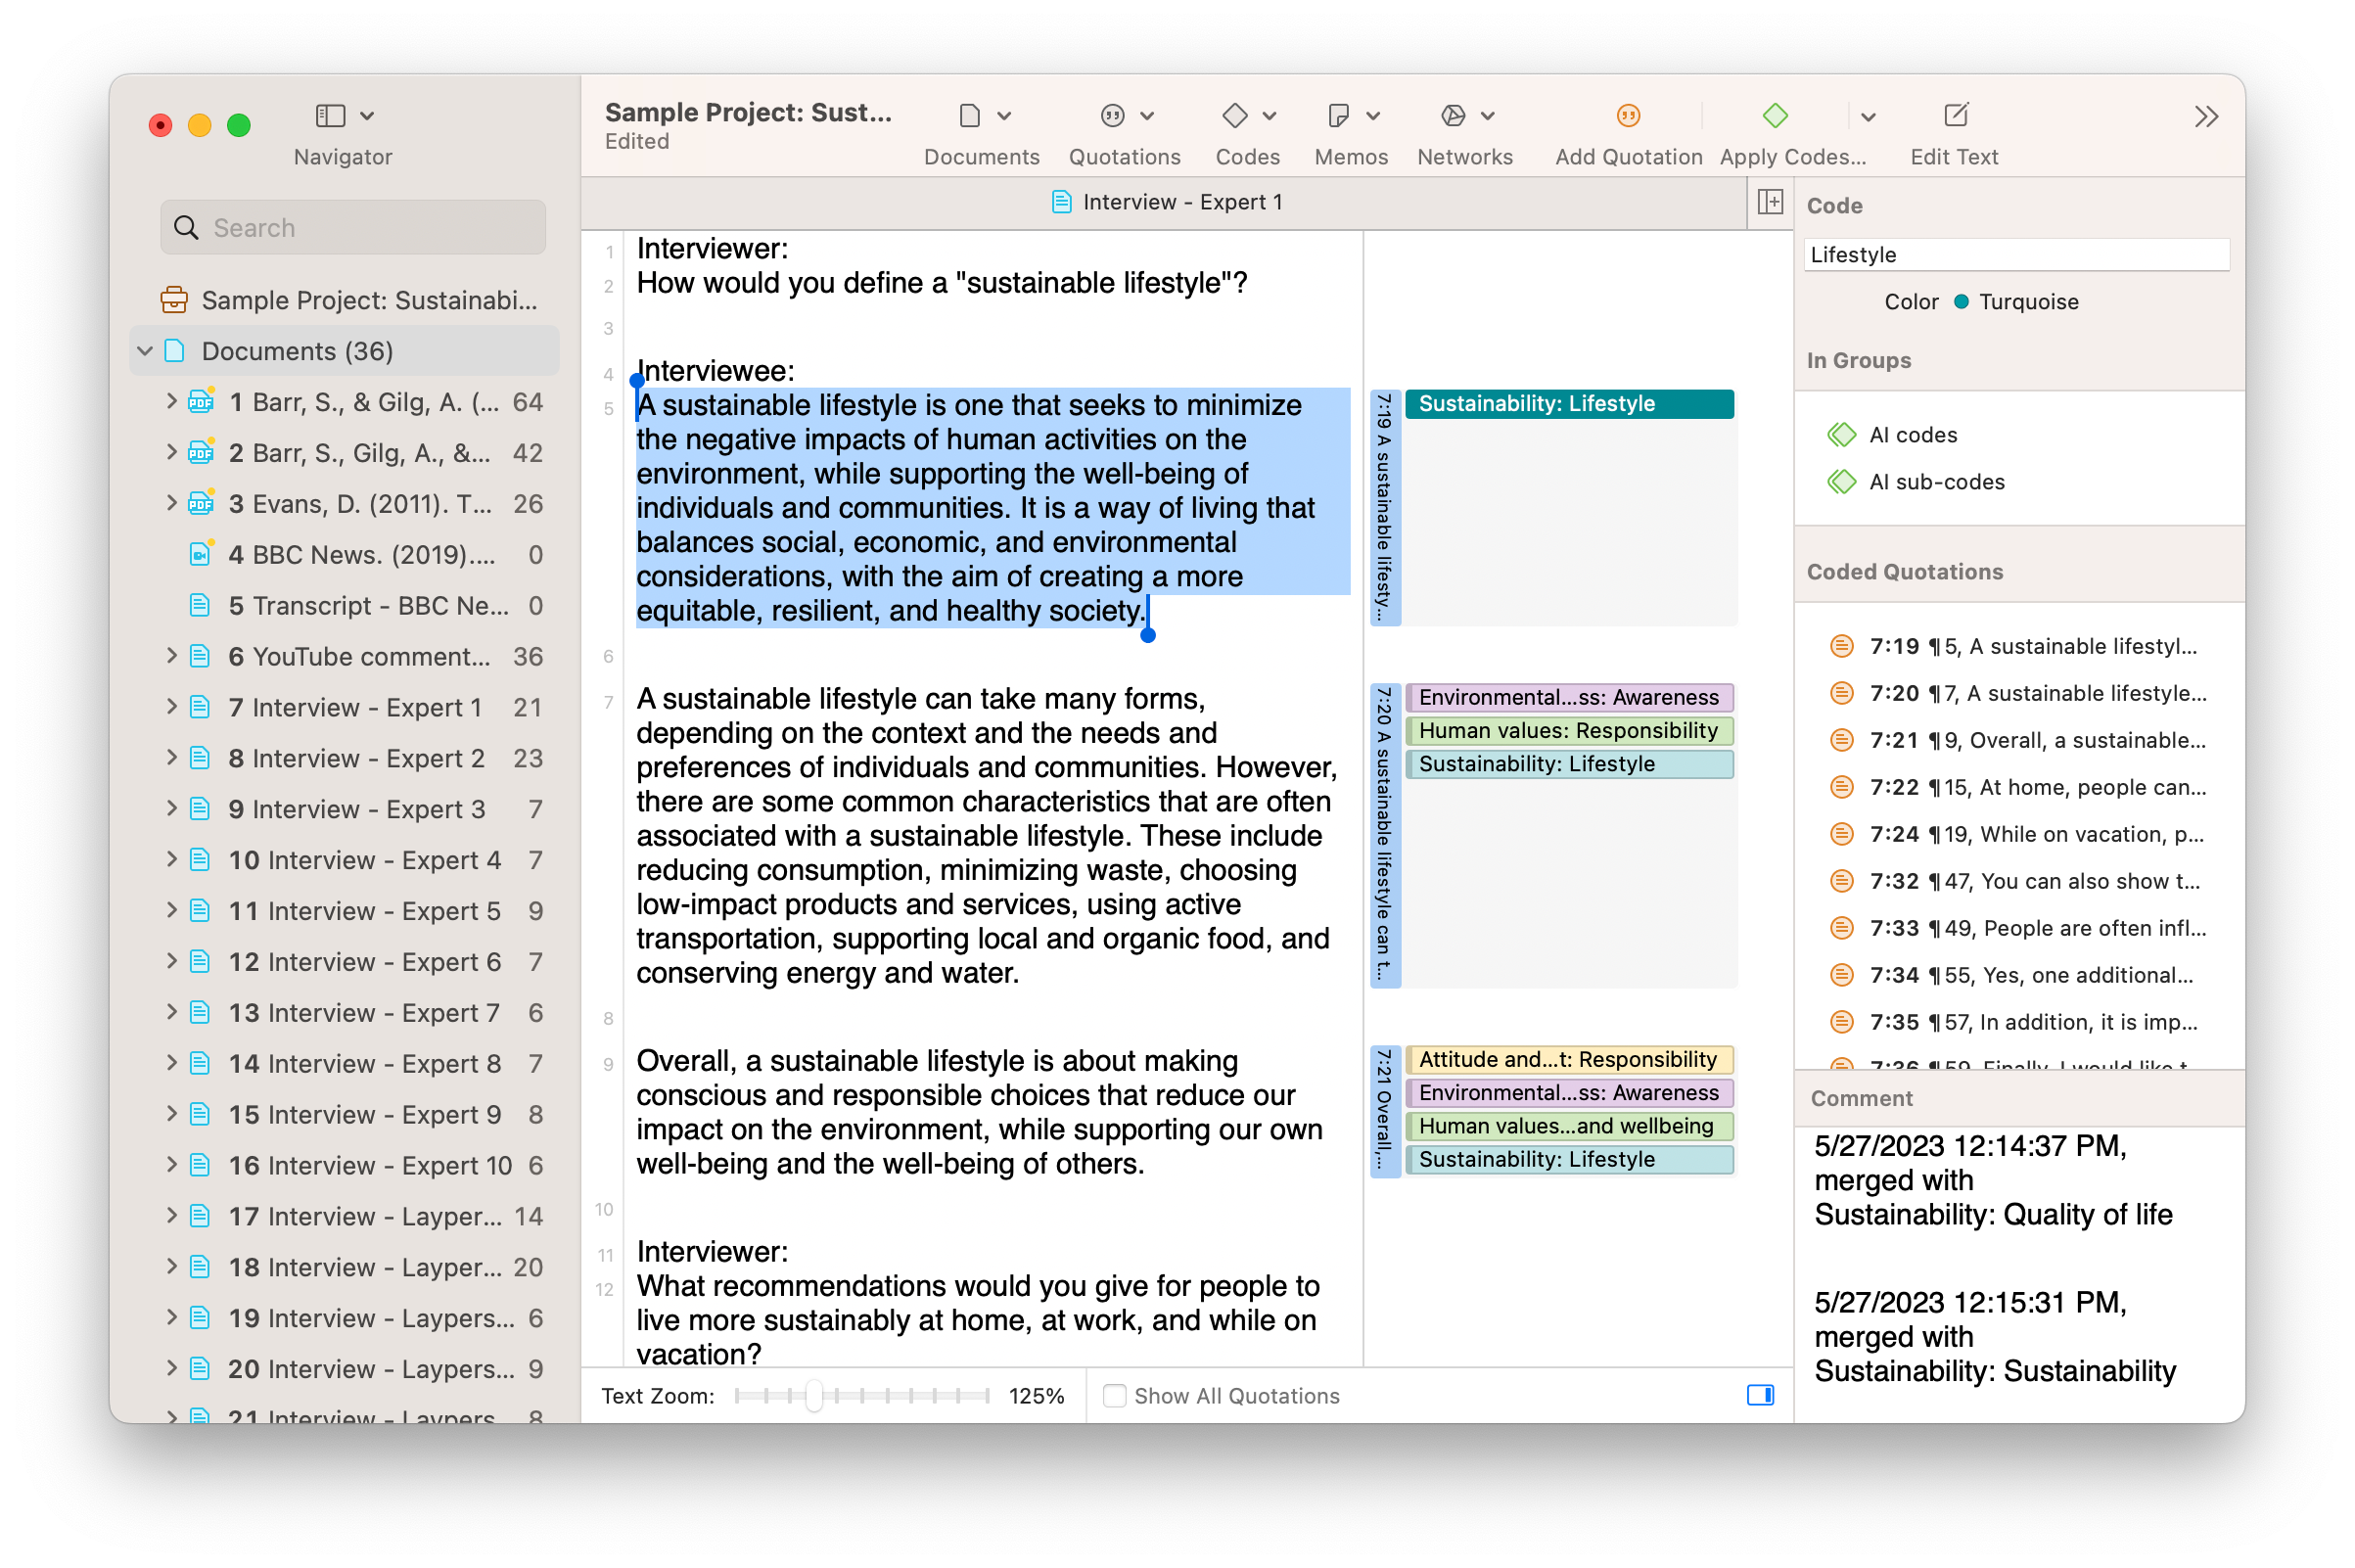
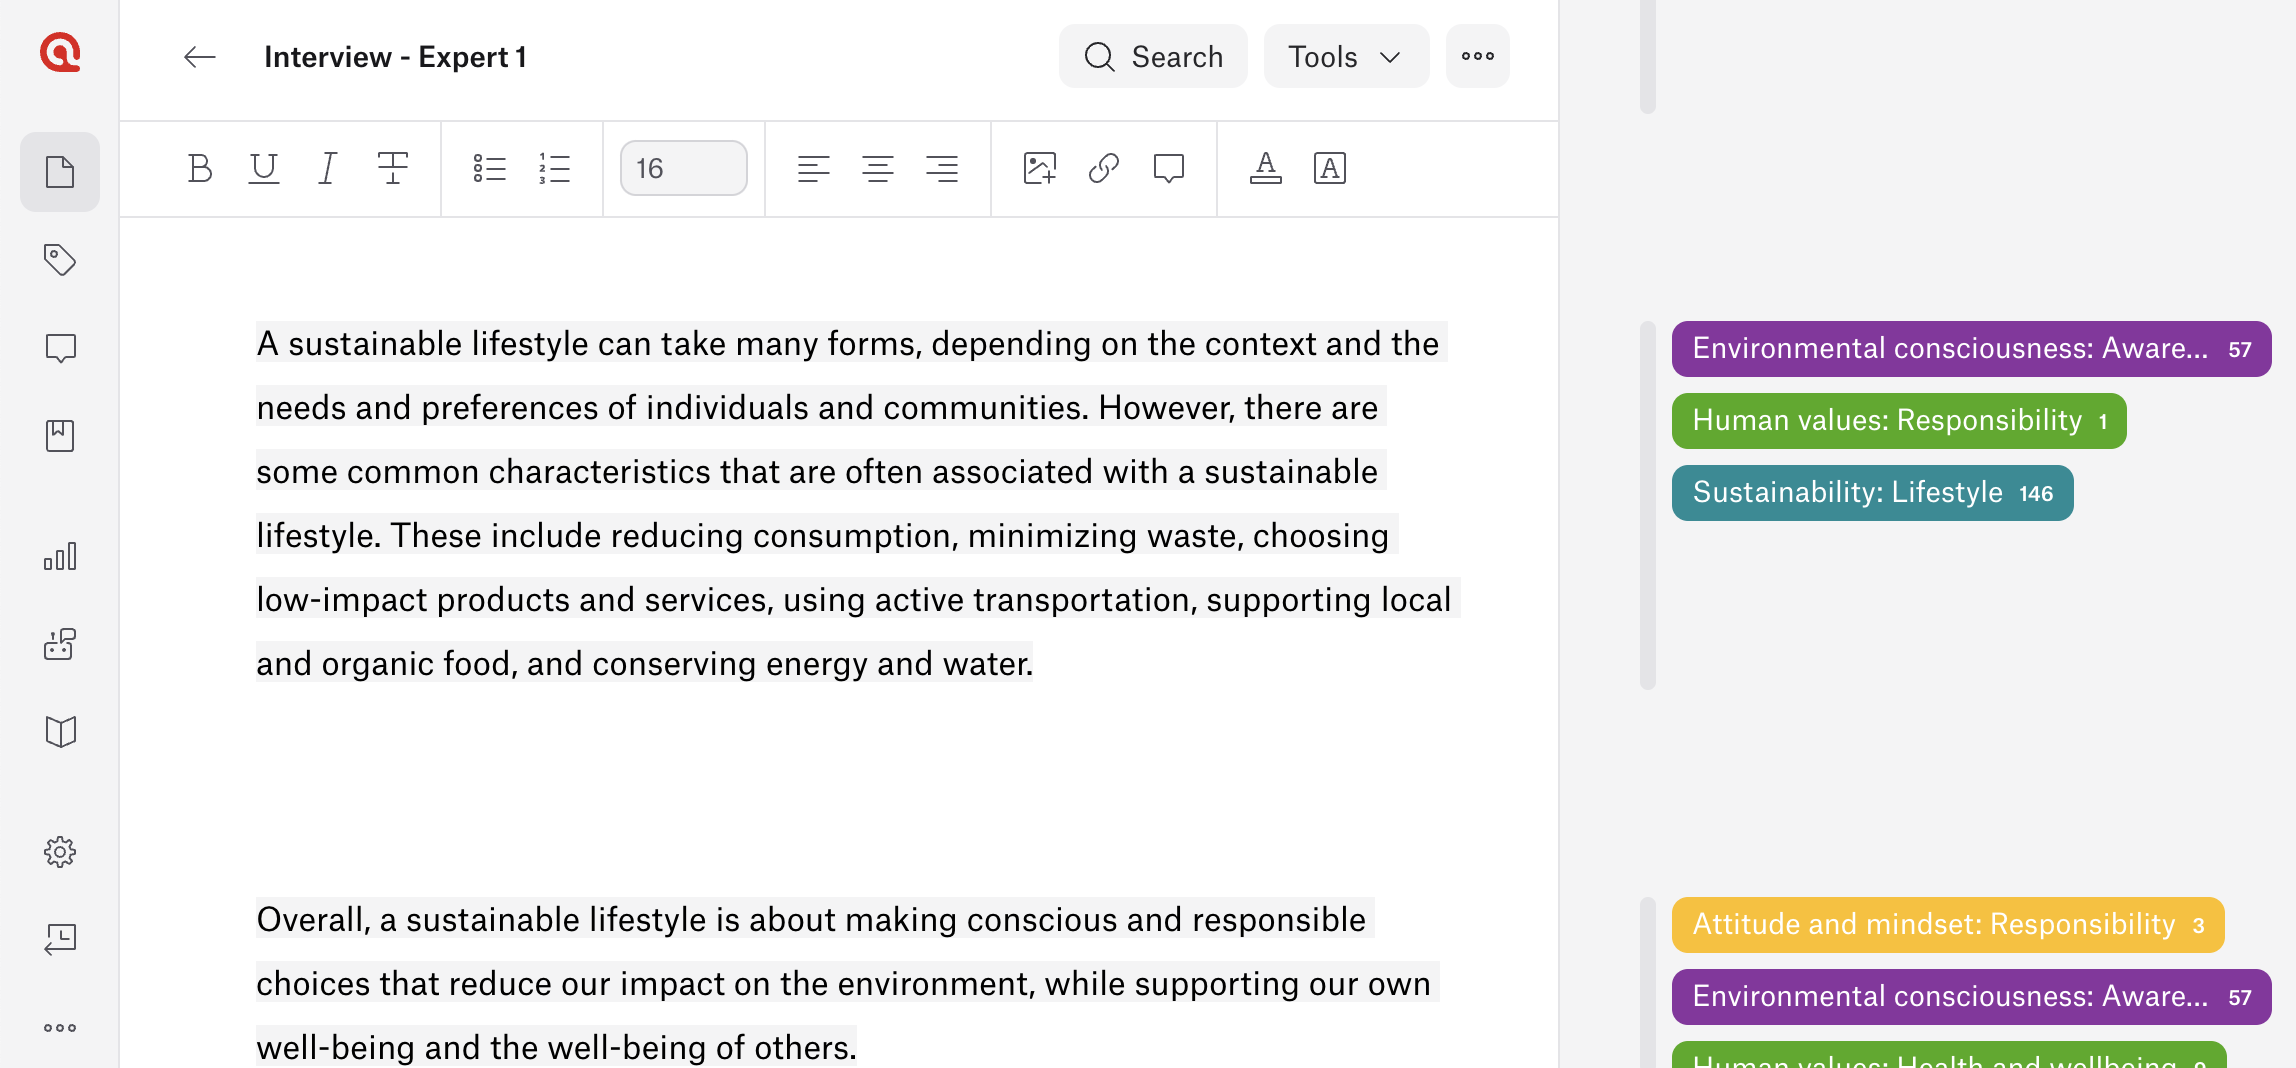
In ATLAS.ti, manual coding is simply a matter of highlighting text and choosing from existing codes or creating new ones to apply to the data. A pop-up window that displays your code list near your text makes the coding process quick and easy. Quick Coding allows users to apply the most recently used code to any data segment with just a few clicks, while the Code In Vivo option creates codes directly from the text.
Conducting Literature Reviews
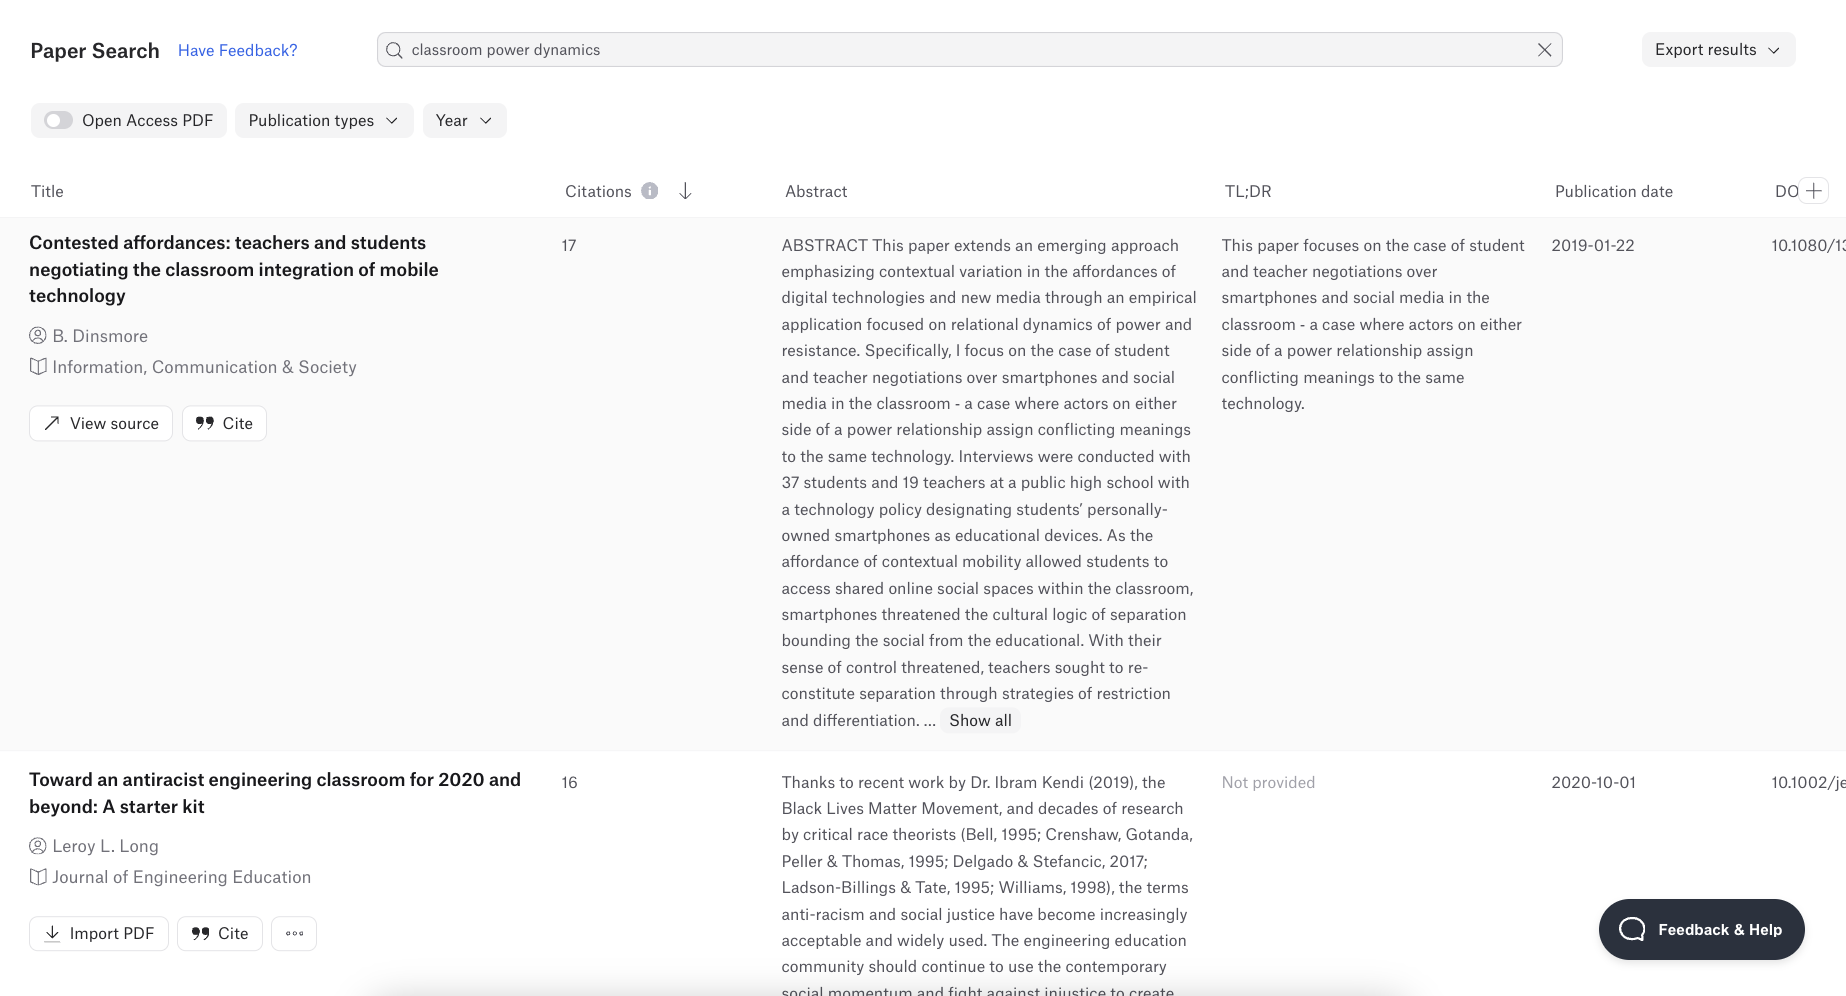
All of the major QDA platforms can read and import reference manager data from programs such as Zotero and EndNote, which is useful for moving your research library into your project so that your literature review can seamlessly inform your data analysis. However, only ATLAS.ti Web's Paper Search gives researchers the ability to directly build a useful library of journal articles and research papers in their project. With Paper Search, users can search from over 200 million articles available through Semantic Scholar and choose the papers that are most relevant to their research. Unlike with MAXQDA, users can utilize ATLAS.ti to look for the most insightful research and import it into their project to complement and jump start their literature review.
ATLAS.ti Web's Paper Search 2.0 lets users tailor their search for literature to a particular research question, get the relevant literature complete with tailored AI summaries of the most important papers in their inquiry, and integrate the results in their research projects. Paper Search provides the capability to conduct literature reviews and shape their research in ways not seen in other major QDA platforms.
Auto-coding Tools
Various features in ATLAS.ti facilitate the automation of the coding process with greater flexibility than what MAXQDA provides. The Concepts tool looks for commonly occurring phrases that a simple word cloud can't provide, while Opinion Mining conducts a sentiment analysis on those phrases, allowing researchers to separate positive and negative sentiments while coding.
Tools such as Focus Group Coding and Named Entity Recognition can help users save time by automatically adding codes to indicate who in an interview or a focus group is speaking or to identify people, places, and organizations named in the data, respectively. Using these codes in conjunction with codes from Sentiment Analysis and Opinion Mining can help generate rich insights on how the data frames the discussion of various topics of interest in a positive, negative, or neutral light.
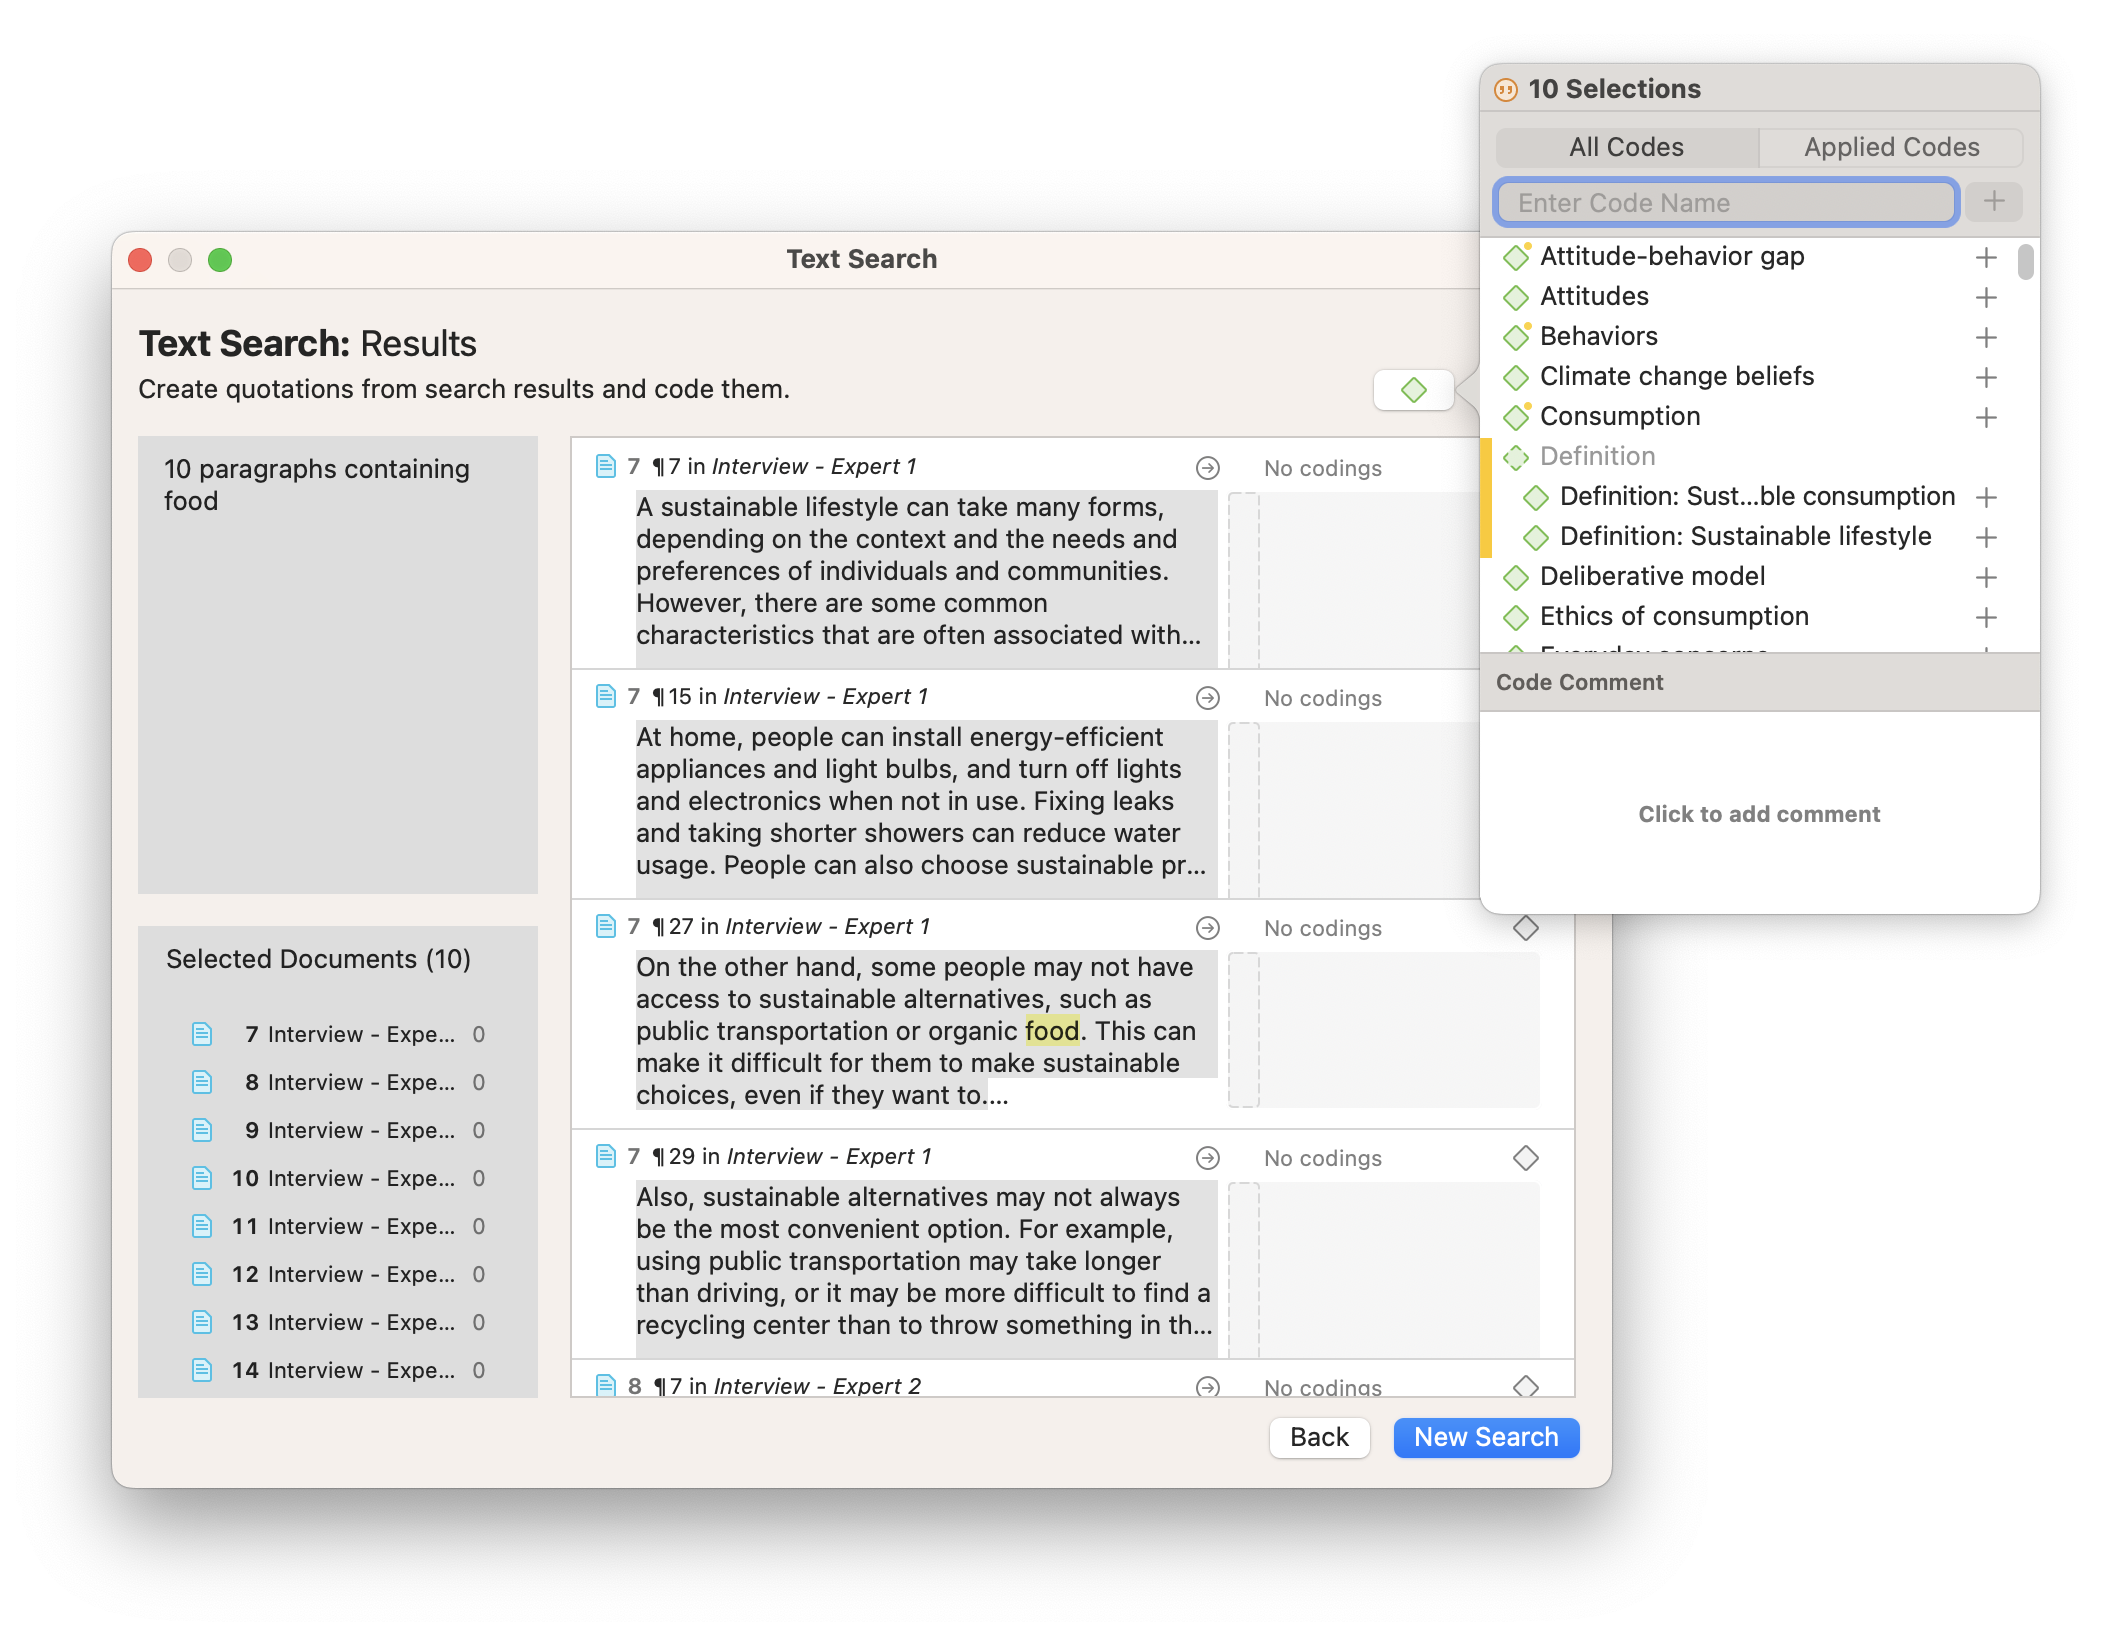
Text Search is more powerful in ATLAS.ti, allowing for searches of synonyms and more complex queries to get the most relevant data. The flexibility of the Text Search tool allows users to construct a single search with multiple keywords to narrow the scope of the data to a specific set of text segments that can be coded, regardless of where the data is in your project.
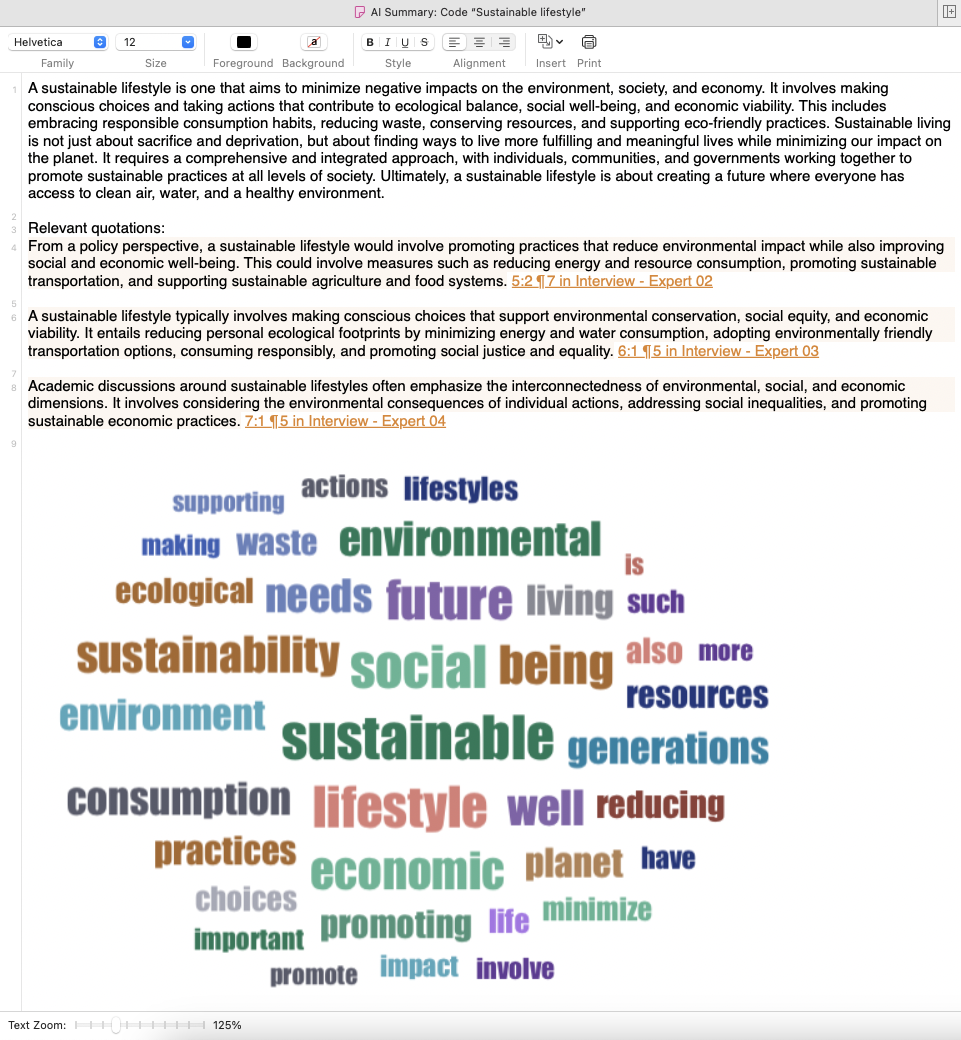
The Word Frequencies tool has greater flexibility than MAXQDA's Word Cloud in filtering parts of speech and providing options for stop and go lists to tailor your content analysis. As a result, users have more options for developing visualizations of their qualitative data and content analysis in ATLAS.ti.
AI-powered Data Analysis
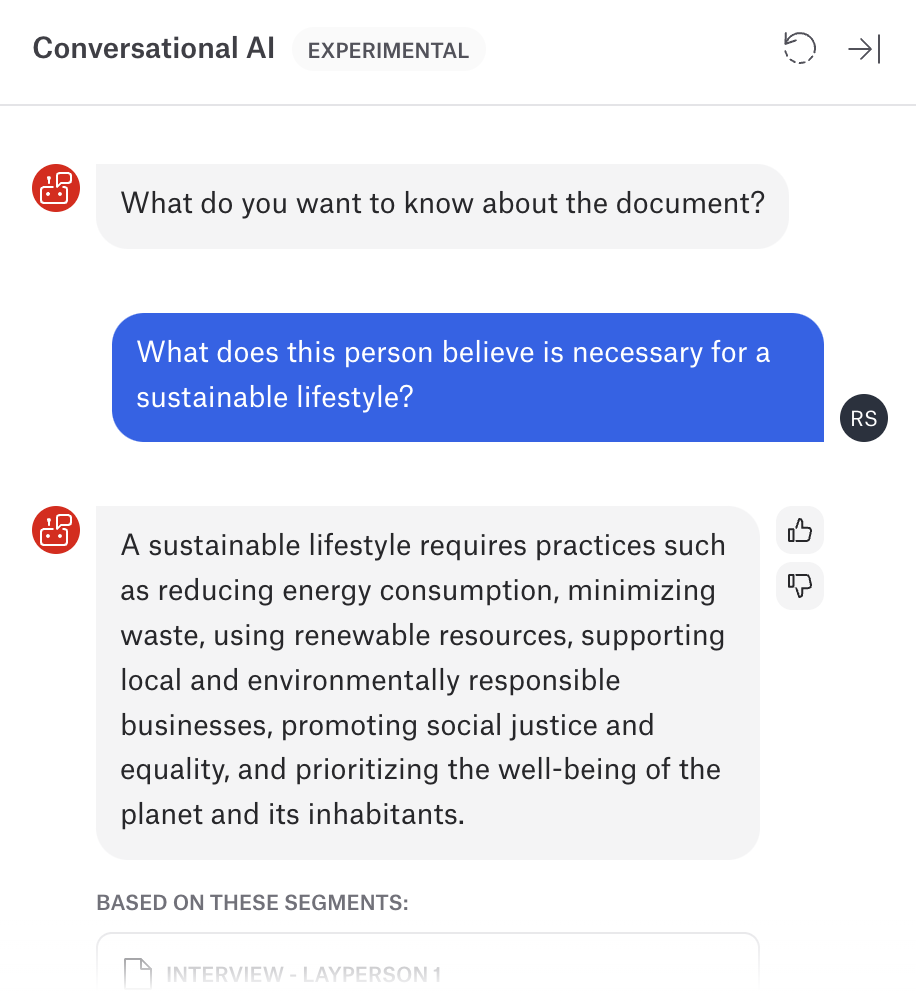
Artificial intelligence is also a major part of coding and analyzing data in ATLAS.ti and MAXQDA. MAXQDA has an AI Assist feature to summarize and explain data, but its automated coding capabilities are different from and more limited than ATLAS.ti's AI-powered tools. For example, ATLAS.ti's Conversational AI allows users to employ a chatbot that can give insights on multiple documents in one project, while MAXQDA's equivalent can only chat with one document at a time. The broader capabilities in ATLAS.ti are ideal for synthesizing information from multiple interview respondents, survey records, or other groups of text documents, allowing users to explore overarching patterns and trends in their research inquiry.
In terms of coding, ATLAS.ti gives you the flexibility to choose the extent to which AI codes your data, whether you want your entire data set coded to suit your research inquiry or you just need a little inspiration during the coding process. Users of ATLAS.ti can code a discrete data segment with AI Suggested Codes or entire documents with AI Coding or Intentional AI Coding, both of which also create a coding structure complete with category codes and sub-codes to keep your codes organized and manageable. In contrast, MAXQDA's AI capabilities can only code one segment of data at a time, rather than entire documents, and can only suggest sub-codes of already existing codes.
AI-powered tools in both platforms can code for the general meaning of your textual data, but only ATLAS.ti's Intentional AI Coding allows users to direct the AI to code data based on specific research questions. Other AI tools will simply provide answers but largely devoid of any other context to help researchers understand where the results came from; ATLAS.ti's Intentional AI Coding provides a rich coding structure that facilitates transparent analysis, and researchers can always simply double-click on any quotation to see it in its original context, allowing researchers to begin to "open the black box" of artificial intelligence and see the whole picture provided by their data.
ATLAS.ti's Intentional AI Coding creates coding structures that are tailored to your research inquiry with category codes and sub-codes that are more relevant to your data analysis. Importantly, researchers can tell the AI how it should code their data, including specifying guiding questions and relevant codes. No other CAQDAS offers researchers this level of control over how AI-driven tools should automatically code the data.

Of course, we recommend that researchers always review the results provided to them by artificial intelligence, but the time savings between manual coding and coding with AI-powered tools will undoubtedly prove consequential to the research process.
Most importantly, ATLAS.ti users have unlimited access to our AI tools, no matter the size of their dataset. MAXQDA users can use AI tools on a limited set of data per day before paying for additional usage. This can be problematic when you need to sift through large sets of data.
On the other hand, a full license to ATLAS.ti has no restrictions on the use of any AI tools, including AI Suggested Codes, AI Coding, and Intentional AI Coding. This means that, unlike with MAXQDA, projects of all sizes can take advantage of the artificial intelligence capabilities in ATLAS.ti without incurring extra costs.
Data Analysis
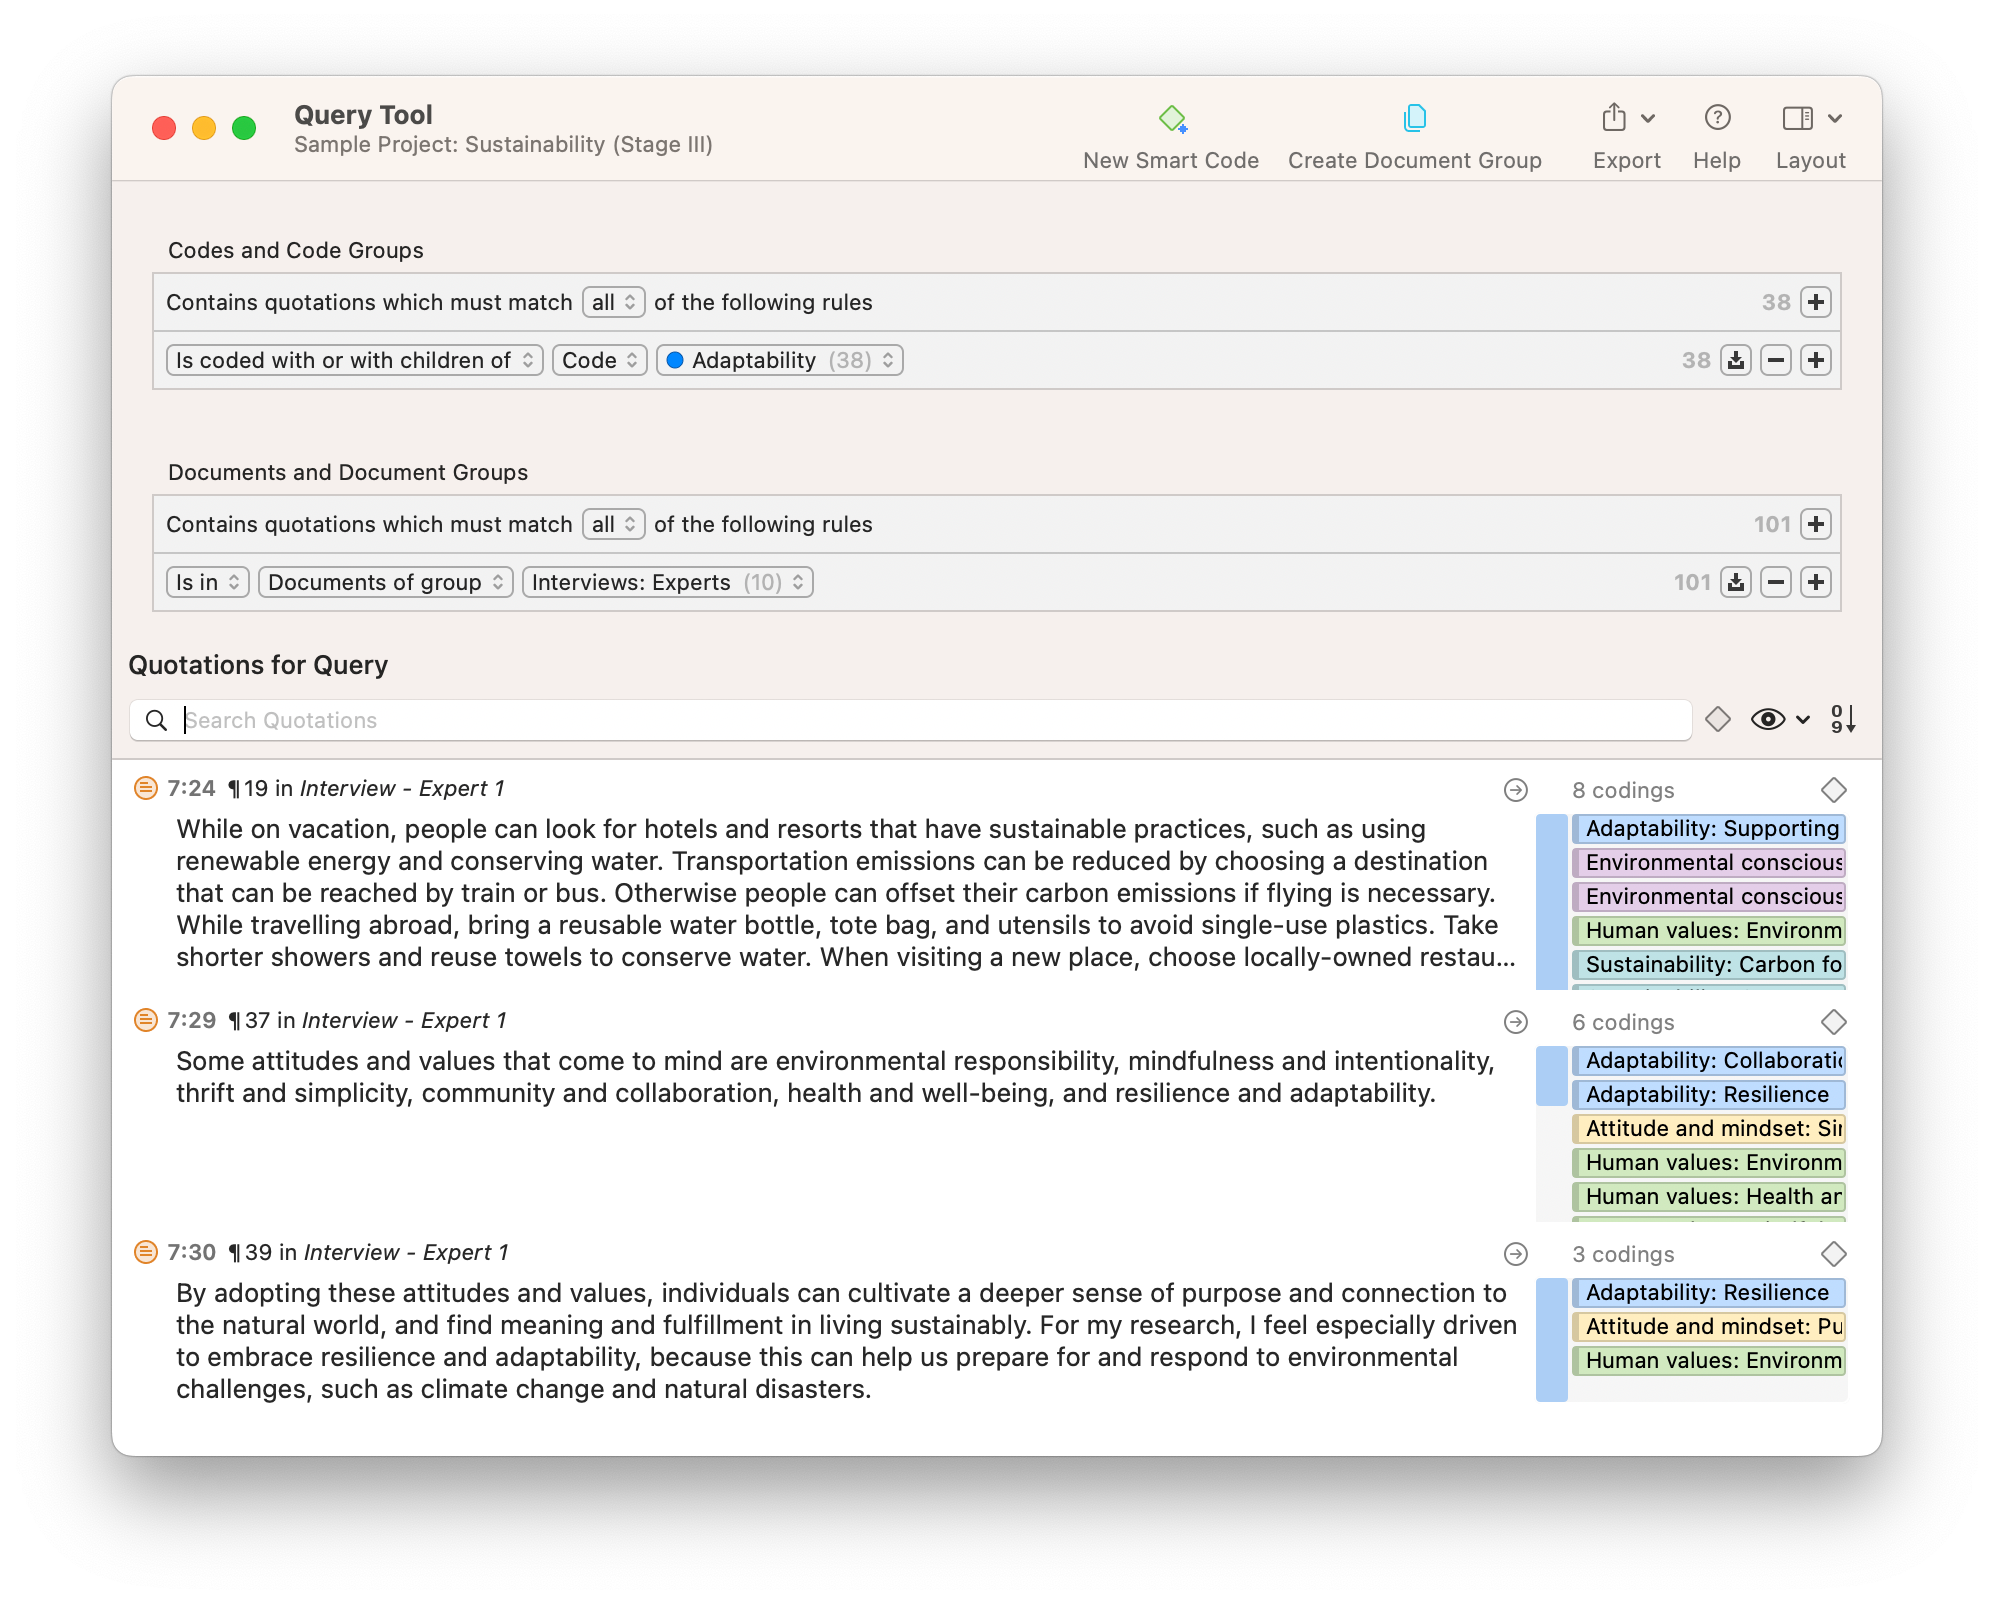
The Query Tool can easily find patterns in the data, no matter in what document the insights are located. In one interface, users in ATLAS.ti can construct detailed queries of their coded data in a manner that may require the use of multiple tools in MAXQDA. Instead of conducting multiple and sequential analyses in MAXQDA's Code Explorer or Complex Coding Query, ATLAS.ti's Query Tool can accommodate multiple criteria for codes with any combination of Boolean and proximity operators that suit your research inquiry.
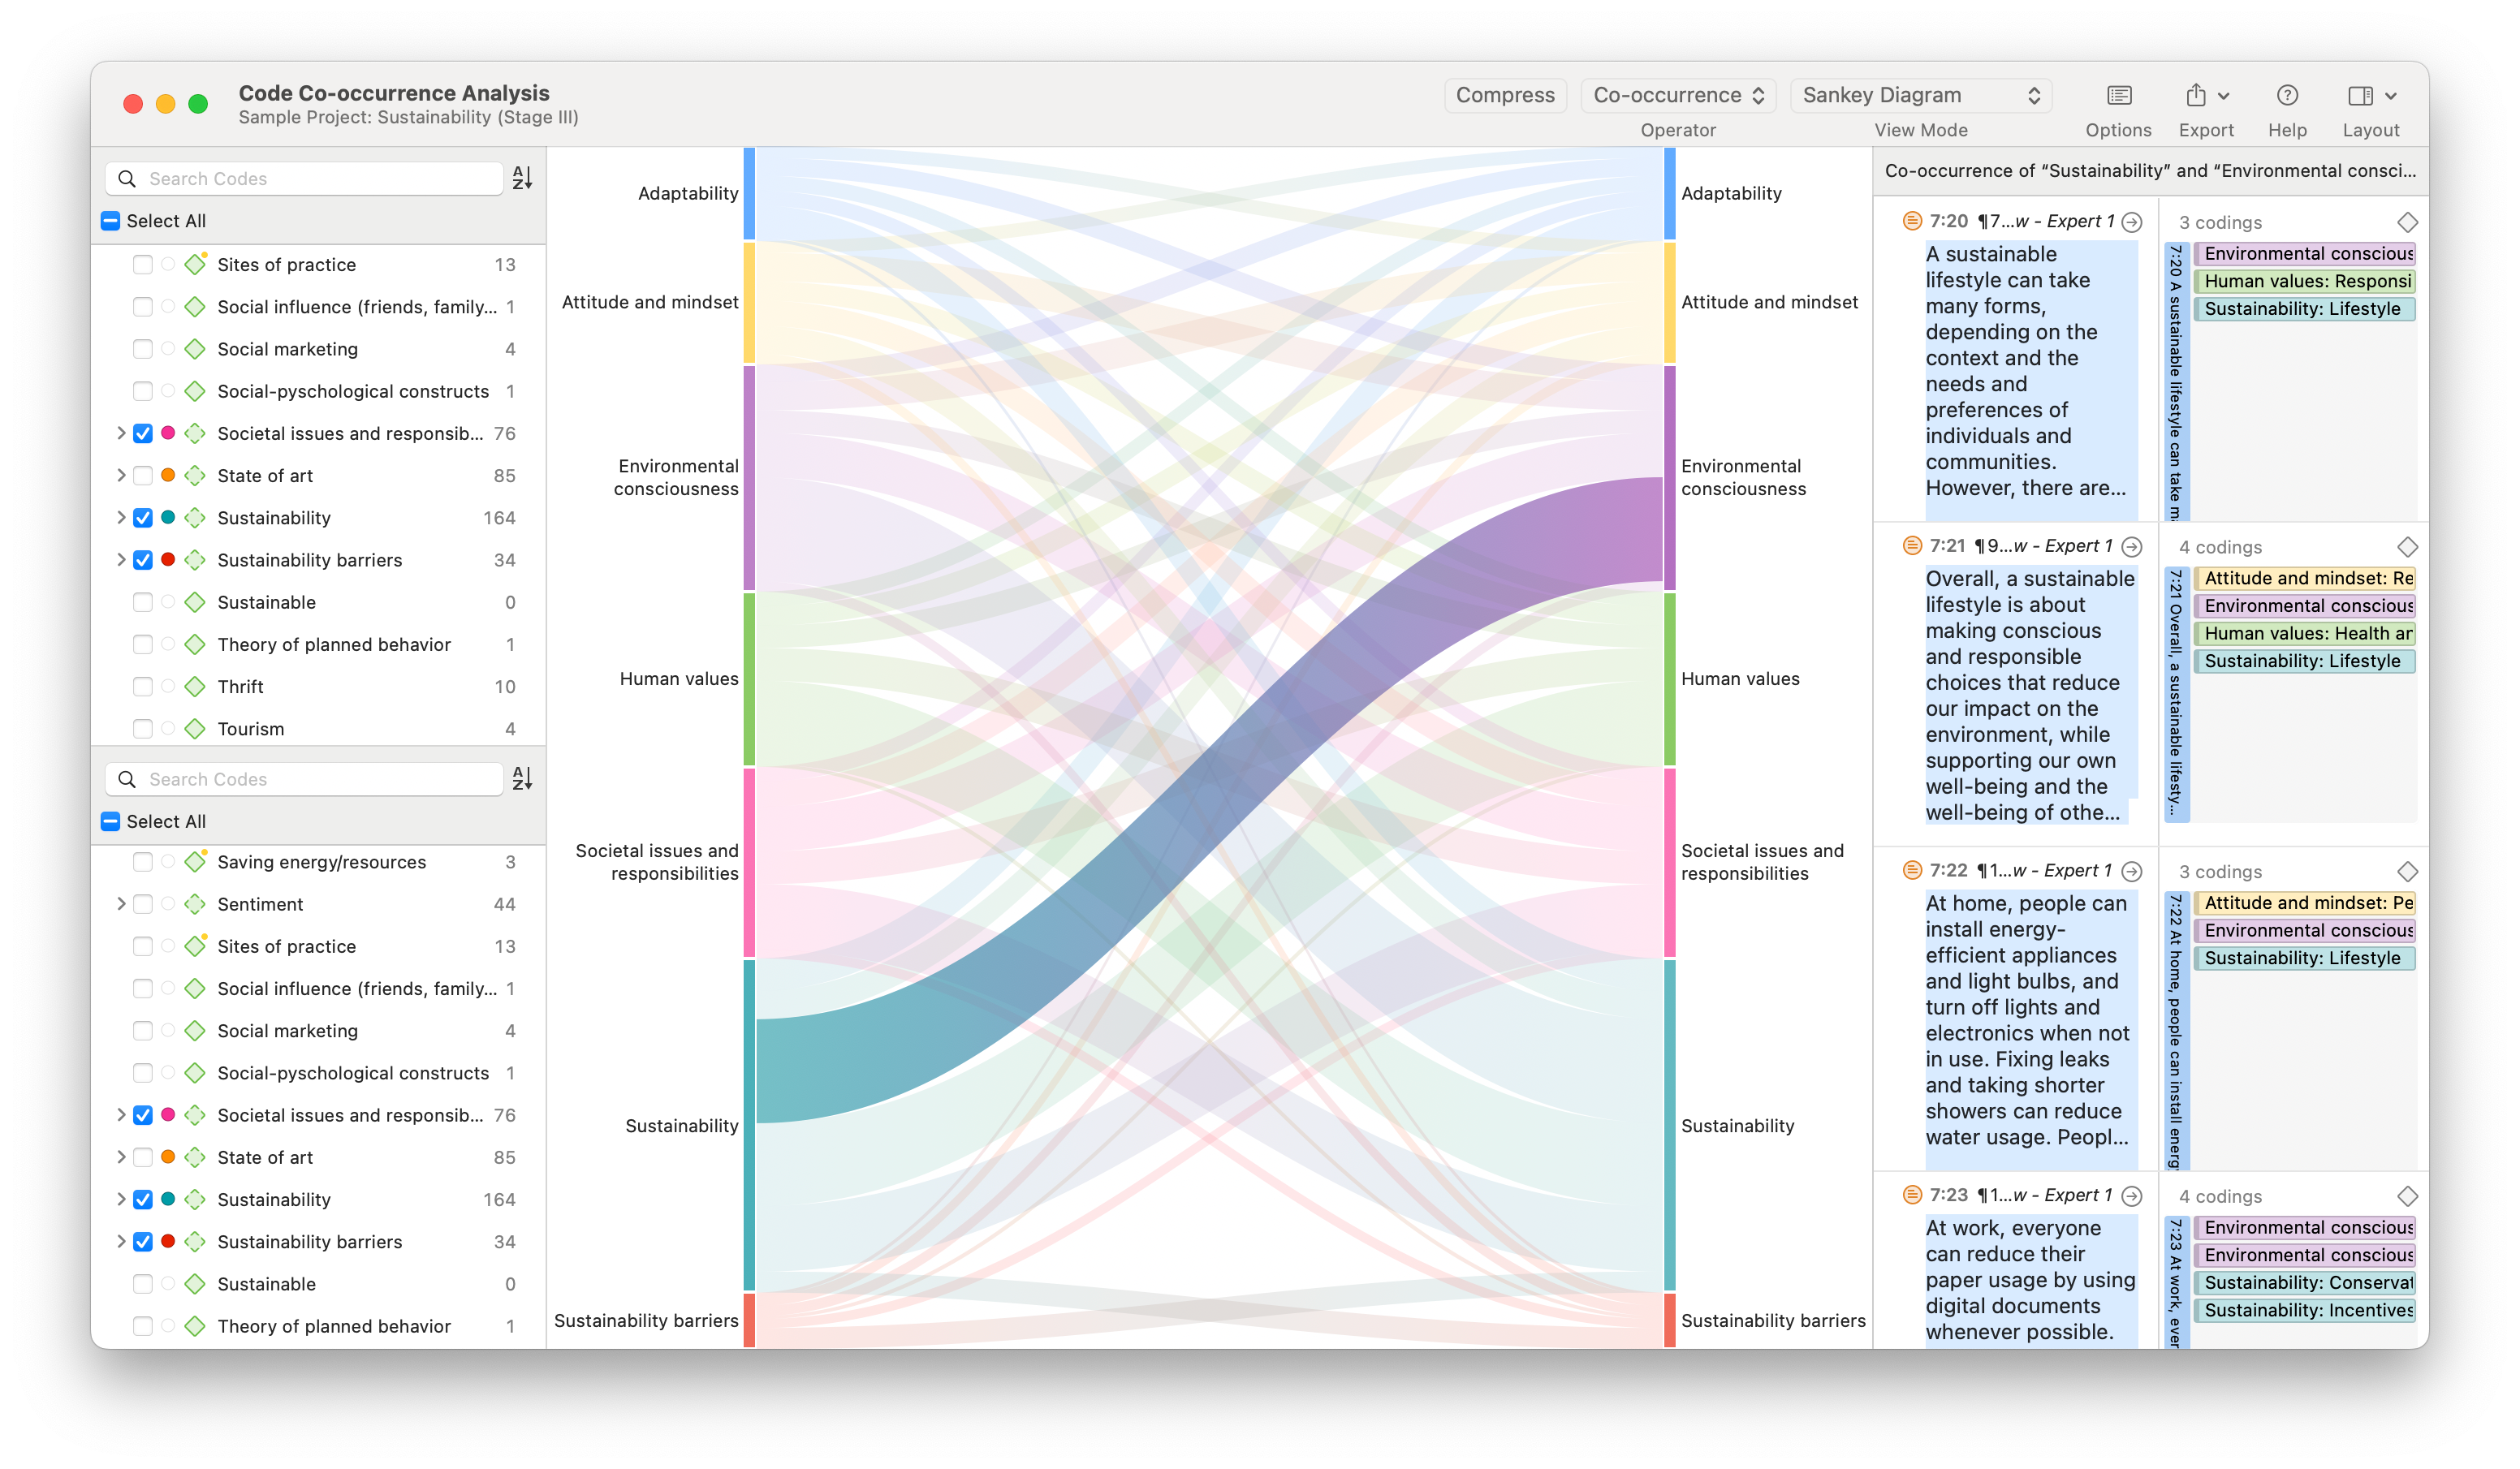
Analyzing data is also easy with other tools such as Code Co-Occurrence Analysis and Code-Document Analysis, creating useful visualizations of code-code and code-document relationships more quickly in ATLAS.ti than in the equivalent MAXQDA features. Both of these tools in ATLAS.ti have a simple interface that allows users to quickly create tables to analyze potential relationships between codes, and between codes and documents, respectively. While users in MAXQDA have to navigate complicated dialog boxes for the analysis tools, many key analyses in ATLAS.ti are created by simply selecting codes and/or documents to cross examine in a table. Moreover, viewing the data supporting the analysis is easier in ATLAS.ti with an elegant interface where tables, figures, and relevant quotations are shown in the same window rather than splitting each part of the analysis in separate tools with their own set-up processes and multiple windows that can clutter your screen and analysis.
Visualizations
Once created, tables from Code Co-Occurrence Analaysis and Code-Document Analysis can be used to provide visualizations in the form of force-directed graphs and Sankey diagrams, visualizations that are only available in ATLAS.ti.
The Network View in ATLAS.ti provides tools for researchers to create illustrative conceptual maps and in-depth visualizations of their data. Links between different codes, quotations, memos, groups, and documents can be displayed in a visualization of theory that reflects a rich qualitative analysis of the project's data. Unlike in MAXQDA where the Network View's equivalent provides only a simple set of visualization capabilities, users can define links in an ATLAS.ti network by the nature of the relationship between codes to develop their theory and propose insights.
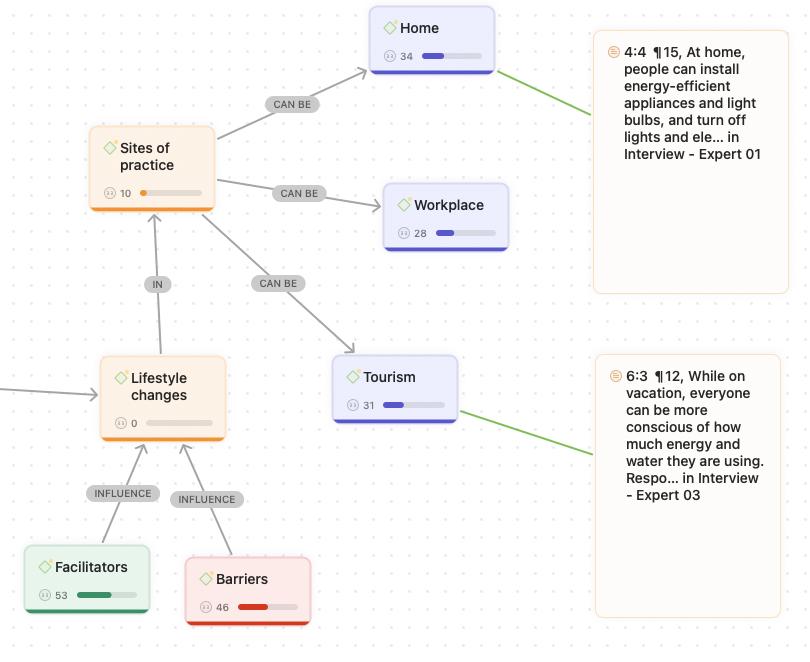
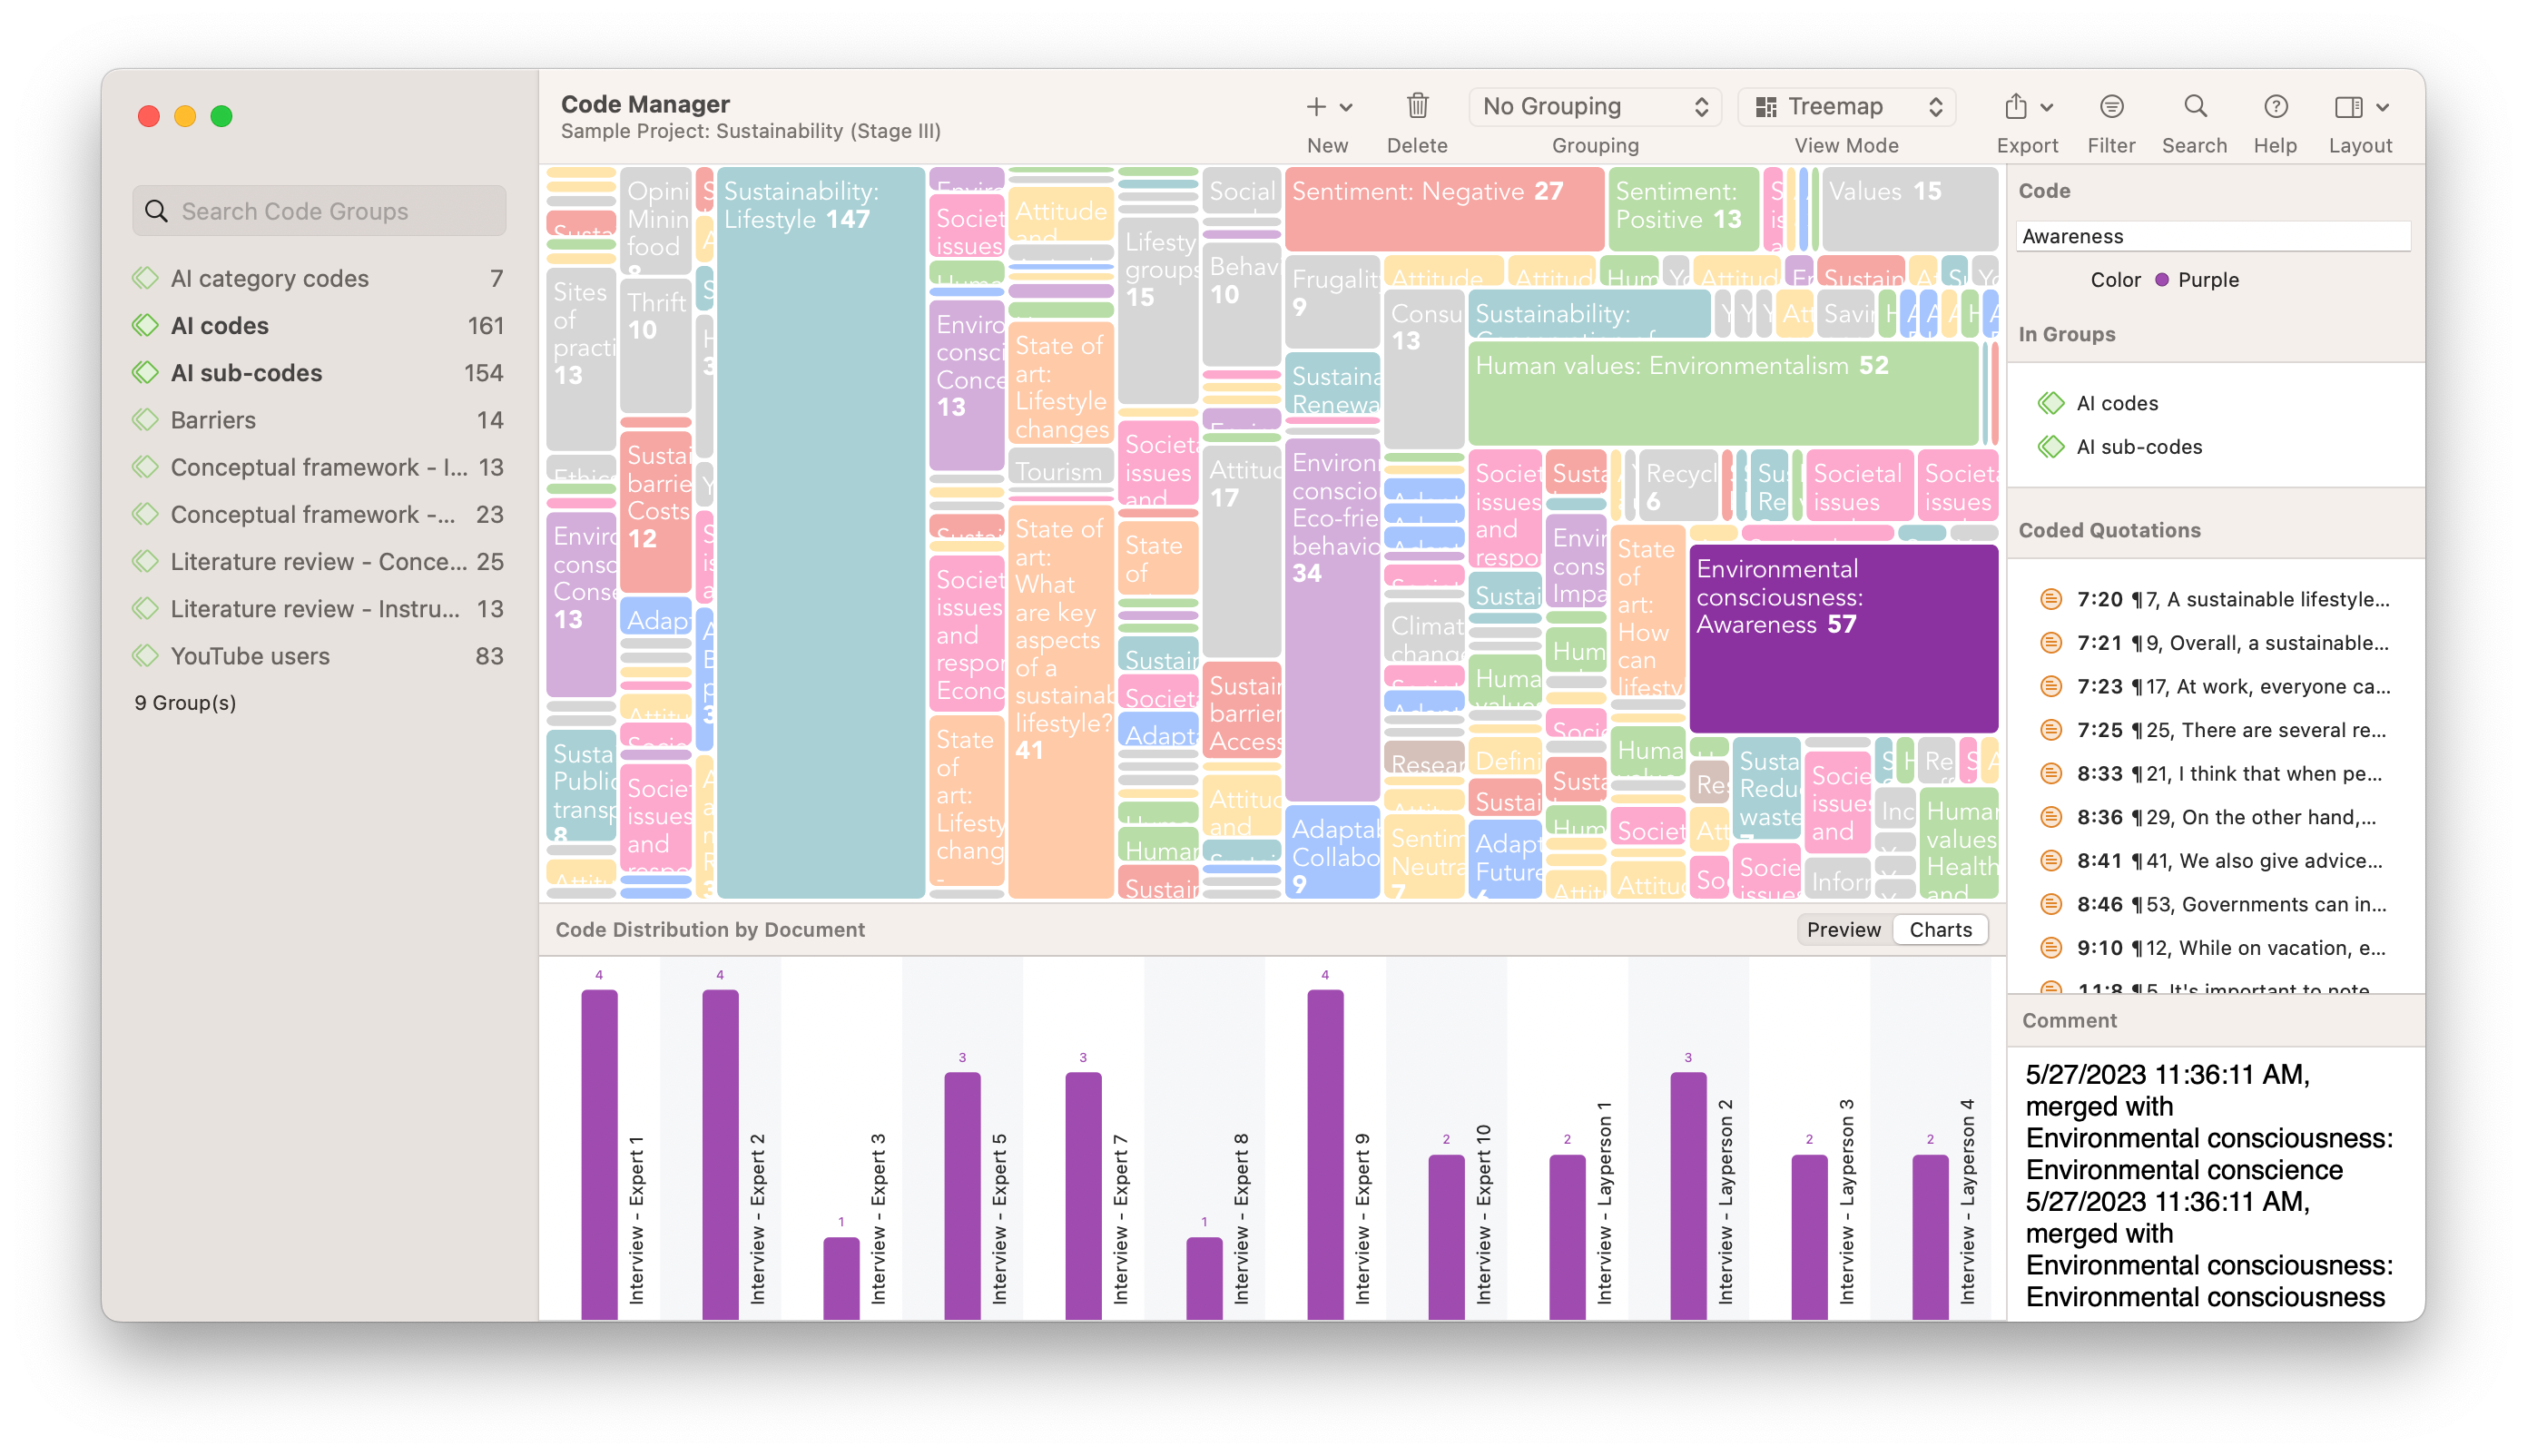
A fully coded project in ATLAS.ti can be analyzed qualitatively, like in Networks to help visualize theories arising from your coding structure, or quantitatively, like in the Treemap view that visualizes the most frequently occurring codes and themes. The fully integrated coding system in ATLAS.ti ultimately accommodates all kinds of research paradigms in an accessible and user-friendly manner. With automatic layout options, editable links to define the relationships in your theory, and full integration with the rest of your project, you can use Networks to visualize your theory and guide further analysis.
Other visualizations such as Sankey diagrams, force-directed graphs, and Treemaps are available in ATLAS.ti to visualize your research in multiple ways. ATLAS.ti can help researchers turn their qualitative data into insightful illustrations of code distributions, themes, and much more, to persuade audiences with informative and appealing visuals.
Research Notes in Memos
One area where ATLAS.ti excels over MAXQDA is the tools that facilitate the development of theoretical insights. This is undoubtedly one of those tasks that a researcher can't automate or delegate to artificial intelligence, but QDA software can make this job easier and more insightful.
Memos are an often overlooked feature in qualitative research, but are integral to many rigorous studies.A space for research memos is integrated into ATLAS.ti, allowing for useful notes, reflections, and insights on potential theoretical developments that users can jot down as insights arise. ATLAS.ti memos are intuitive and can be linked to quotations, documents, codes, and groups for organized reference. Unlike in MAXQDA, quotations in ATLAS.ti can be inserted directly into memos to facilitate seamless and integrated analysis connecting key data exemplars to critical reflections.
The complexity of MAXQDA's memo system, with different types of memos, can prove limiting to researchers if their notes relate to different entities in their project. On the other hand, ATLAS.ti allows researchers to create standalone memos or link those memos to any part of their research without restrictions, offering greater flexibility in tailoring a project to any research inquiry.
Interface and Ease-of-Use
ATLAS.ti is designed to ensure that the learning curve required for qualitative data analysis is as easy as possible. Organization and coding are easier in ATLAS.ti while still providing the capabilities to generate critical insights from qualitative data. This means that you can spend less time on the menial tasks of qualitative research and more time devoted to rich analysis that is accessible to you and your research audience.
ATLAS.ti has a clean interface with a clear organization of functions and capabilities. Project entities likes documents and codes are clearly delineated, while the main analysis tools are organized in one place (either in the Analysis menu in Mac or in the Analysis tab in Windows) for easy access.
Moreover, the interface allows you to organize your research in a single window and switch between multiple tabs to view your research through multiple angles. MAXQDA only has the option of undocking document windows from the main screen, a setup which can easily get cluttered without the necessary level of organization.
Organizing Data
In-depth research projects of all sizes will undoubtedly require organization to facilitate data analysis. Even researchers with small research projects can get bogged down in the tedious tasks of categorizing documents by different data types, data collection methods, research sites, and even research participant demographics.
As cumbersome as this challenge is, organization within an entire project is necessary because the greater the level of organization the QDA platform can provide, the richer the analysis. Creswell and Poth (2018), when comparing ATLAS.ti, MAXQDA, NVivo, and HyperRESEARCH, point out ATLAS.ti's ability to quickly search and find data, which is integral to data analysis that is easy and accessible to users.
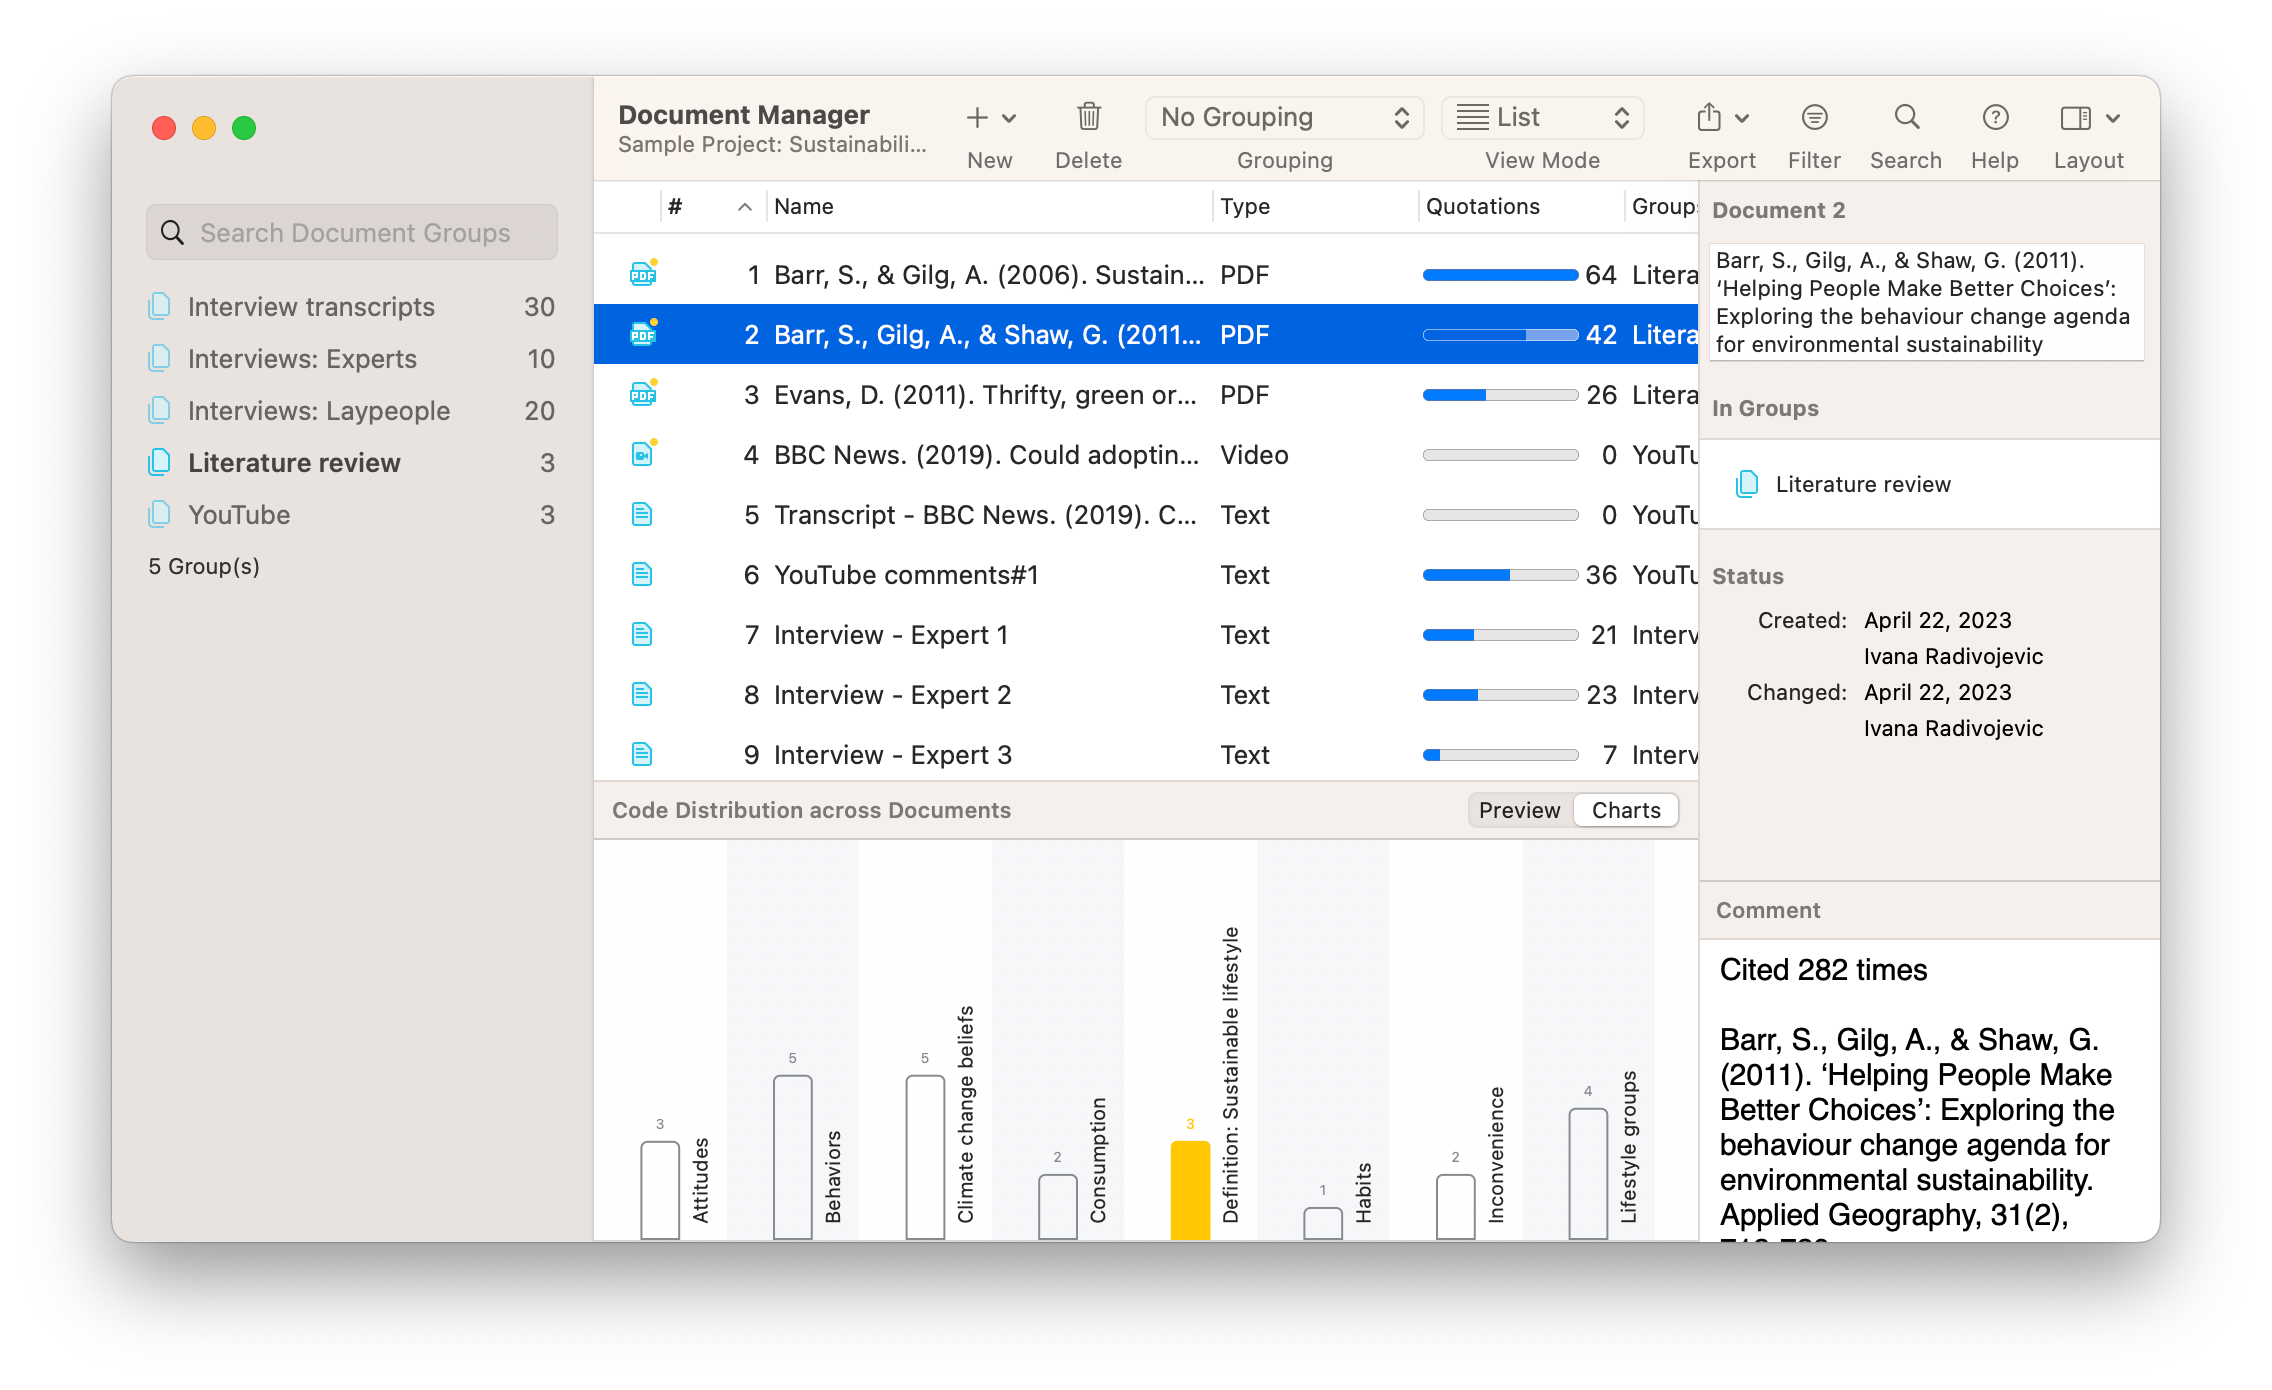
ATLAS.ti excels in data organization with an intuitive Document Manager, allowing you to sort documents by multiple categories represented by document groups. Document groups provide a level of flexibility not seen in MAXQDA, which provides a traditional file system for documents that might limit the organization of data if your documents simultaneously belong to multiple categories or analyses.
In ATLAS.ti, document groups are not mutually exclusive, meaning you can organize data by any number of analytical or organizational categories depending on your research inquiry, facilitating analysis of your data from multiple angles. This is useful when you need to, for example, sort respondent data by gender, age, ethnicity, income level, or any other category useful to your research inquiry.
Collaboration with Team Members
Teamwork on qualitative research projects requires a QDA platform that ensures easy integration of project work. Both ATLAS.ti and MAXQDA have tools to help organize coders' efforts in a collaborative research project and calculate intercoder agreement.
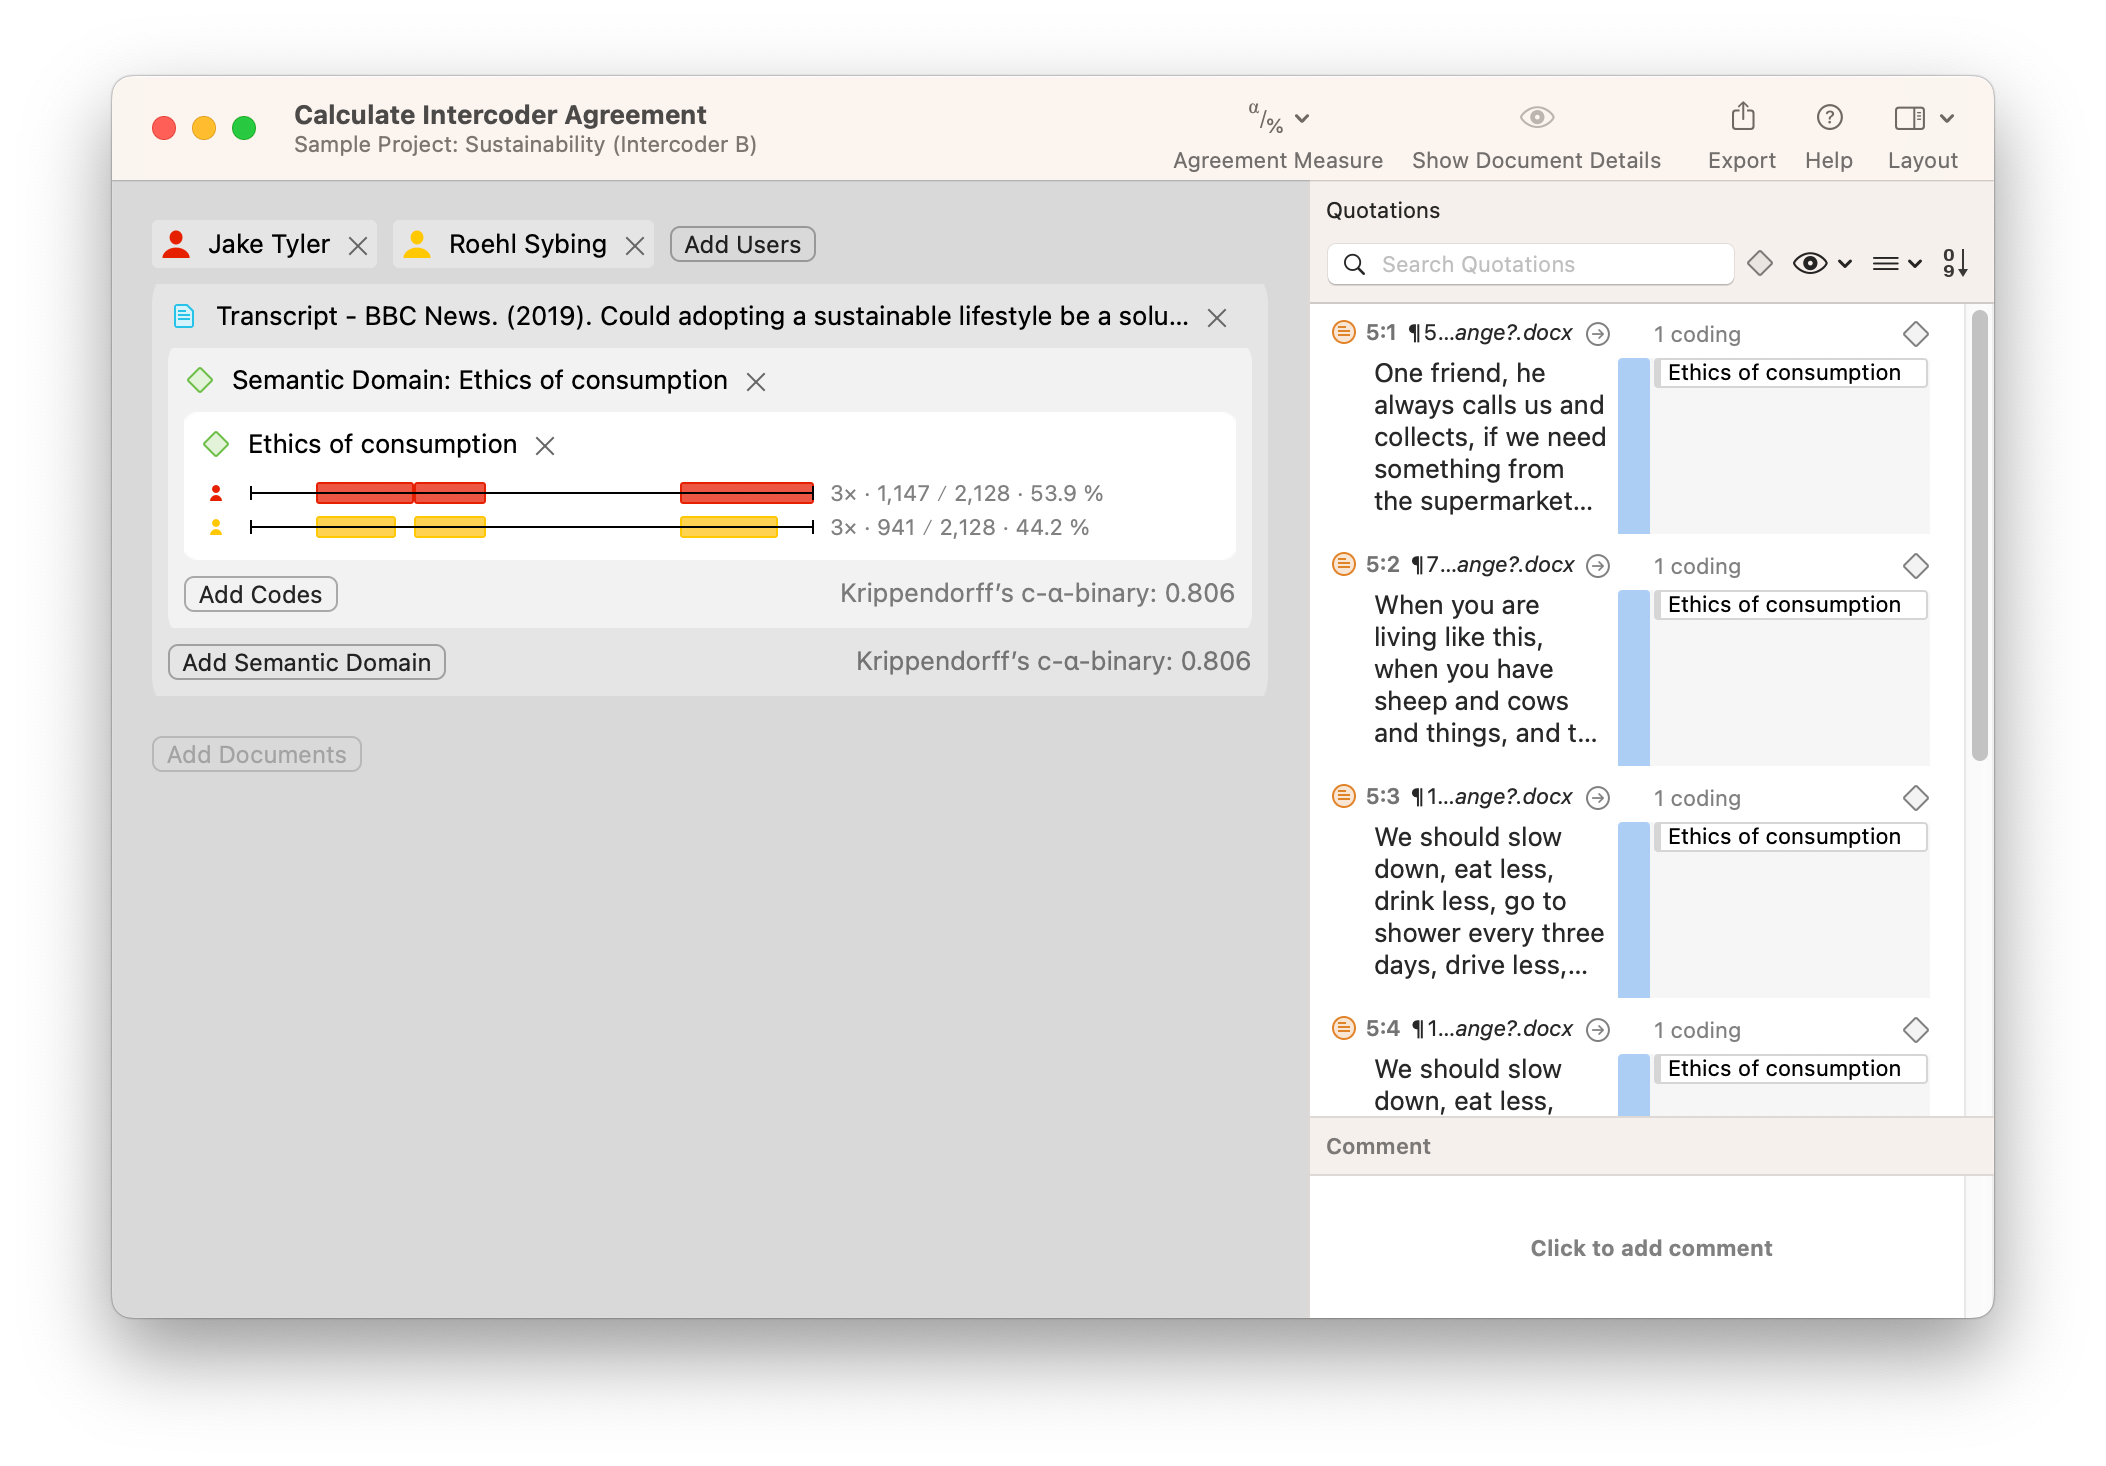
However, ATLAS.ti offers various features that facilitate project sharing among team members, such as ATLAS.ti Web's real-time collaboration for team-based coding. ATLAS.ti is the only QDA software that offers full access to all platforms, including the online ATLAS.ti Web, giving researchers ultimate flexibility in deciding where and how they want to collaborate with others.
Cloud Storage for Project Sharing
ATLAS.ti Desktop also allows for collaboration between users through asynchronous project storage. ATLAS.ti users can store their projects in our cloud storage space and share them effortlessly with other users, who can download projects onto their own devices and continue the work of coding and analysis.
Moreover, while MAXQDA limits team access to projects to up to five users, ATLAS.ti has no limits, meaning all ATLAS.ti users can join a project, regardless of what type of license each person has or where in the world they are located. This allows researchers of different institutions and countries to collaborate on the same research project without restriction.
Compatible Data Types
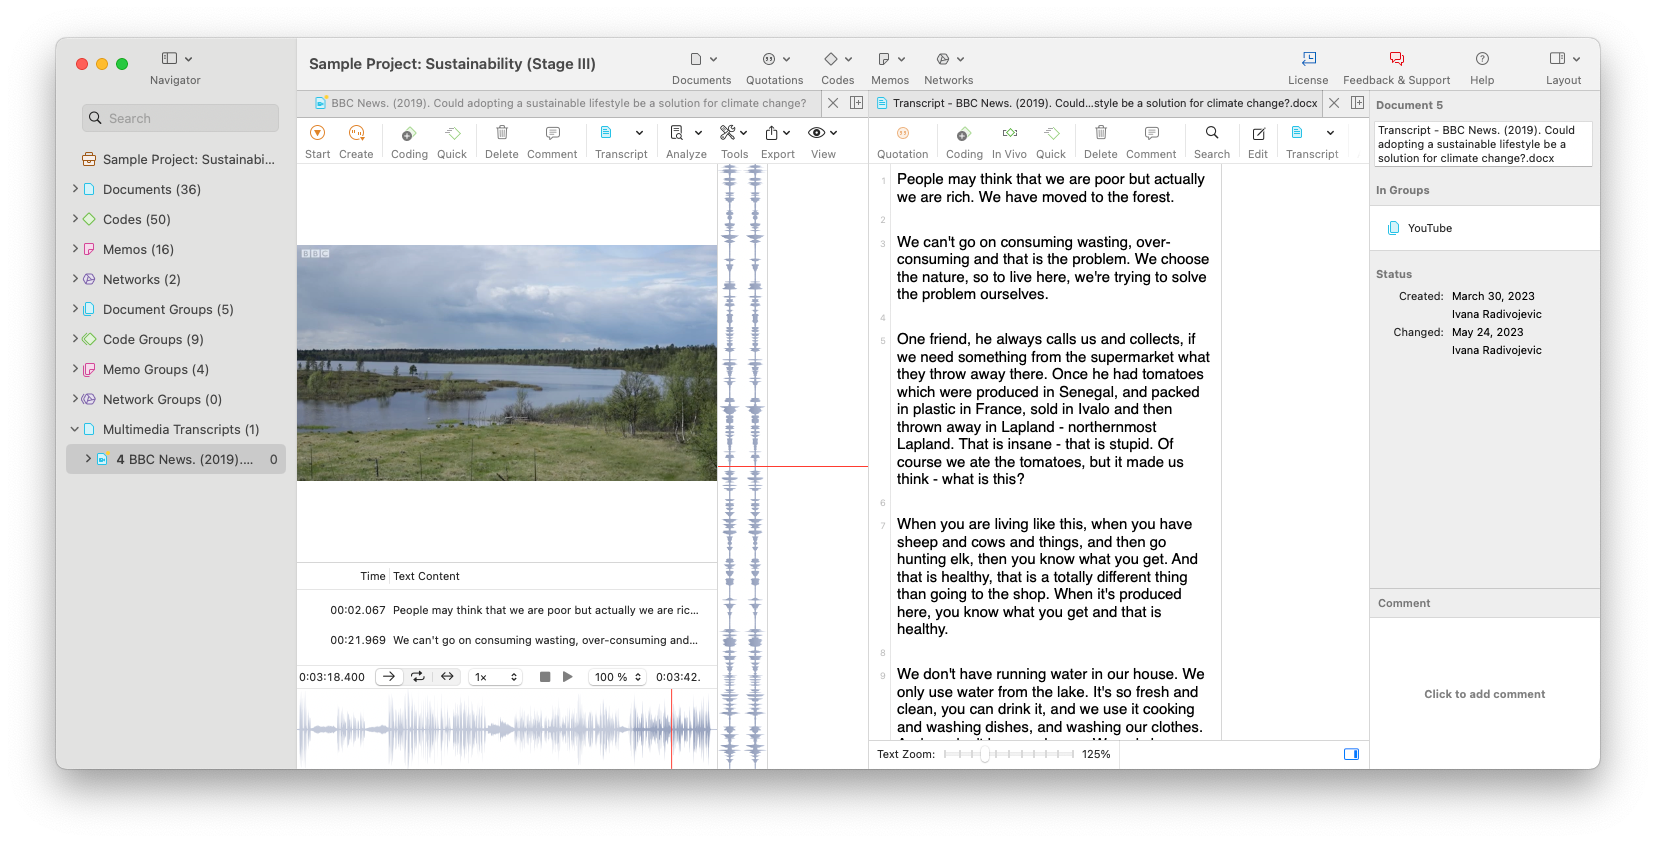
ATLAS.ti's platform can also accommodate a greater variety of qualitative data than MAXQDA. As the needs of qualitative researchers have evolved over the years, the typical project workflow has included various forms of data, including PDF files, multimedia files for images, audio, and video, and files containing geographical data. In-depth research projects rely on various forms of data, all of which can be included in an ATLAS.ti project.
Both ATLAS.ti and MAXQDA are capable of reading commonly used file formats such as text files, GIF files, and PDF files. However, ATLAS.ti is compatible with other file types such as BMP files for images, MOBI files for eBooks, and documents handling geographic data. The wider array of file formats compatible in ATLAS.ti benefits more researchers in more research fields.
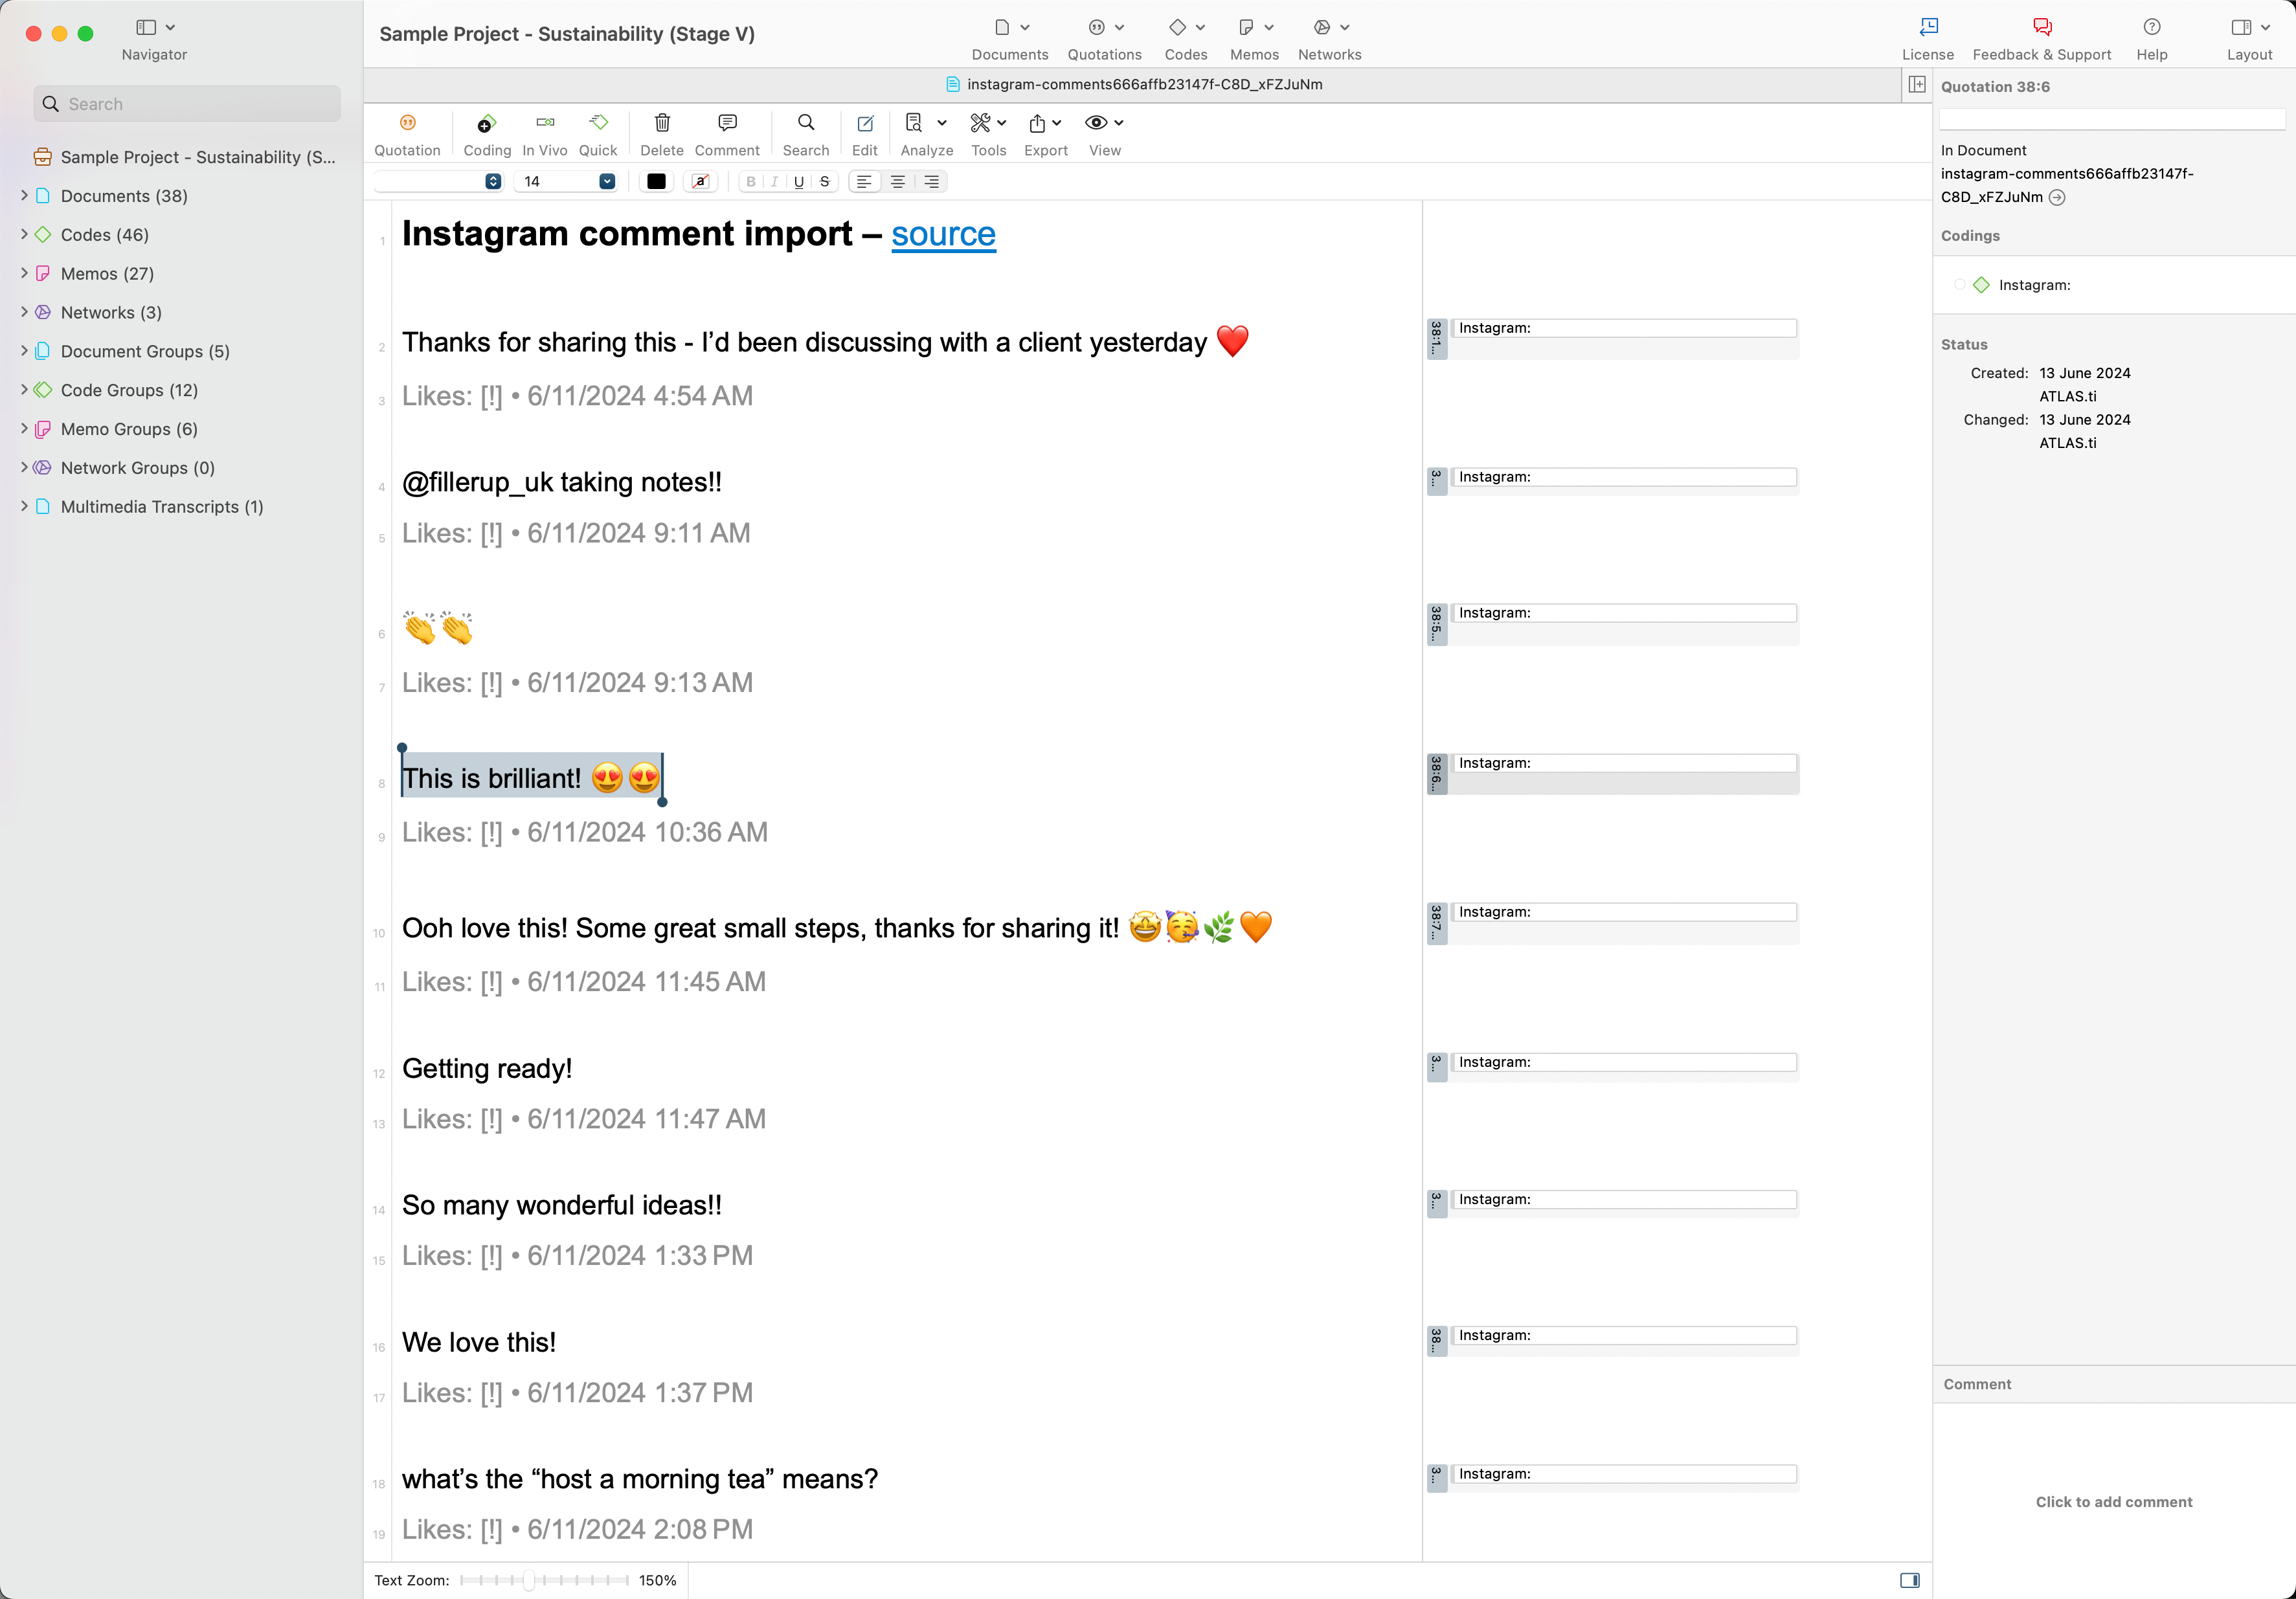
Social media research is also more flexible in ATLAS.ti. MAXQDA only allows users to import Tweets from Twitter/X, limiting researchers who want to analyze trends in social media. On the other hand, researchers can import data from any social media post, such as comments from YouTube videos, TikTok posts, Instagram posts, and more into any ATLAS.ti project.
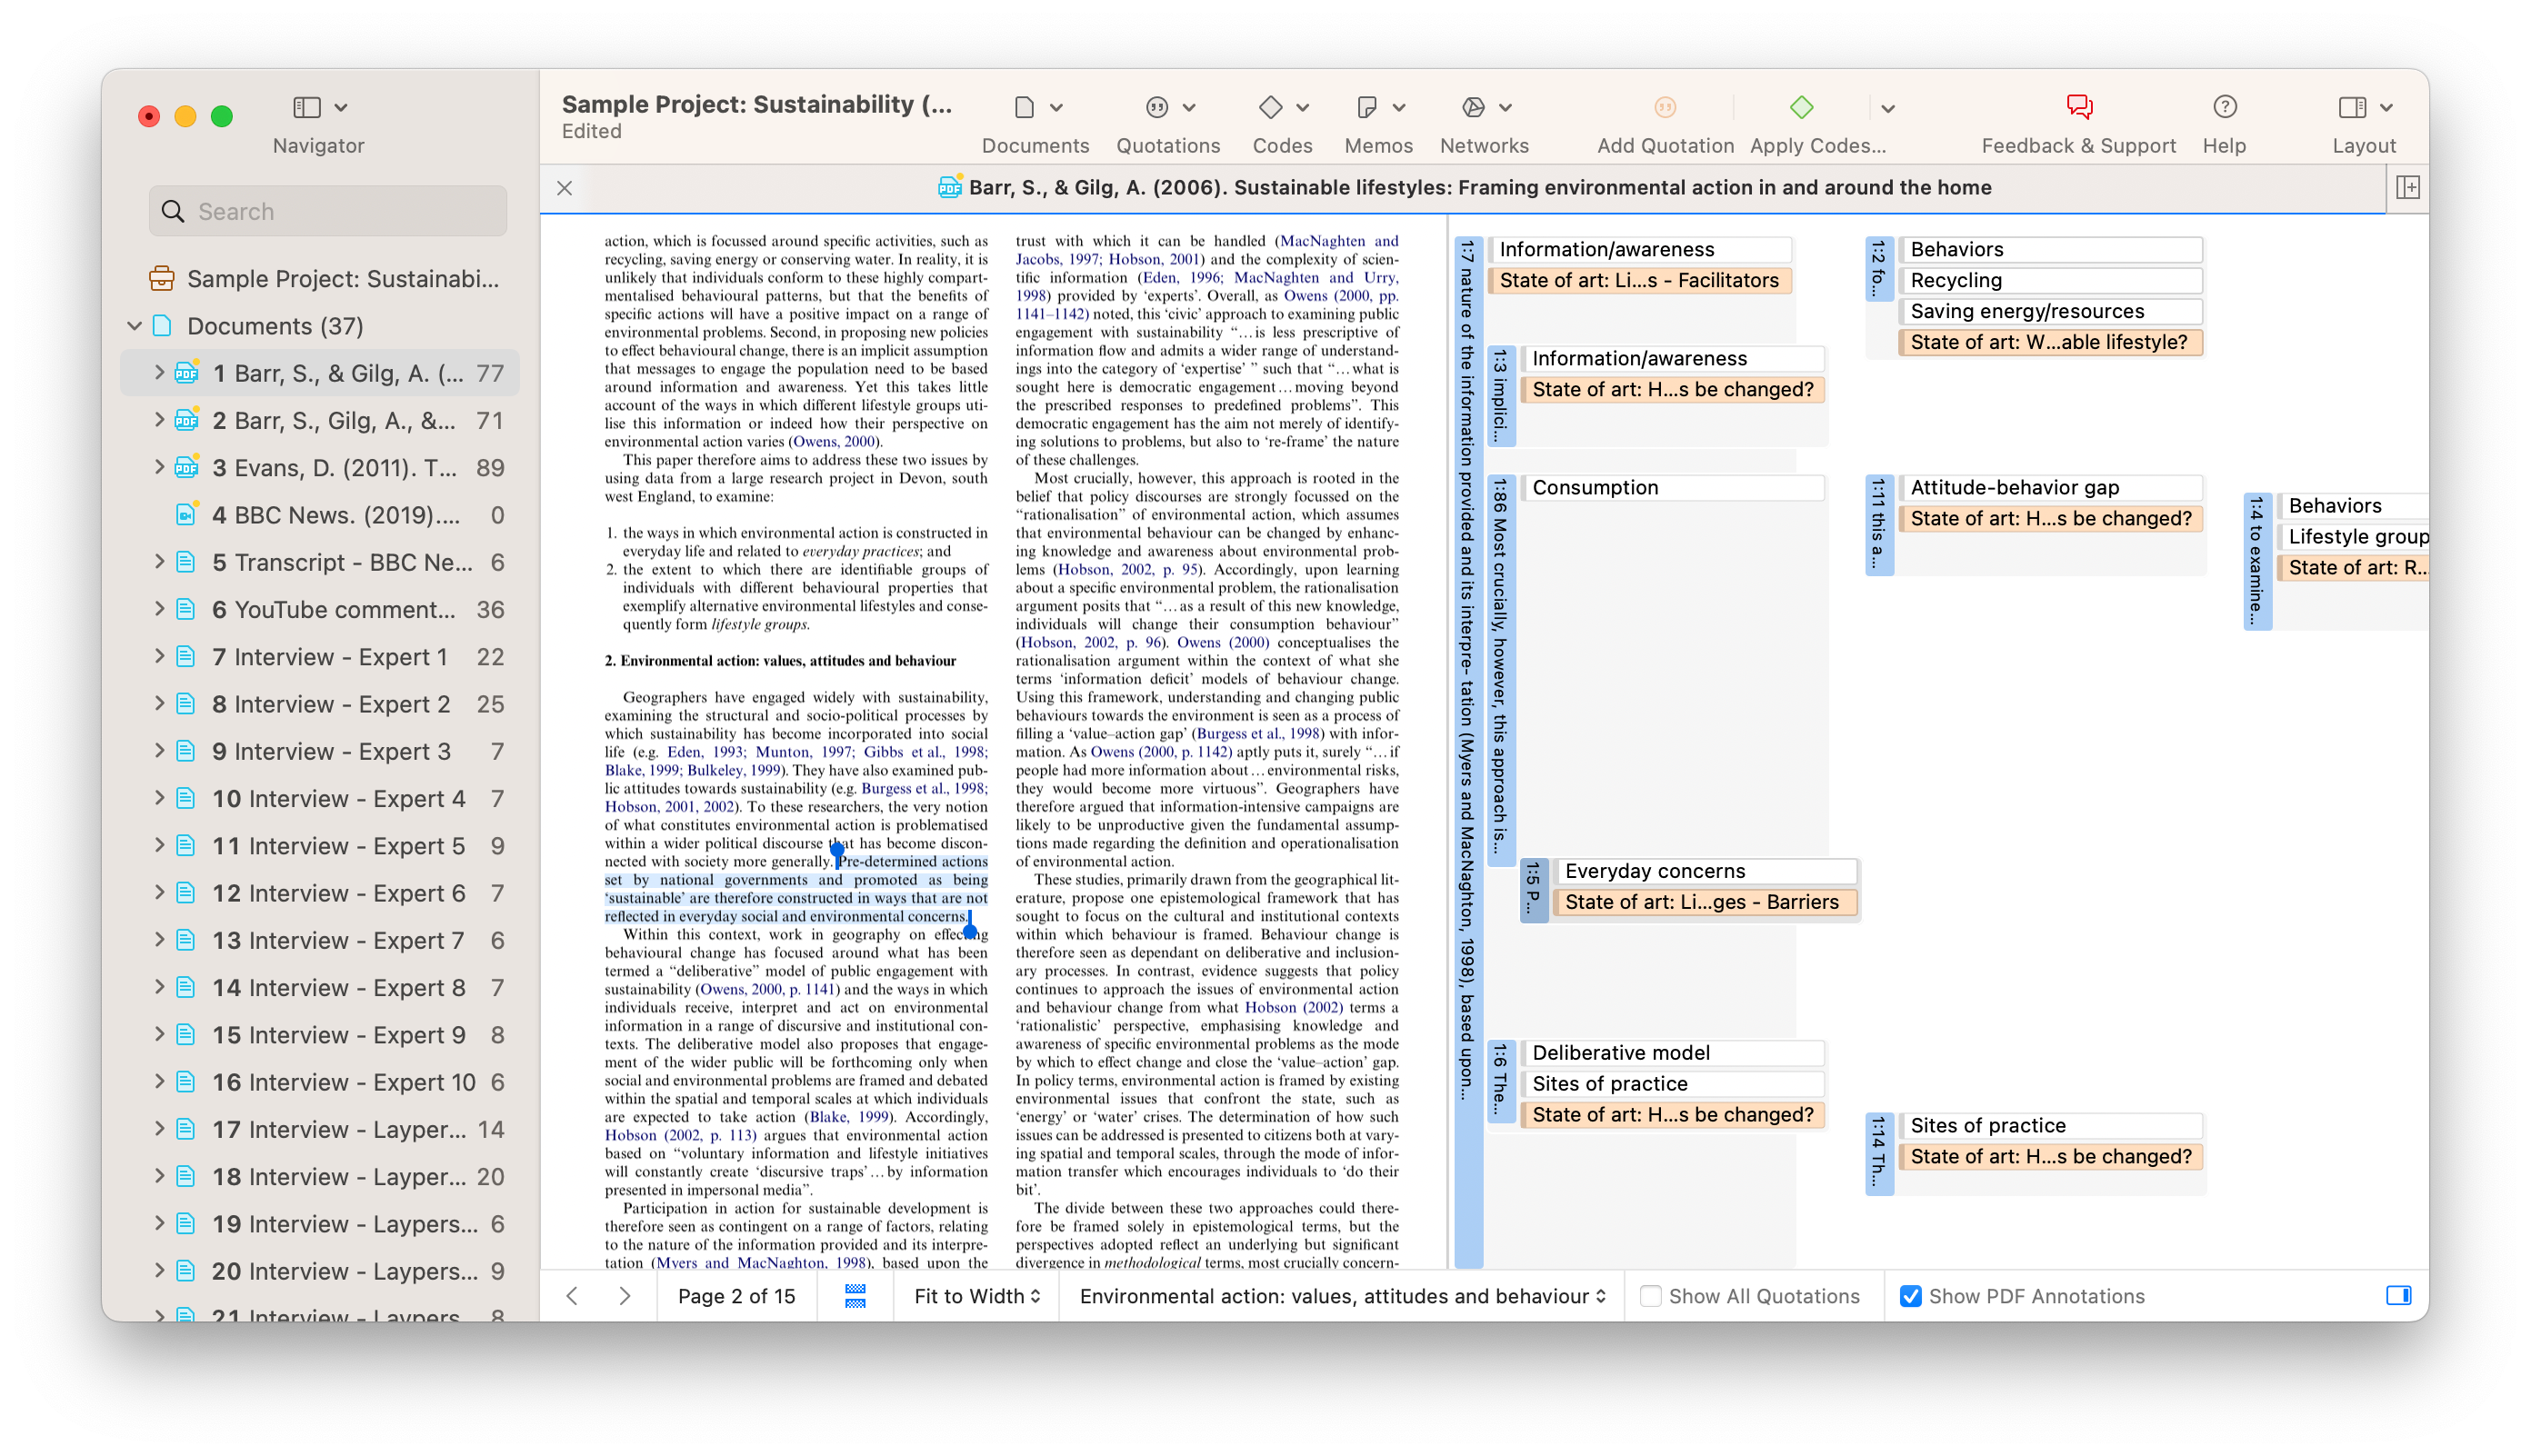
ATLAS.ti users enjoy a greater degree of flexibility with PDF files. Comments in PDF files are preserved as quotations, which can be useful for literature reviews and smoothly transferring initial qualitative analyses from raw PDFs straight into ATLAS.ti.
Comprehensive Support System
The differences between ATLAS.ti and MAXQDA don't stop at the software platform. ATLAS.ti has devoted significant time and effort to building an entire ecosystem around the platform to support qualitative researchers at all stages of the research process.
License purchasing and user management are easy with ATLAS.ti. There are no hidden charges or fees for extra features; unlike in MAXQDA, a Desktop+Web license entitles users to a fully functional QDA platform in ATLAS.ti with no restrictions, no matter the size and scope of the research project. In addition, multi-user ATLAS.ti licenses can be shared with as many people as desired anywhere in the world, with no limitations on the number of software installations, devices that can use ATLAS.ti, access to Windows, Mac, or Web platforms.
In other words, an ATLAS.ti multi-user license offers ultimate flexibility, so license admins can share access with anyone else and easily manage the license users in their personal ATLAS.ti admin account. The license management system automatically frees up a seat in the license as soon as one person logs out of their session, allowing anyone else to occupy that seat when they log into ATLAS.ti Windows, Mac, or Web.
ATLAS.ti has a whole host of online trainings and written resources to guide users on qualitative research methodology and the ATLAS.ti platform. All of these resources, written by experts in ATLAS.ti, are created with the goal of instilling users with greater expertise in qualitative research.
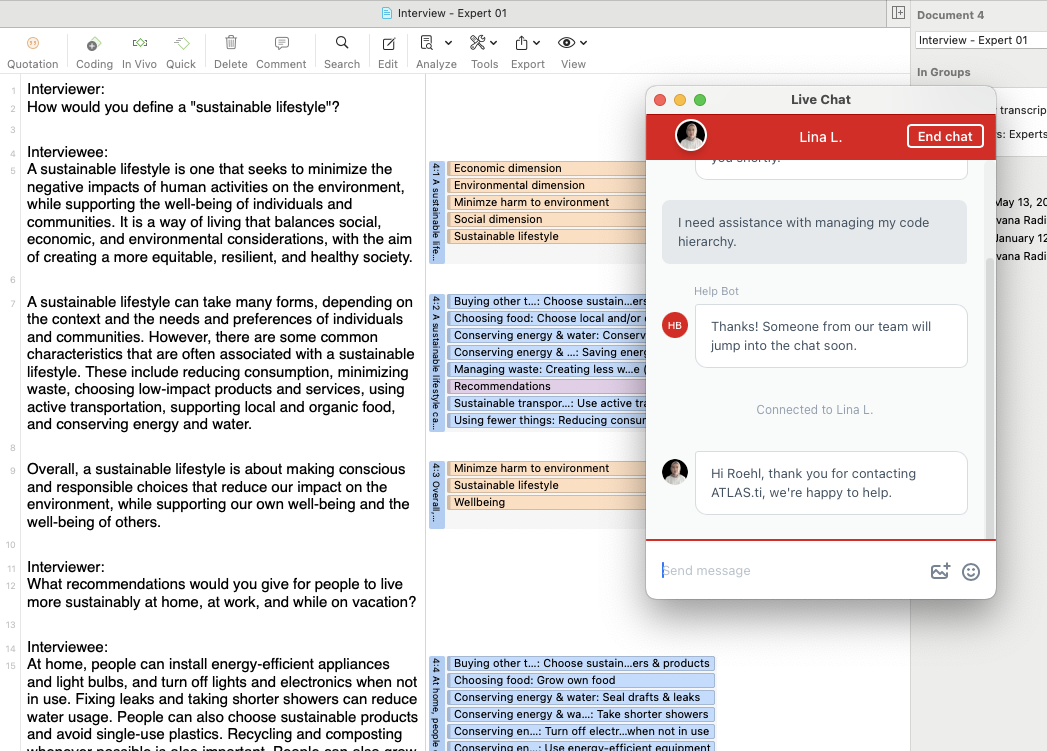
ATLAS.ti users enjoy free perpetual access to a support team of experts who can answer technical and methodological questions, 24 hours a day, 5 days a week. Through email, telephone, and live chat, ATLAS.ti users can take advantage of a level of user support that isn't available with other QDA platforms.
Overall Benefits
While ATLAS.ti and MAXQDA serve qualitative researchers in all the core aspects of data organization and data analysis, ATLAS.ti has a number of distinct advantages that add up to overall benefits that make the research process easier and more insightful.
User-Friendly Interface
Users turn to ATLAS.ti for its intuitive and user-friendly interface. The platform is designed to make the research process as easy as possible, enabling researchers to quickly grasp its functionalities and focus more on their data analysis rather than software navigation. With a clean and organized layout, ATLAS.ti provides clear delineation of project entities such as documents, codes, and memos, making it easy to manage and analyze data efficiently.
Unlike MAXQDA's interface, which can become cluttered with undocked windows, ATLAS.ti's single-window interface with multiple tabs ensures a streamlined workflow. This ease of use allows researchers to dedicate more time to generating critical insights from their qualitative data.
Handling Qualitative Data
ATLAS.ti offers significant flexibility in data handling, accommodating a broader range of file types and data formats than MAXQDA. Whether dealing with text files, PDFs, multimedia files, or even geographical data, ATLAS.ti seamlessly integrates these diverse data sources into a cohesive project. Researchers can also import data from various social media platforms, not just limited to Twitter/X like in MAXQDA.
Additionally, ATLAS.ti’s ability to preserve PDF comments as quotations enhances the literature review process, making it easier to transfer initial qualitative analyses directly into the platform. This extensive compatibility ensures that researchers can include all relevant data in their analysis, providing a more comprehensive understanding of their research topic.
Easy and Effortless Collaboration
ATLAS.ti excels in facilitating collaboration among research team members, providing tools that enable real-time and asynchronous teamwork. With ATLAS.ti Web's real-time collaboration feature, multiple coders can work on the same project simultaneously, ensuring consistent coding and consensus among team members. In contrast, MAXQDA limits team access to projects to up to five users, which can hinder large, multi-institutional research efforts.
Furthermore, ATLAS.ti offers cloud storage for easy project sharing and collaboration without any restrictions on the number of users or licenses. This robust collaboration capability allows researchers from different locations and institutions to work together seamlessly, enhancing the overall research process and ensuring more comprehensive and rigorous data analysis.
Licensing Options
ATLAS.ti offers transparent licensing options with no hidden fees, allowing individuals and organizations to fully utilize its capabilities without unexpected financial burdens. The software is available on multiple platforms, including desktop, online, and free mobile versions. Each version of ATLAS.ti is natively designed for its specific operating system, ensuring optimal functionality and performance. Researchers can seamlessly move their projects across ATLAS.ti Desktop, Web, and Mobile, enjoying 100% compatibility between ATLAS.ti Windows and Mac. This flexibility enables researchers to work efficiently from the office, at home, or in the field, and allows teams to collaborate smoothly, even when using a mix of Windows and Mac computers. This comprehensive accessibility supports a dynamic research environment and caters to the modern researcher’s mobility needs.
More Powerful AI Tools
ATLAS.ti offers unparalleled artificial intelligence capabilities not seen in other QDA platforms, suiting researchers of all backgrounds and preferences. With the flexibility afforded by the various AI-powered tools in ATLAS.ti, users can code a little bit or a lot of their data with AI, which is made more powerful with the capability to tailor the coding process to specific research questions defined by the researcher. You can also engage in critical reflections with Conversational AI or just get to the salient points of the data with AI Summaries.
Most importantly, researchers can always easily access the exact data segments from which any AI results are generated, offering researchers greater transparency and control over how AI analyzes their data. Moreover, ATLAS.ti's AI capabilities come with a paid license, requiring none of the extra fees or restrictions found with the use of MAXQDA's AI tools. Regardless of the size of your data set, you can take full advantage of ATLAS.ti's AI-powered features and make the most of your qualitative data.