The interview analysis tool that helps you leverage every piece of data

Make the right choice when it comes to qualitative data analysis software: With ATLAS.ti, you can simplify making sense of interview data and get instant access to interview analysis tools that uncover more valuable insights.

Unlock qualitative insights from interview data – without a hassle

Easily organize and analyze qualitative data from interviews in one powerful research platform. Whether you have basic analytical needs or more complex requirements – with ATLAS.ti, you can effortlessly discover qualitative findings for your projects.

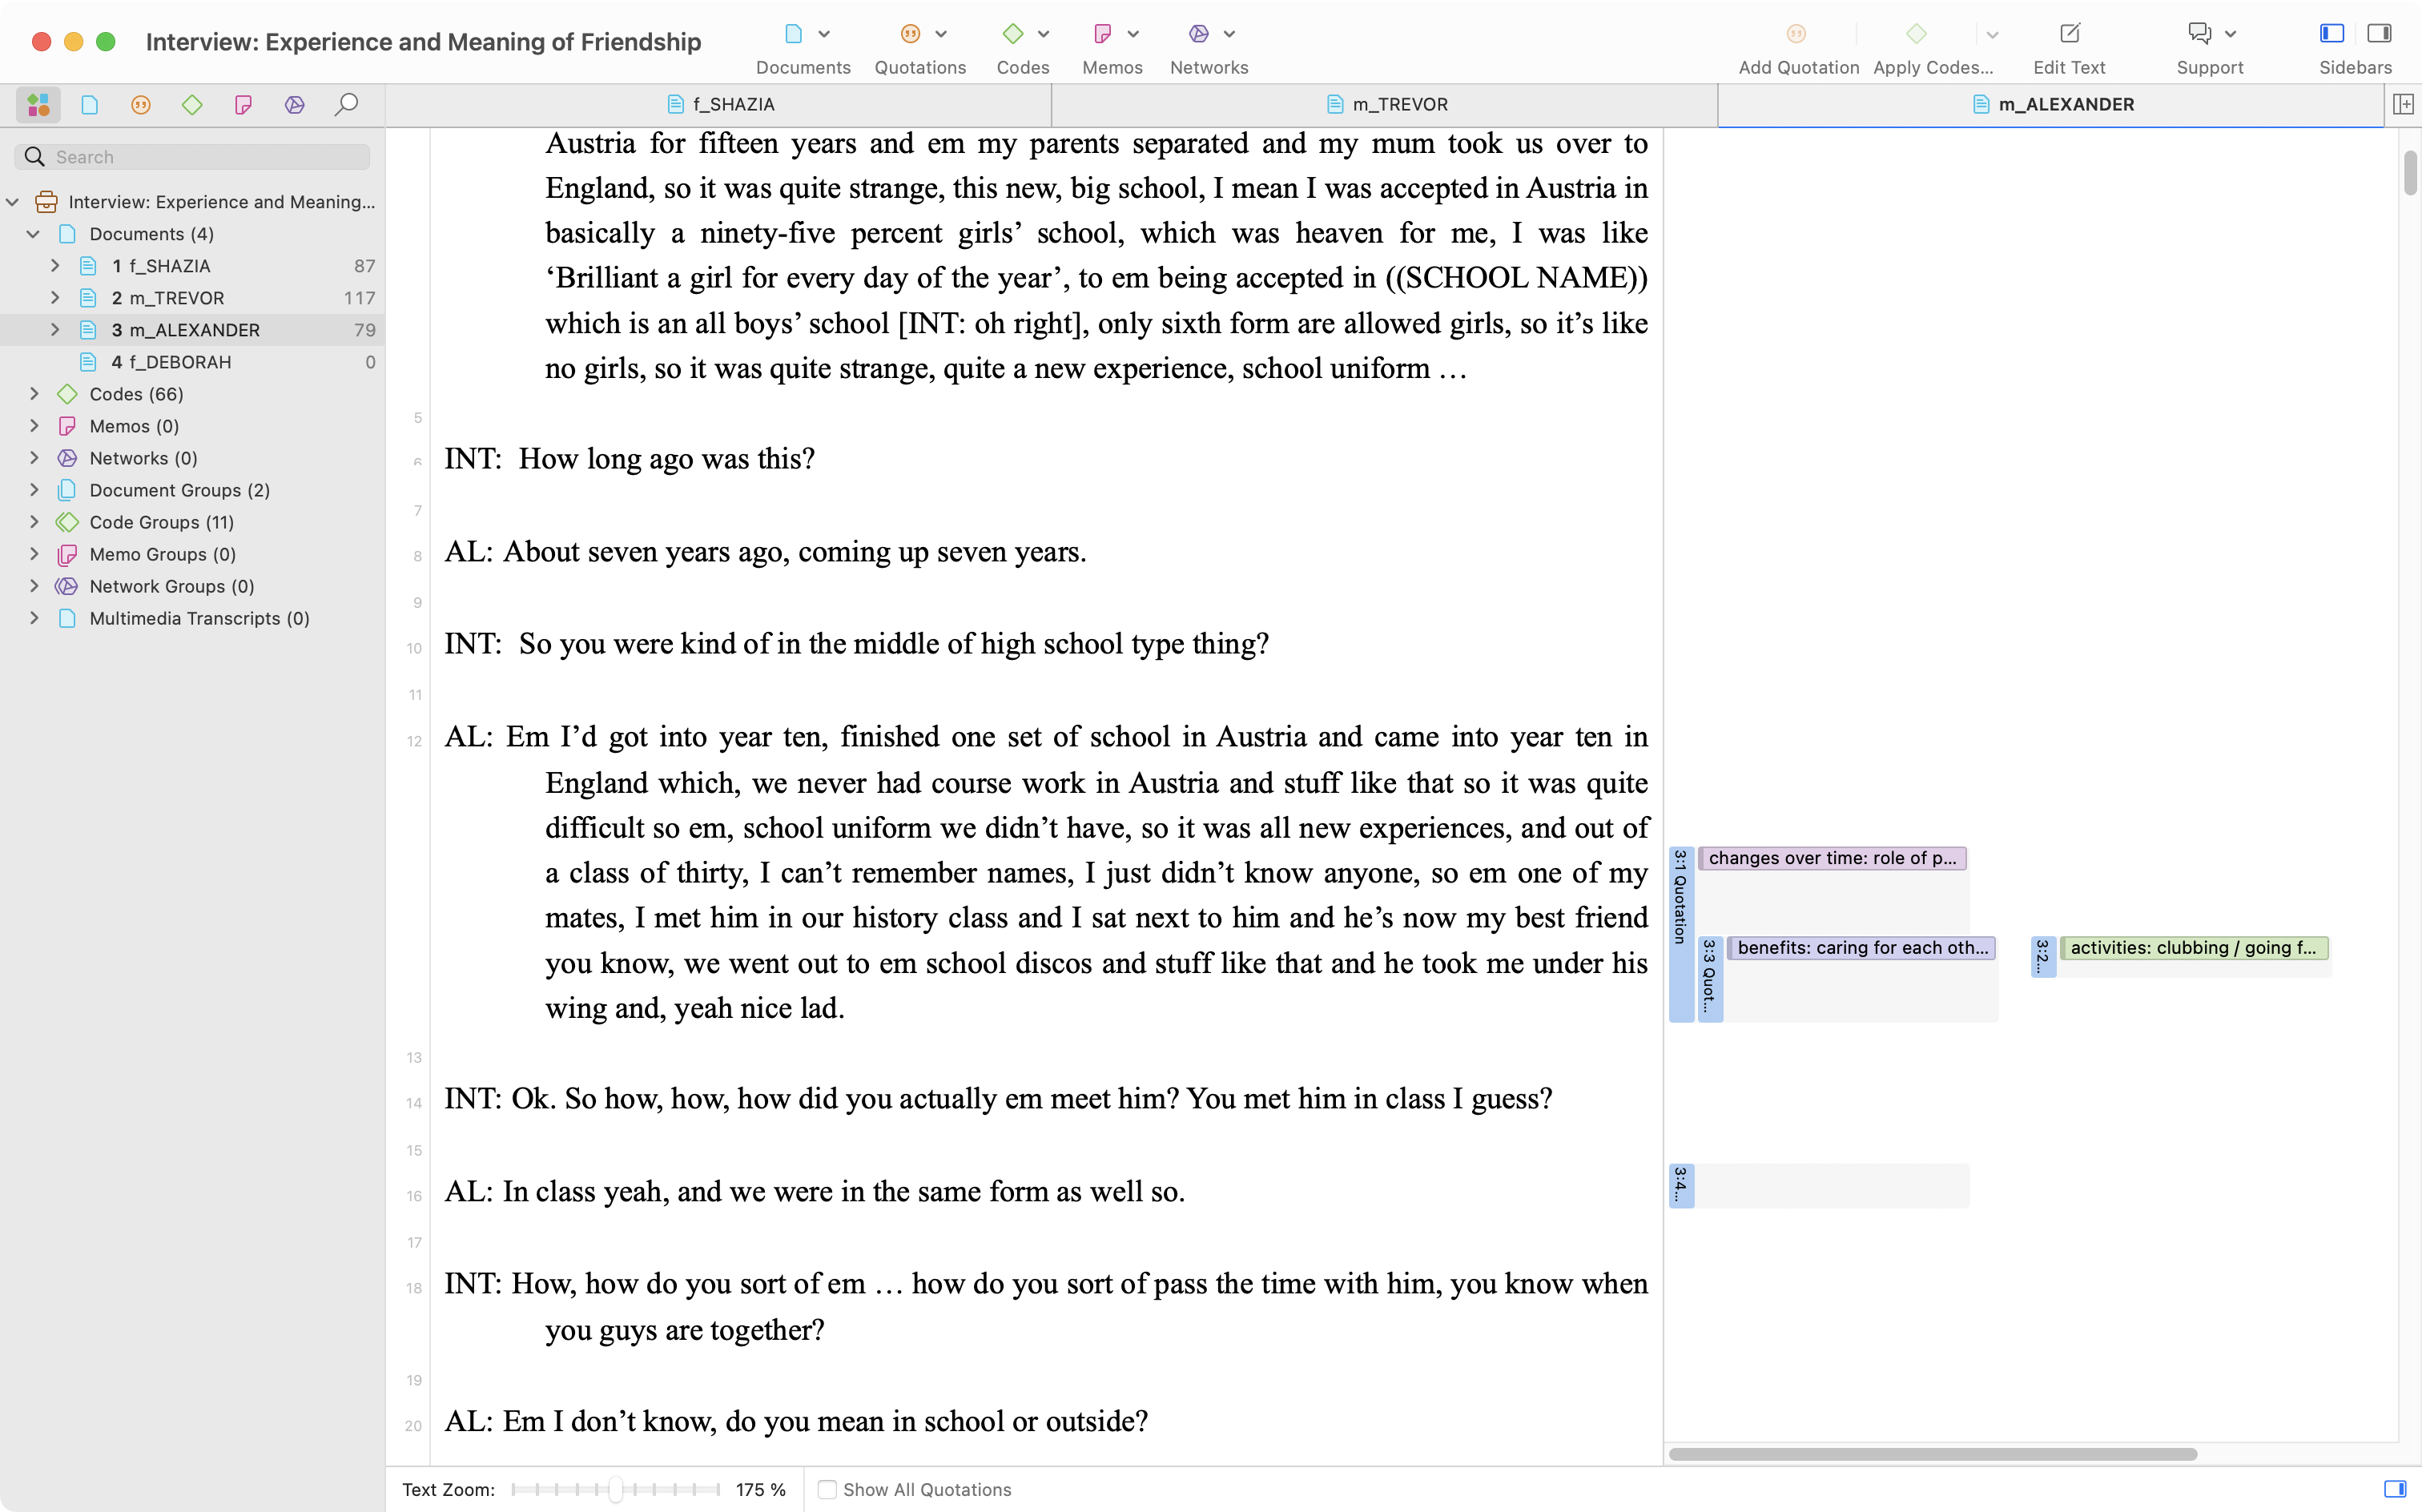
Easy-to-use workflow with no stone left unturned

With ATLAS.ti, use our qualitative data analysis tools to analyze every piece of data from your interview participants – whether it's transcriptions, audio and video files, or even pictures. Easily code your data, make sense of motivations behind responses and discover qualitative insights that make a difference.

Harness the power of visualization for your interview analysis

With a qualitative data analysis tool like ATLAS.ti, you can analyze data to create beautiful charts, networks, and diagrams that actually make sense. Streamline your interview analysis process with help from the leading qualitative research platform instead of trying to figure out how to deal with complex data.

ATLAS.ti boasts many benefits including intuitive design. But its customer service really is what wins them the gold star. Especially for those who are not too technologically savvy, ATLAS.ti is the software that will have the patience to deal with you!
Cristina Parajon
Sociology student, Harvard University
ATLAS.ti is the easiest and most comfortable software to use for coding qualitative data.
Svetlana Poleschuk
PhD, Education Researcher, UNICEF
Qualitative data offers great value in really understanding the context for any research endeavour, and ATLAS.ti is the go-to software to pull analyses together in a systematic way.
Prof. Michelle J. Hindin
Founder and Director - Evidence 4 Global Impact, LLC
I want to say thank you for helping me today. With your help I am now able to use ATLAS.ti easier to finish my dissertation. Again, I want to say thank you. The ATLAS.ti support is by far the best support I have ever received from a software company
Nicholas Belongie, PhD
Nicholas Belongie, PhD - University at Buffalo, USA
The ATLAS.ti support desk helped me a great deal with several challenges in ATLAS.ti. On the way I learned how to solve issues in future! I can recommend working with ATLAS.ti and diving into its possibilities because you'll be surprised by what this fantastic analysis software can have you discover from your data!
Marieke De Wijse-Van Heeswijk
PhD researcher - Radboud University
I have been an ATLAS.ti user for over 20 years, and during that time the software has always been my first choice for qualitative research. ATLAS.ti continues to innovate and improve each year adding new features and benefits for its user community. I highly recommend it for your qualitative research.
Ken Riopelle
Research Professor, Wayne State University
ATLAS.ti has been a great tool for my PhD research which I have been using to analyze qualitative interviews from Ghana and Nigeria. It was the perfect solution, and we were happy to learn that we could collaborate with researchers in any country or institution without obtaining a special license.
Dr. Kwabena Kusi-Mensah
FWACP (Psych), MSc.CAMH (Ib.), PhD Candidate in Psychiatry, University of Cambridge
The Canadian Foundation for Animal-Assisted Support Services {CFAS} is a grateful recipient of the ATLAS.ti software. I have gradually learned more about using the software to share our charity's narrative, presentation content, and research project outcomes. ATLAS.ti staff have been highly supportive and patient with me as I continue to embark on this incredible journey of discovery.
Joanne Moss
CEO/Founder - The Canadian Foundation for Animal-Assisted Support Services {CFAS}
The ATLAS.ti organization has a strong support team available to researchers and the trainers are excellent. Their webinar presenters are world-class experts who show how ATLAS.ti can be used to analyze data from a wide variety of disciplines.
Dr. Karin Olson
PhD, RN, FAAN, Adjunct Professor, School of Nursing - The University of British Columbia
We are an early-stage startup building the world's first virtual clinic specialized in Team-Based Care. I used ATLAS.ti first in studies. Then I used it for my work at the World Health Organization. Now we are using it for many of our research activities at Consulto.
Basem Higazy
Co-founder and CEO of Consulto

Deepen your interview analysis effortlessly

Import and organize interview data

Import and analyze any type of interview data – ATLAS.ti supports all standard text and transcription files such as Word and PFD, as well as audio and video recordings.

Analyze interview data with ease and speed

Utilize easy-to-learn workflows in your data analysis that save valuable time, such as auto coding, sentiment analysis, team collaboration, and more.

Leverage AI-driven tools

Make efficiency a priority and let ATLAS.ti do your data analysis work with AI-powered research tools and features for faster results.

Visualize and present findings

With just a few clicks, you can create meaningful visualizations like charts, word clouds, tables, networks, among others for your qualitative data analysis.

The faster way to make sense of your interview data. Try it for free, today.

FAQ
What are the potential uses for interview research?

A qualitative interview is an excellent tool for gathering meaningful insights from respondents. For example, suppose that you have statistical data that draws correlations between age and customer satisfaction with a particular product.

Customer interviews can allow a company to conduct more profound data collection of customer feedback regarding why younger consumers are more satisfied with that product than older consumers. Data points from interview research can help data analysts support basic assertions with more insightful perspectives.

Other use cases for interview research include:

  • Performing needs assessment or program evaluation
  • Documenting past events or experiences
  • Elaborating on customer feedback from survey data
  • Gathering qualitative customer data about brand reputation
  • Conducting mixed methods research
How to analyze qualitative data from an interview?

Your research goals will determine the most effective data analysis you should choose. The more commonly used analysis methods include content analysis, thematic analysis, and narrative analysis.

Content analysis

Content analysis can help generate quantitative data extracted from qualitative analysis. It analyzes text for the frequency of:

  • words
  • phrases
  • concepts

These frequencies provide an understanding of hidden patterns embedded in interview respondents' utterances and ideas. Content analysis is helpful for researchers conducting interviews with a large number of respondents who need to determine what words or concepts appear most frequently in the data.

Thematic analysis

Thematic analysis is similar to content analysis except for the frequency of topics or themes that interview respondents explore. Researchers who can identify common topics in their data can develop a theoretical framework that may be useful in future research.

Narrative analysis

Qualitative researchers who employ narrative analysis are more interested in how interview respondents construct narratives such as:

  • personal anecdotes
  • biographies
  • retelling of stories

This analytical approach can help guide researchers design future interview studies to more effectively elicit personal narratives.

Analysis of multimedia

You can also analyze the video or audio data from interviews in ATLAS.ti. For example, the respondents' facial expressions or tone of voice may provide important insight into what they say. You can add transcripts to video or audio files and assign codes to both. This combination will allow you to, for example, code for themes in the transcript and code for emotions (e.g., happiness, stress) in the corresponding multimedia file. You can then see whether those themes and emotions co-occur together.

What types of interviews are common in research?

Three commonly conceived types of interviews are structured, semi-structured, and unstructured.

Unstructured interviews

Unstructured interviews involve open-ended questions without a predetermined order. Unstructured interviews are suitable for market research, for example, if entirely new insights from respondents who are more comfortable with an open-ended conversation.

Semi-structured interviews

In the semi-structured interview, the researcher determines some questions in advance but may also ask follow-up questions so that the respondent can elaborate on their answers. Researchers may ask prepared questions to address their main research questions, but the follow-up questions are not predetermined.

Structured interviews

A structured interview is the most restrictive form of an interview, as all the questions are predetermined. In some cases, respondents must answer a question using only a set of choices provided by the interviewer. The structure ensures that neither the interviewer nor the respondent can stray off-topic. At the same time, the resulting data set might allow for a more straightforward quantitative analysis given the narrow set of questions and possible answers.

How can I conduct a content analysis of interviews with a qualitative data analysis software?

A content analysis mainly relies on the frequency of words or phrases present in interviews. ATLAS.ti is a qualitative data analysis software that allows researchers to determine and visualize these frequencies in interviews.

Word Clouds and Concepts

The Word Cloud tool counts how many times a word appears in a set of documents. You can then create a visualization of the terms that appear the most often in an interview or a group of interviews. The Concepts tool makes a similar visualization, except it seeks out phrases that commonly occur in the data. Either tool helps conduct a content analysis by converting text into quantitative data.

Synonyms in Text Search

You can use the Text Search tool with Word Clouds to search for synonyms. This can allow you to analyze the frequency of words that have a similar content or meaning.

For example, if a Word Cloud tells you that "happy" occurs frequently in your text, the Text Search function will suggest synonyms such as "joyful" and "delighted" and search for quotations that include those words. You can then directly apply a code such as "positive feelings" to all quotations with any of those words. In turn, these broader codes can be analyzed for their frequency to provide a sense of which ideas are most common in your data.

How can I conduct a thematic analysis of interviews?

A thematic analysis requires making sense of the data by identifying prominent themes or topics apparent in the data. Coding in ATLAS.ti allows researchers to mark segments of text with short but descriptive codes. You can organize these preliminary codes into more significant categories and themes. The resulting thematic analysis can tell you what key topics appear most commonly in the data.

ATLAS.ti has code groups and code folders for organizing codes. You can then use these groups and folders in Code-Document Table to analyze the frequency of larger themes apparent in different documents or document groups.

For example, you may have the following themes as code groups:

  • challenges
  • opportunities
  • shortcomings

You may also have the following document groups:

  • office work
  • remote work
  • domestic travel
  • international travel

Analyzing all of these elements in Code-Document Table can give you a sense of which themes appear more often in which document group.

How can I conduct a narrative analysis of interviews?

Narrative analysis also involves coding the interview data. However, while analyzing respondents' perspectives, you also analyze how they talk and develop ideas. You can employ either inductive coding or deductive coding. Think of these strategies as bottom-up coding or top-down coding, respectively.

Inductive coding

In inductive coding, you develop codes based on what you see in the data. If, for example, you are interviewing customers about their experiences with a product, you may find that they usually talk about a problem they want to solve by buying the product and the results they have when using the product. What is common in each interview study will depend on the research questions you are trying to answer. You can use those commonalities to conduct a deeper data analysis (e.g., what problems are most common when customers buy the product).

Deductive coding

For deductive coding, you can identify parts of a narrative using a predetermined framework that defines the narrative. For example, you might guess before the qualitative analysis that stories about immigrants involve life in their country of origin, their reason for moving to another country, and their experiences adjusting to their new lives. As a result, your coding process should involve seeking out those parts of respondents' anecdotes and analyzing each aspect of the narrative for commonalities (e.g., the most common reasons why immigrants move to a new country).

What are other considerations for interview research?

Beyond data collection, coding, and analysis, good interview research requires analysts to clean the data, organize the interviews, and reflect on the qualitative analysis.

Data cleaning

The purpose of cleaning data is to ensure that the data analysis is as efficient as possible. For example, consider analyzing only the interview respondent's answers and not the interviewer's questions using the Word Cloud or Concepts tools. This task may mean analyzing a modified interview transcript with only the respondent's answers so that the data analysis does not include the interviewer's words.

Data organization

Organizing the interviews also helps to ensure a smooth data analysis process. There are various ways to organize qualitative data effectively, but one good organization strategy is giving each interview respondent their own document in an ATLAS.ti project. Using the Code-Document Table tool, you can determine the frequency of codes associated with each interview to identify differences in themes or patterns among interview respondents.

Reflecting on respondent bias

It is also essential to consider the inherent biases in any set of qualitative data. Interviews involve interactions between people. As a result, there is always the possibility that respondents could provide answers they think the interviewer would like to hear. Some examples of social desirability bias include situations where the respondent says they always eat healthy food or donate to charity.

Respondents may experience a tendency to adjust their answers toward such socially desirable practices. This bias can also occur in focus group discussions, especially when respondents feel pressured by others in the group to express more desirable opinions than they otherwise would. Bias and subjectivity are unavoidable in qualitative research, but what is important is that researchers carefully reflect on how biases can affect respondents' perspectives and the resulting qualitative data analysis.