
- What is Thematic Analysis?
- Advantages of Thematic Analysis
- Disadvantages of Thematic Analysis
- Thematic Analysis Examples
- How to Do Thematic Analysis
- Thematic Coding
- Collaborative Thematic Analysis
- Thematic Analysis Software
- Thematic Analysis in Mixed Methods Approach
- Abductive Thematic Analysis
- Deductive Thematic Analysis
- Inductive Thematic Analysis
- Reflexive Thematic Analysis
- Thematic Analysis in Observations
- Thematic Analysis in Surveys
- Thematic Analysis for Interviews
- Thematic Analysis for Focus Groups
- Thematic Analysis for Case Studies
- Thematic Analysis of Secondary Data
- Thematic Analysis Literature Review
- Thematic Analysis vs. Phenomenology
- Thematic vs. Content Analysis
- Thematic Analysis vs. Grounded Theory
- Thematic Analysis vs. Narrative Analysis
- Thematic Analysis vs. Discourse Analysis
- Thematic Analysis vs. Framework Analysis
- Thematic Analysis in Social Work
- Thematic Analysis in Psychology
- Thematic Analysis in Educational Research
- Thematic Analysis in UX Research
- How to Present Thematic Analysis Results
- Increasing Rigor in Thematic Analysis
- Peer Review in Thematic Analysis
- How to cite "The Guide to Thematic Analysis"
Thematic Analysis Software
Qualitative data analysis software significantly streamlines the process of analyzing textual, audio, and video data for researchers. These tools offer a systematic approach to organizing, coding, and interpreting vast amounts of unstructured data, making it easier to identify patterns and recurring themes. The functionality of such software ranges from simple coding to complex analysis, including the visualization of data connections.
This article focuses on the application of ATLAS.ti in conducting thematic analysis. Thematic analysis is a method used to identify, analyze, and report patterns (themes) within data. It provides an accessible and flexible approach to qualitative analysis, suitable for researchers across various disciplines. We will outline how ATLAS.ti facilitates thematic analysis, from data preparation to the final reporting stages.
Challenges of data analysis without software
Analyzing qualitative data without the aid of software presents several significant challenges that can impede the research process. While traditional manual methods of data analysis have their place, the scale and complexity of contemporary qualitative research often exceed what is manageable without technological assistance.
This section examines three key challenges faced by researchers conducting data analysis without the support of qualitative data analysis software: data organization difficulties, time-consuming analysis processes, and limitations in data visualization and interpretation.

Data organization difficulties
Organizing large volumes of unstructured data is a daunting task without the aid of software. Researchers must manually sort through physical or digital documents, notes, transcripts and even audio and video files, a process that is not only time-consuming but also prone to errors. Without the organizational structure that software provides, it can be difficult to maintain a clear overview of the data, leading to potential oversight of critical data segments and inconsistencies in data handling.

Time-consuming analysis processes
Manual analysis of qualitative data is inherently time-consuming. The process of manually coding data, identifying themes, and establishing relationships between codes requires extensive effort and attention to detail. The absence of software tools to streamline these processes means that researchers spend a significant amount of time on tasks that could be automated or facilitated by software, potentially prolonging the overall research timeline.
Limitations in data visualization and interpretation
Without the advanced visualization tools offered by qualitative data analysis software, researchers are limited in their ability to illustrate the relationships between themes and codes effectively. Manual methods for creating visual representations are not only labor-intensive but also may not capture the complexity of the data as effectively. This limitation can impede the interpretation of the data, as visualizations play a crucial role in identifying patterns and conveying findings in a digestible format.
How does qualitative data analysis software help researchers?
Qualitative data analysis software helps researchers manage and interpret the complexity of qualitative data. Through features designed to enhance organization, analysis, and representation of data, these tools assist in uncovering deeper insights from textual, audio, and visual data sources.
This section outlines three key ways in which qualitative data analysis software supports research efforts: enhancing data organization, streamlining analysis processes, and enabling effective data visualization.

Enhancing data organization
One of the primary challenges in qualitative research is managing vast amounts of unstructured data, which may include interview transcripts, observational field notes, customer feedback survey responses, and multimedia files. Qualitative data analysis software addresses this challenge by providing robust data management features. Researchers can import data in various formats, organize it into categories, and use coding to tag specific segments with discrete labels. This organizational structure makes it easier to retrieve and review data, ensuring that researchers can maintain focus on their analysis without getting lost in the data.
Streamlining analysis processes
The core of qualitative analysis involves coding data to identify themes, patterns, and relationships. Qualitative data analysis software simplifies this process through the use of intuitive coding tools that allow for both deductive and inductive approaches. Researchers can apply codes to data segments, refine these codes into more nuanced sub-codes, and merge or split codes as their understanding of the data evolves. The software's search and query functions enable researchers to easily navigate through coded data, examine the prevalence of codes, and explore relationships between them. This streamlines the analysis process, making it more efficient and less prone to error.
Enabling effective data visualization
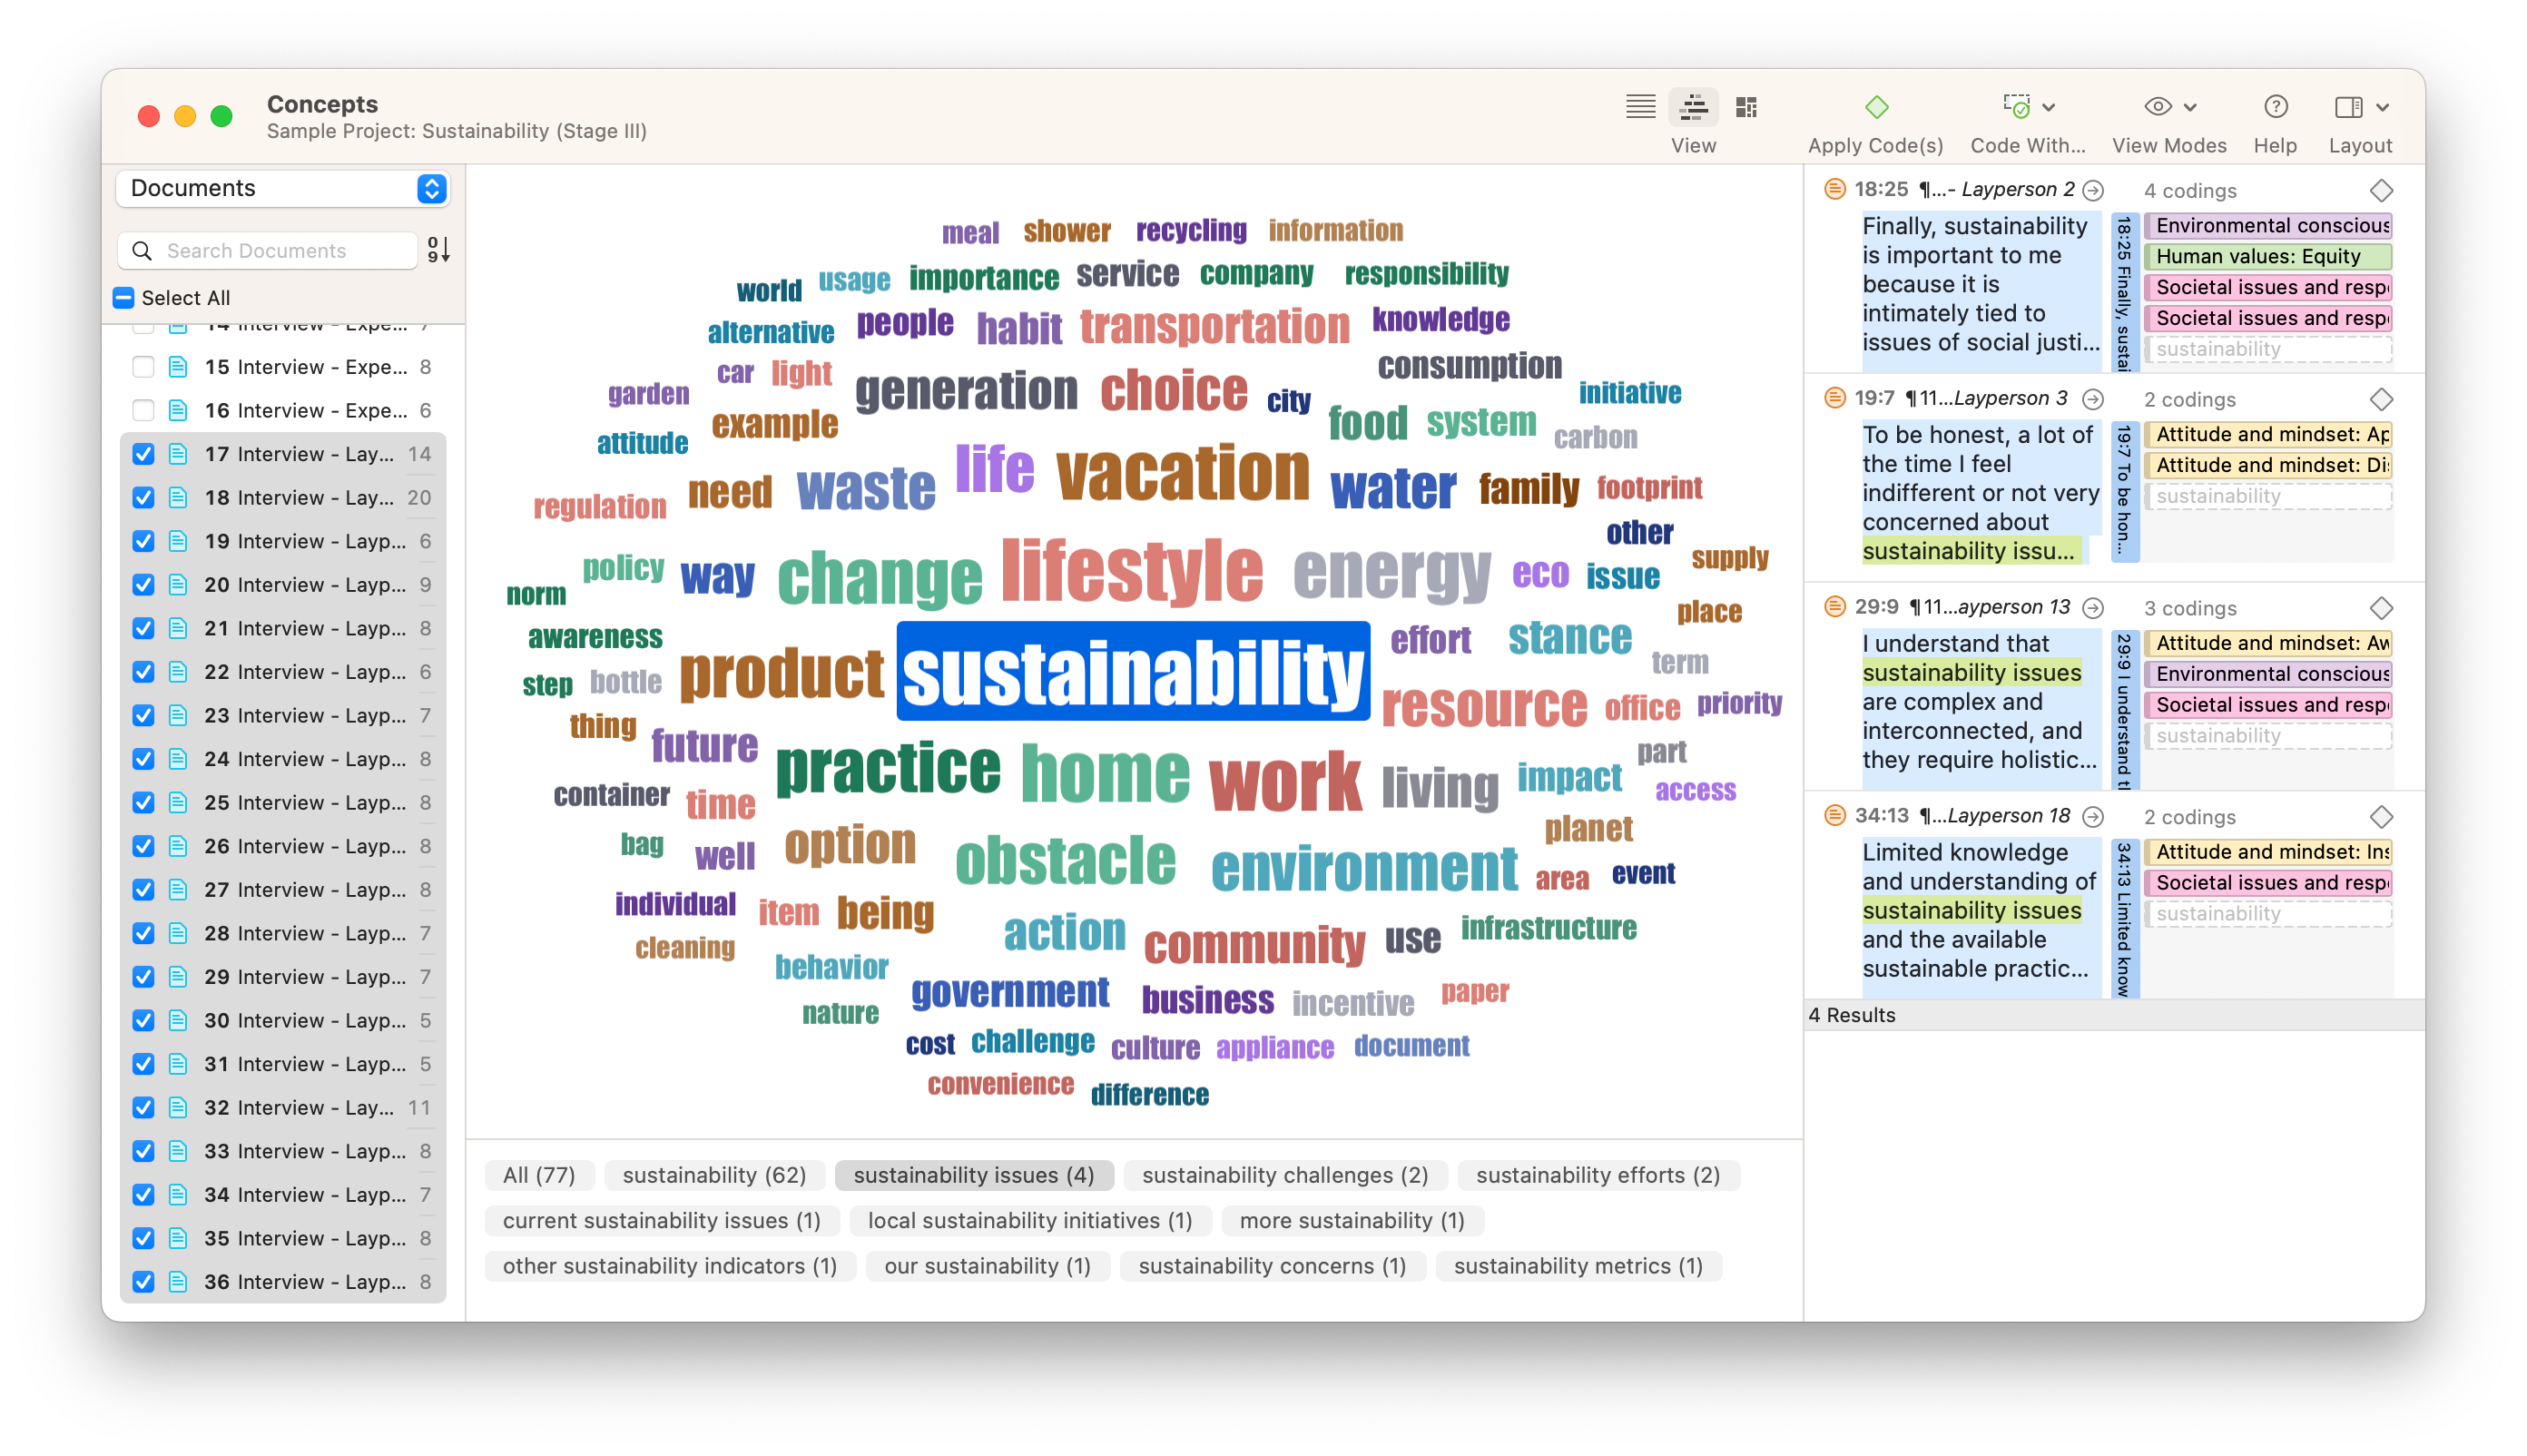
Visualizing the relationships between themes and codes is crucial for interpreting qualitative data and communicating findings. Qualitative data analysis software comes equipped with a variety of visualization tools, such as code clouds, code-relations browsers, and network views, which illustrate the connections between data segments and themes. These visualizations assist researchers in identifying patterns and outliers, facilitating a deeper understanding of the data. Additionally, the ability to generate visual representations of the analysis process and outcomes supports the presentation of findings, making complex data more accessible to audiences.
Using software for thematic analysis
Using qualitative data analysis software for thematic analysis offers a structured approach to identifying, analyzing, and reporting themes within data. Thematic analysis, as a method, benefits significantly from the functionalities offered by these software packages, facilitating a more efficient and comprehensive analysis.
This section focuses on the practical steps involved in conducting thematic analysis using ATLAS.ti, highlighting three key stages: preparing the data, coding for themes, and reviewing and defining themes.
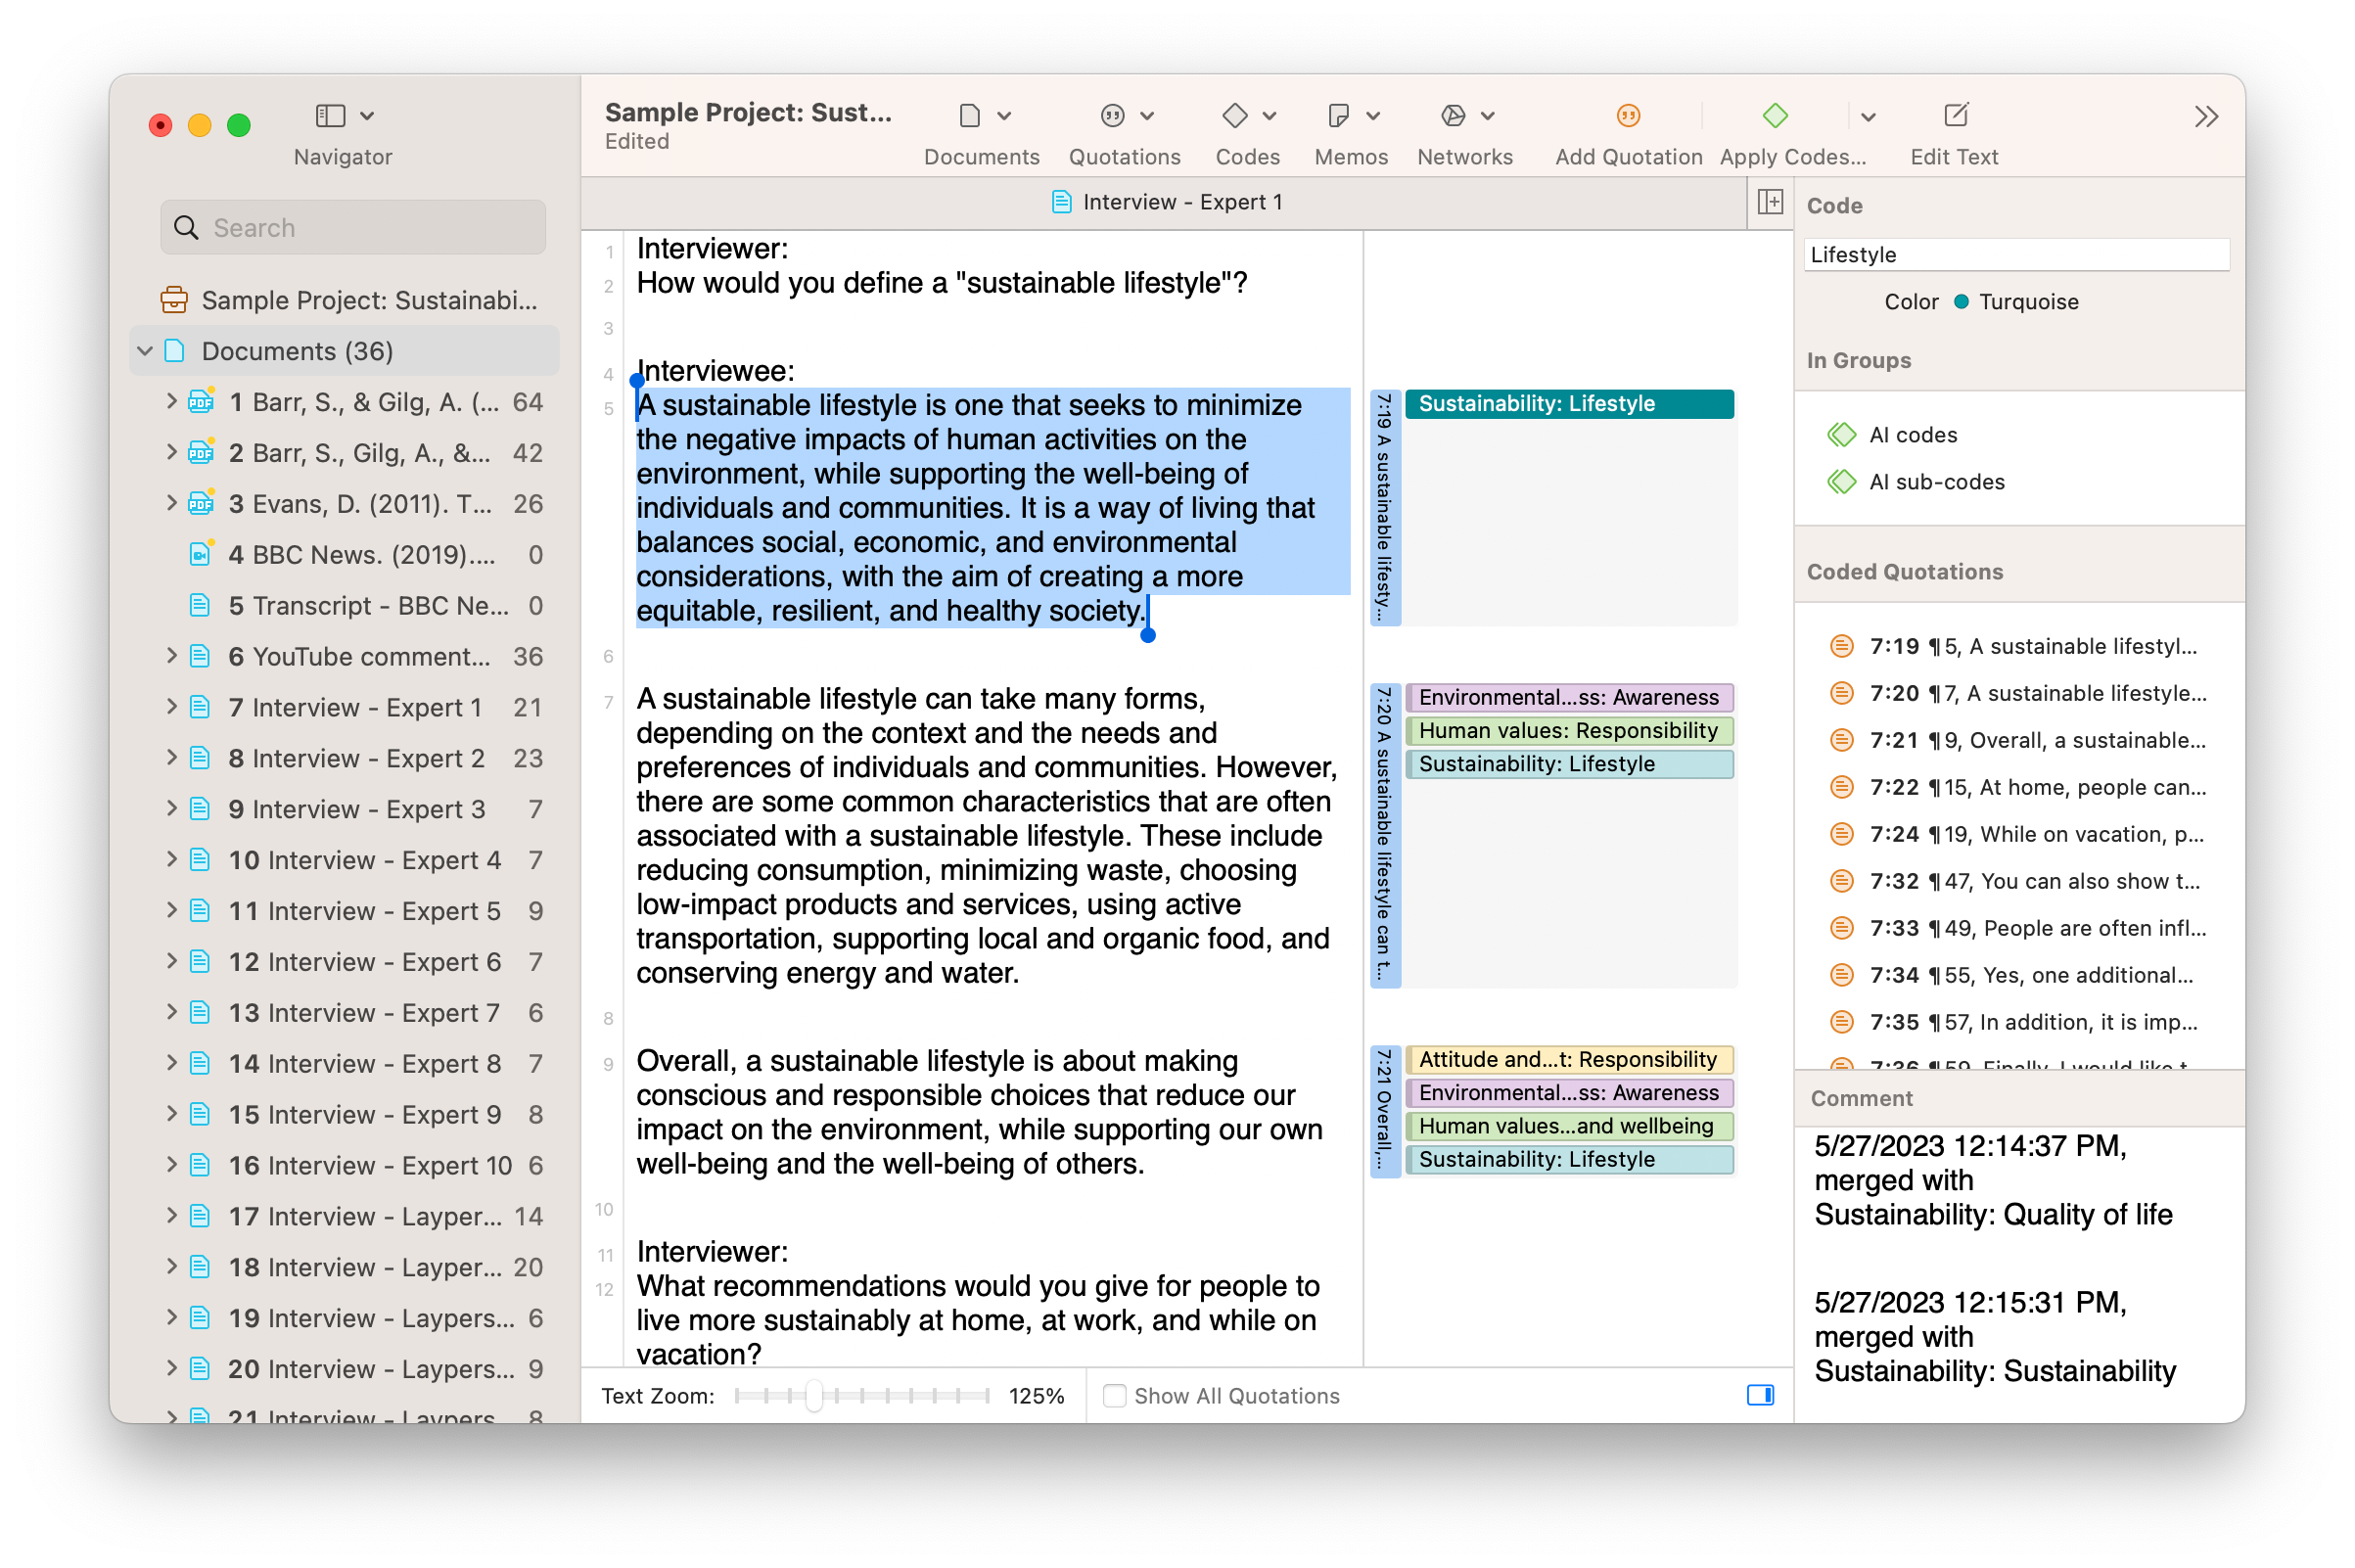
Preparing the data
The first step in thematic analysis using software is to prepare the data for analysis. This involves importing the data into the software, whether it's textual data from interviews or focus groups, or visual data from observations. The software allows researchers to organize data into manageable groups or cases, making it easier to navigate through the data during the analysis. Additionally, initial familiarization with the data is critical at this stage, involving reading through the data to gain an initial understanding and starting to identify potential patterns, which can be jotted down in memos.
Coding for themes
After preparing and familiarizing themselves with the data, researchers move on to the coding process. Coding in the context of thematic analysis with qualitative data analysis software involves highlighting segments of data that represent interesting features or potential themes and assigning codes to these segments. These codes can be descriptive, analytical, or a combination of both, depending on the approach of the researcher. The software's coding tools allow for the easy categorization and re-categorization of data segments, facilitating the iterative nature of thematic analysis. This stage is crucial for developing a comprehensive codebook that serves as the foundation for identifying themes.
Reviewing and defining themes
Once initial codes have been applied, the next step is to review these codes and the data segments they represent, grouping codes into potential themes. This involves a recursive process of reviewing coded data, considering the relationships between codes, and collating codes into overarching themes that capture the essence of the data. Qualitative data analysis software supports this process by enabling researchers to visually map out the relationships between codes and to merge, split, or redefine codes as necessary. The final task in this stage is to define and name the themes, ensuring they accurately represent the data. This involves a careful consideration of each theme's essence and how it contributes to the overall narrative of the research findings.
Using ATLAS.ti as thematic analysis software
Different packages of thematic analysis software work similarly, but using ATLAS.ti for thematic analysis offers a robust framework for conducting detailed and comprehensive qualitative research. ATLAS.ti provides a suite of tools specifically designed to support researchers through the various stages of thematic analysis, from data preparation to the final presentation of themes.
This section will cover the practical application of ATLAS.ti in thematic analysis, highlighting key functionalities and how they facilitate each step of the process.
Importing and organizing data
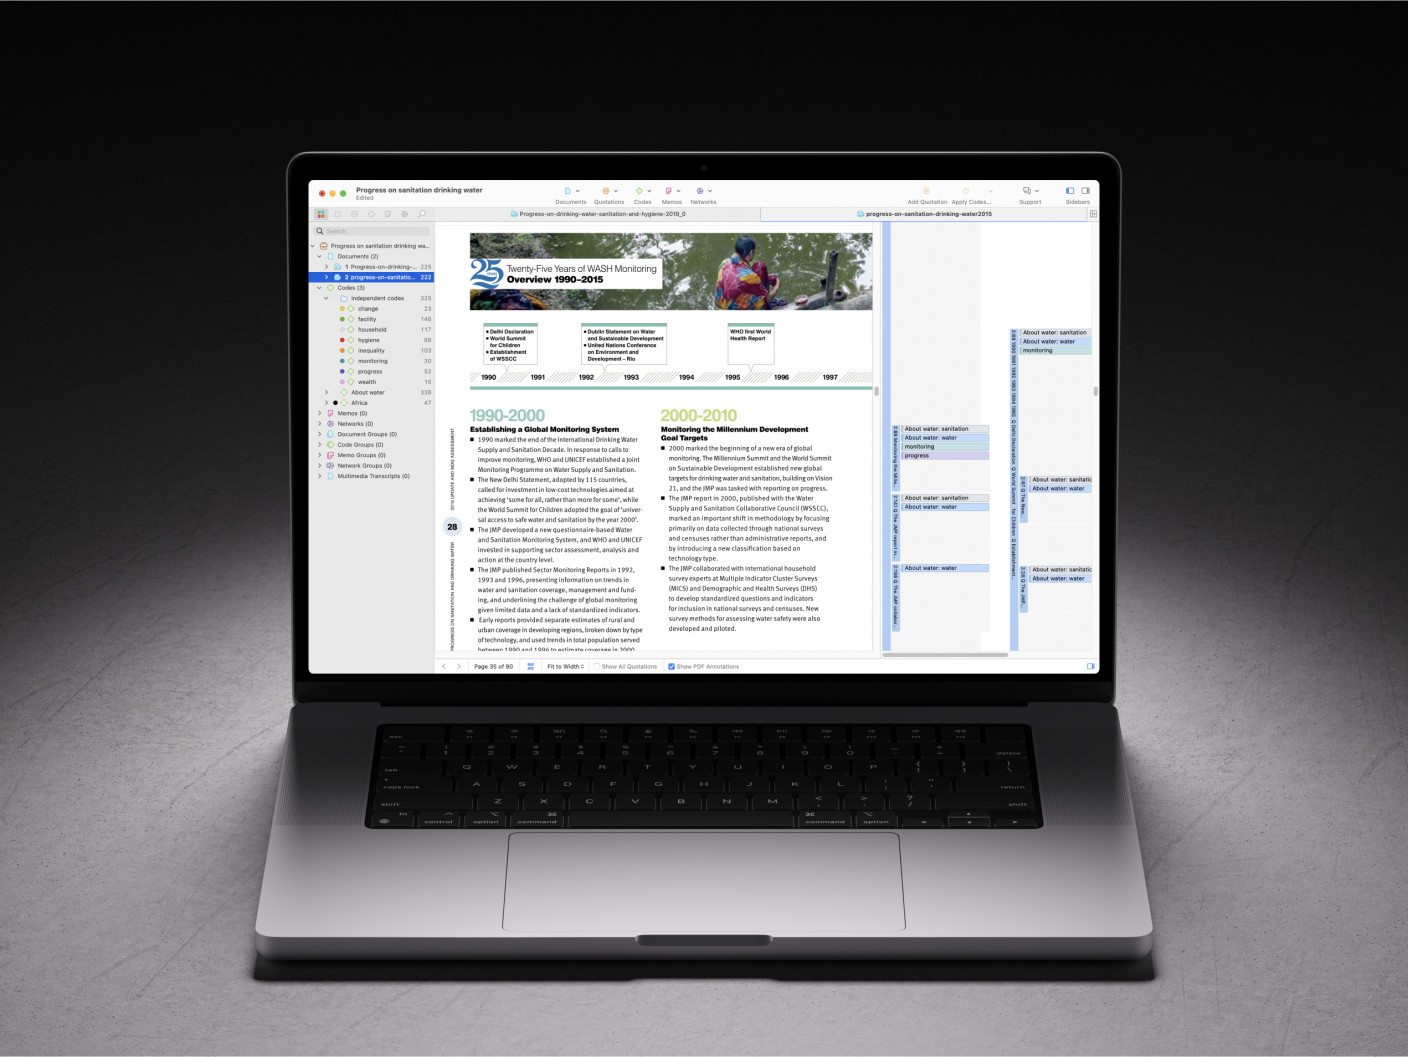
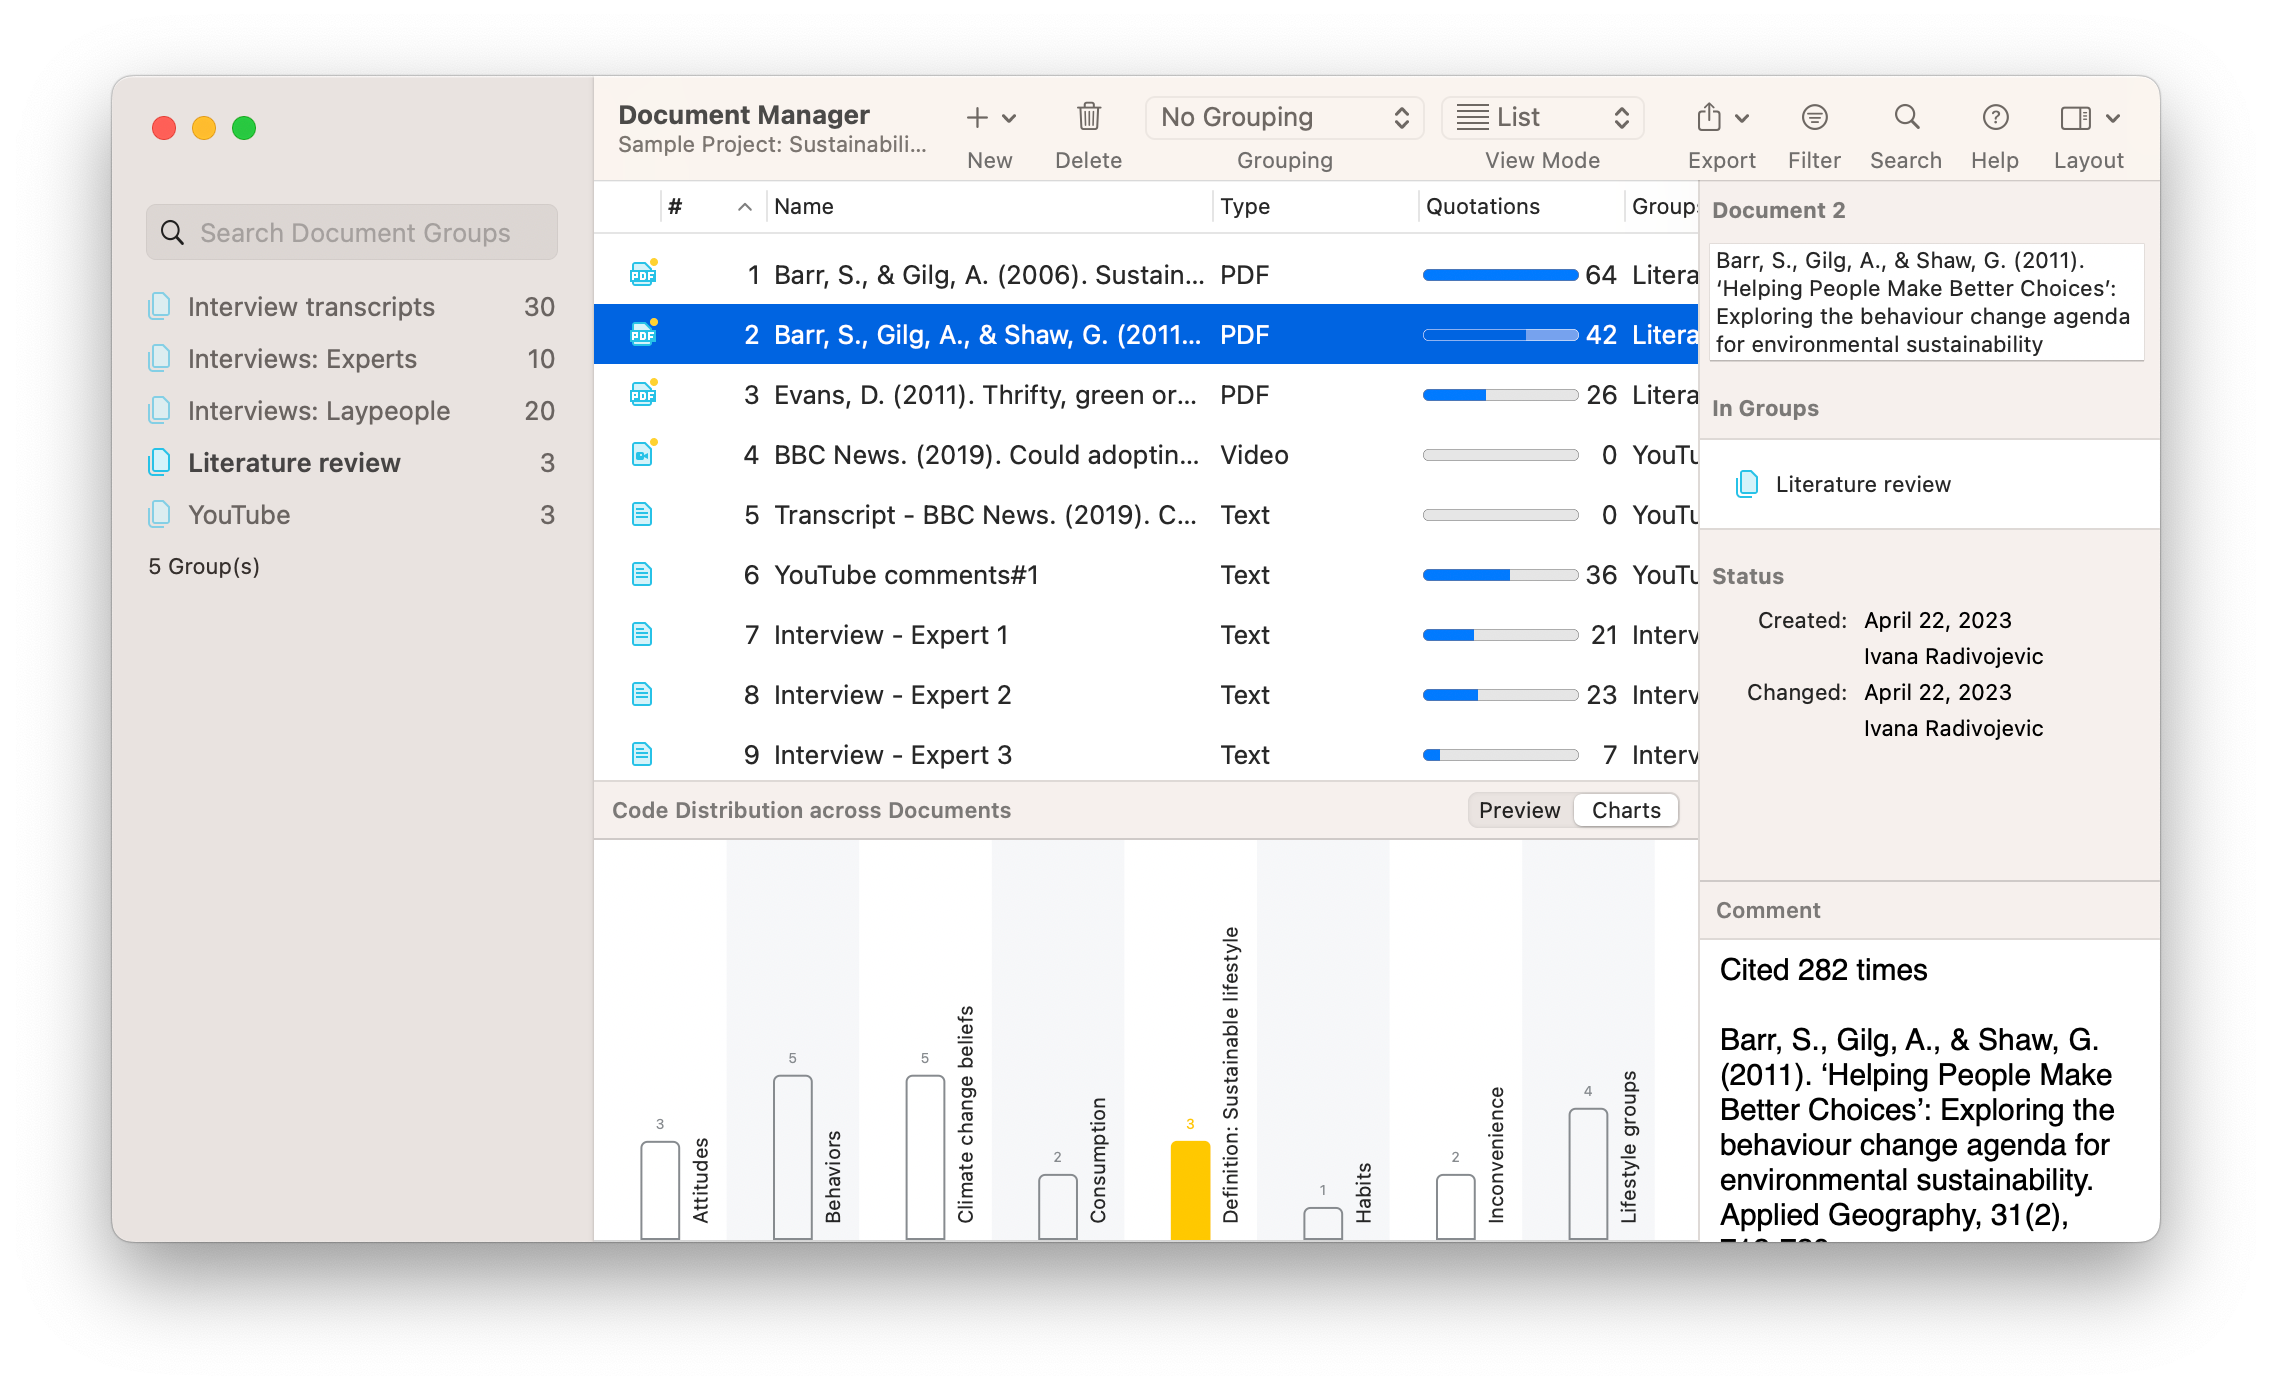
The first step in utilizing ATLAS.ti for thematic analysis is importing and organizing your data within the software. ATLAS.ti accommodates a wide range of data types, including textual documents, audio files, videos, geographic data, social media comments, and images. Once imported, data can be organized into groups based on criteria such as source type or participant demographics, making it easier to manage and navigate through the data. This initial organization lays the groundwork for an efficient analysis process.
Familiarization and initial coding
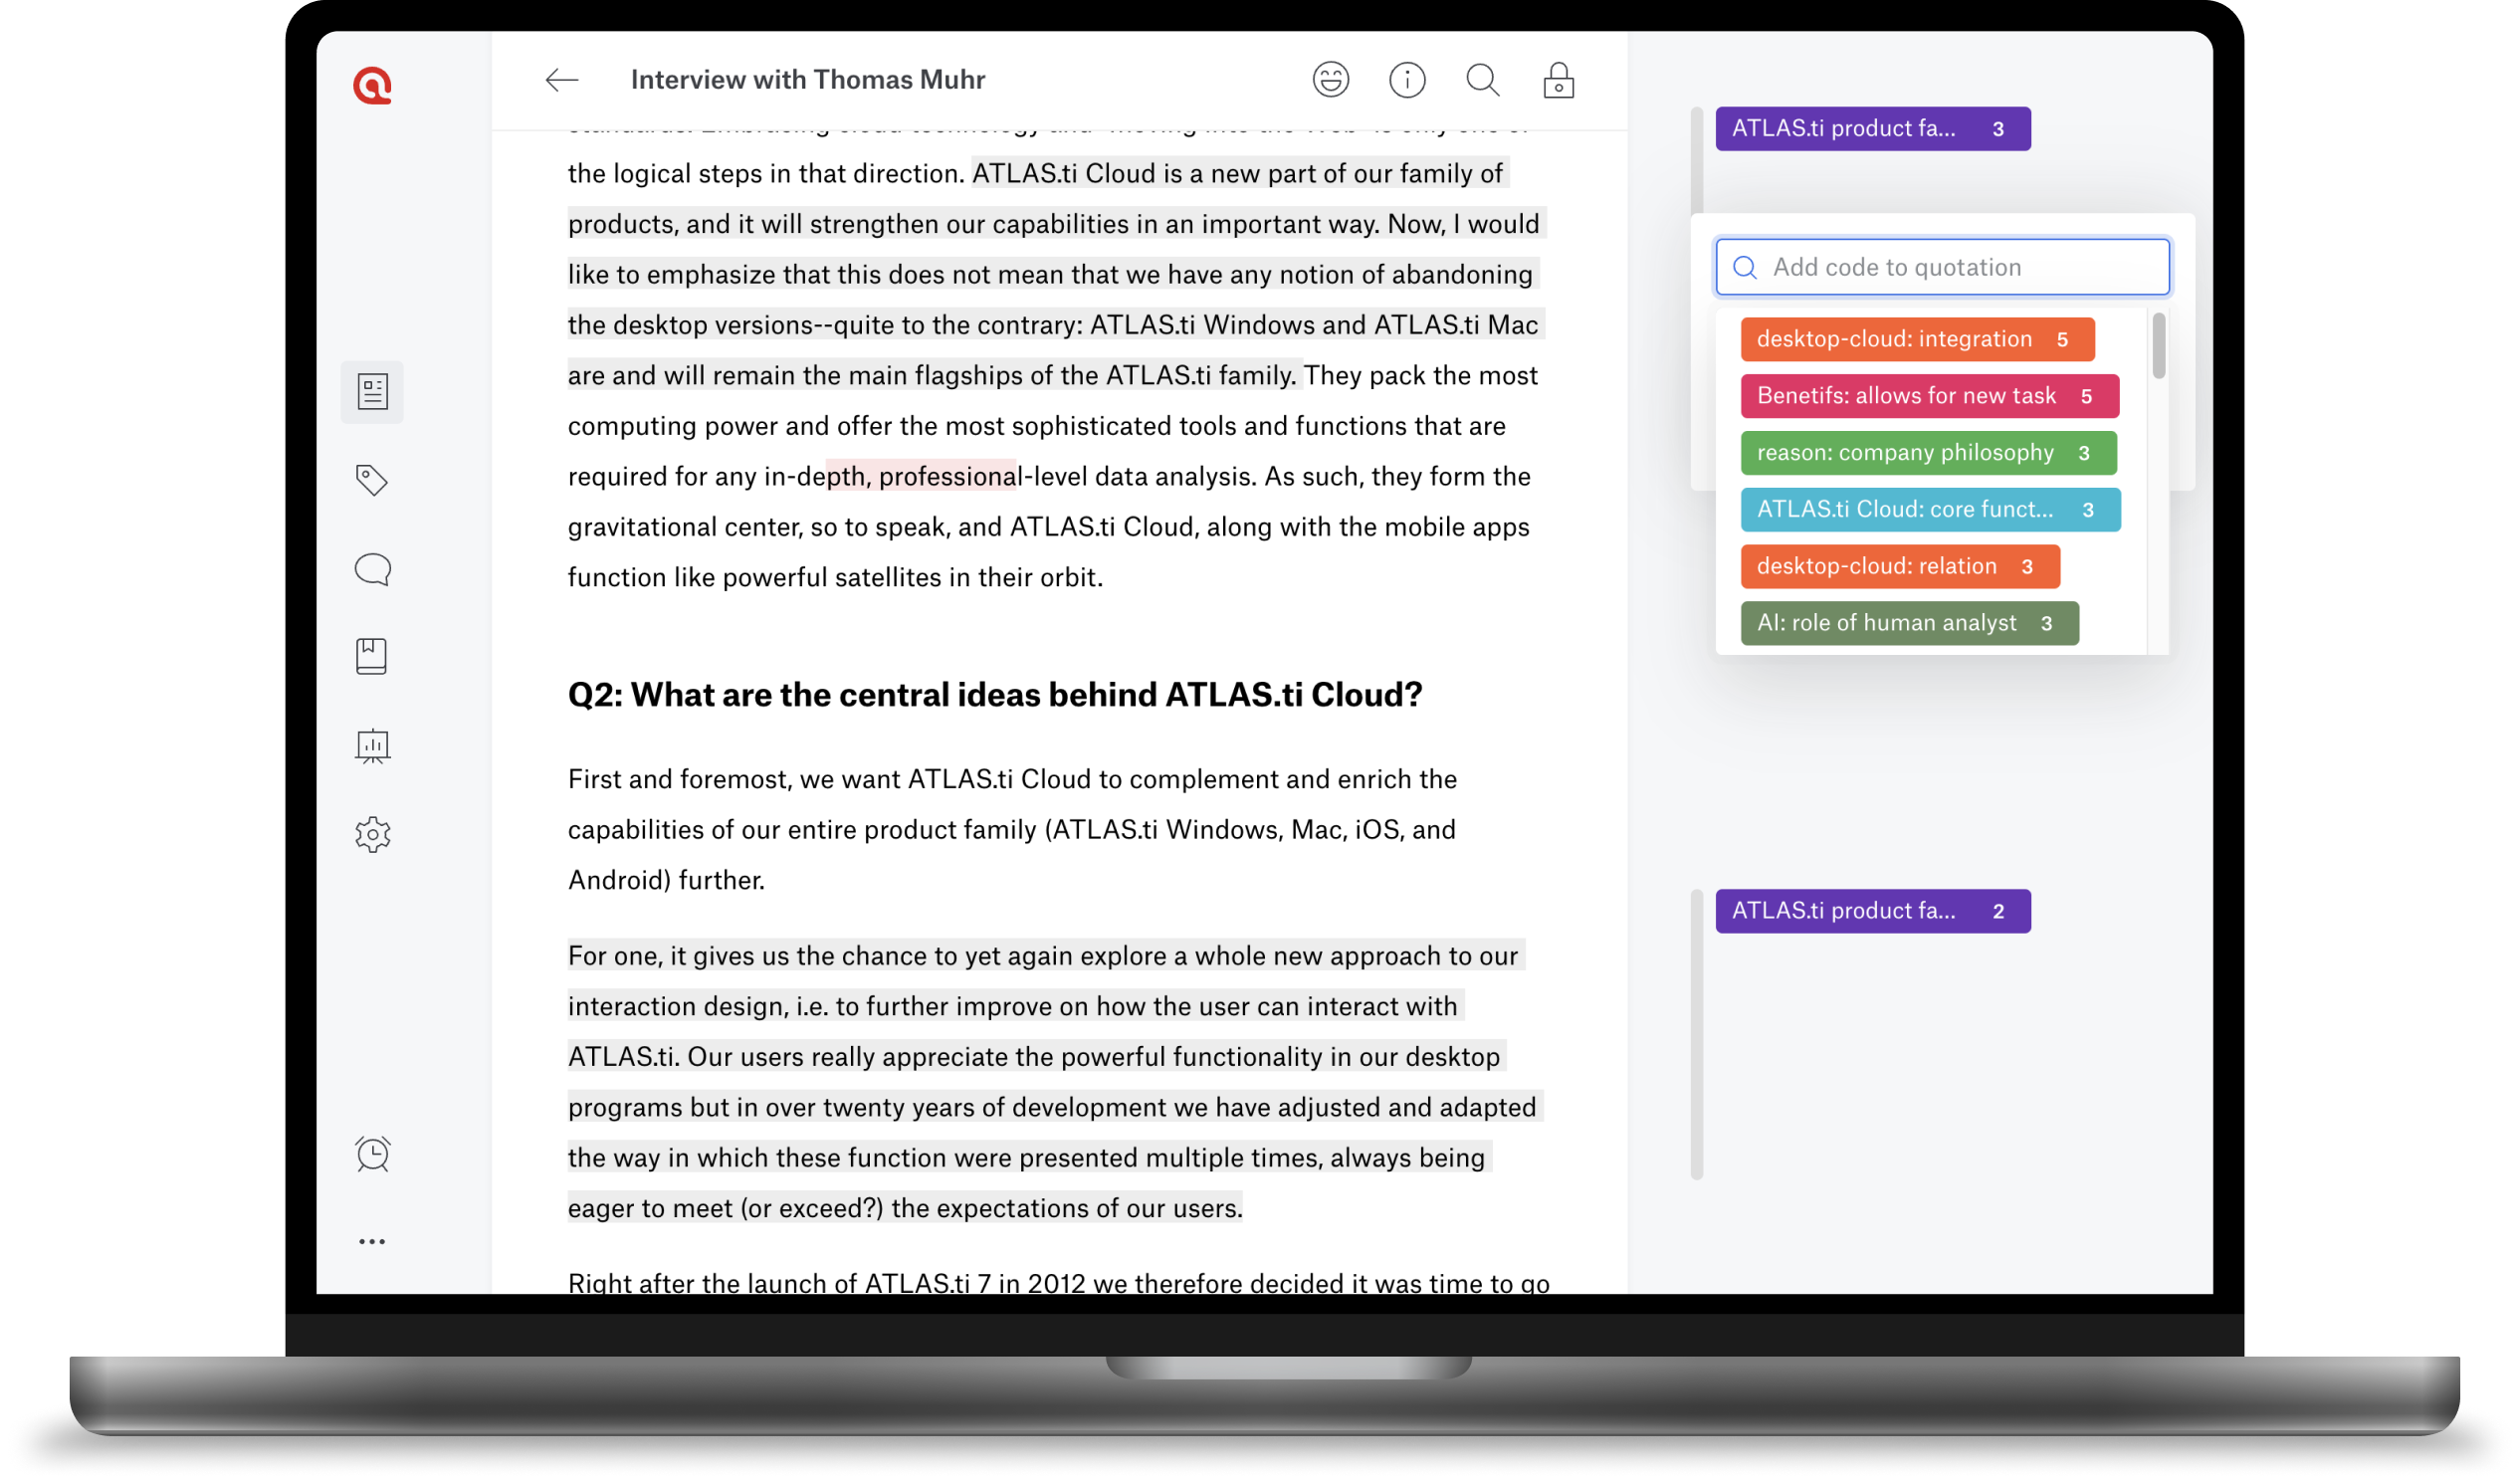
Familiarization with the data is critical in thematic analysis. ATLAS.ti provides features for annotating and making memos on data segments, allowing researchers to note initial observations and insights. This phase is also supported by the software's ability to facilitate manual and AI-driven coding of the data. Researchers can begin to tag data segments with codes reflecting potential themes or patterns, using ATLAS.ti's intuitive coding interface. This step is foundational for developing a deeper understanding of the data.
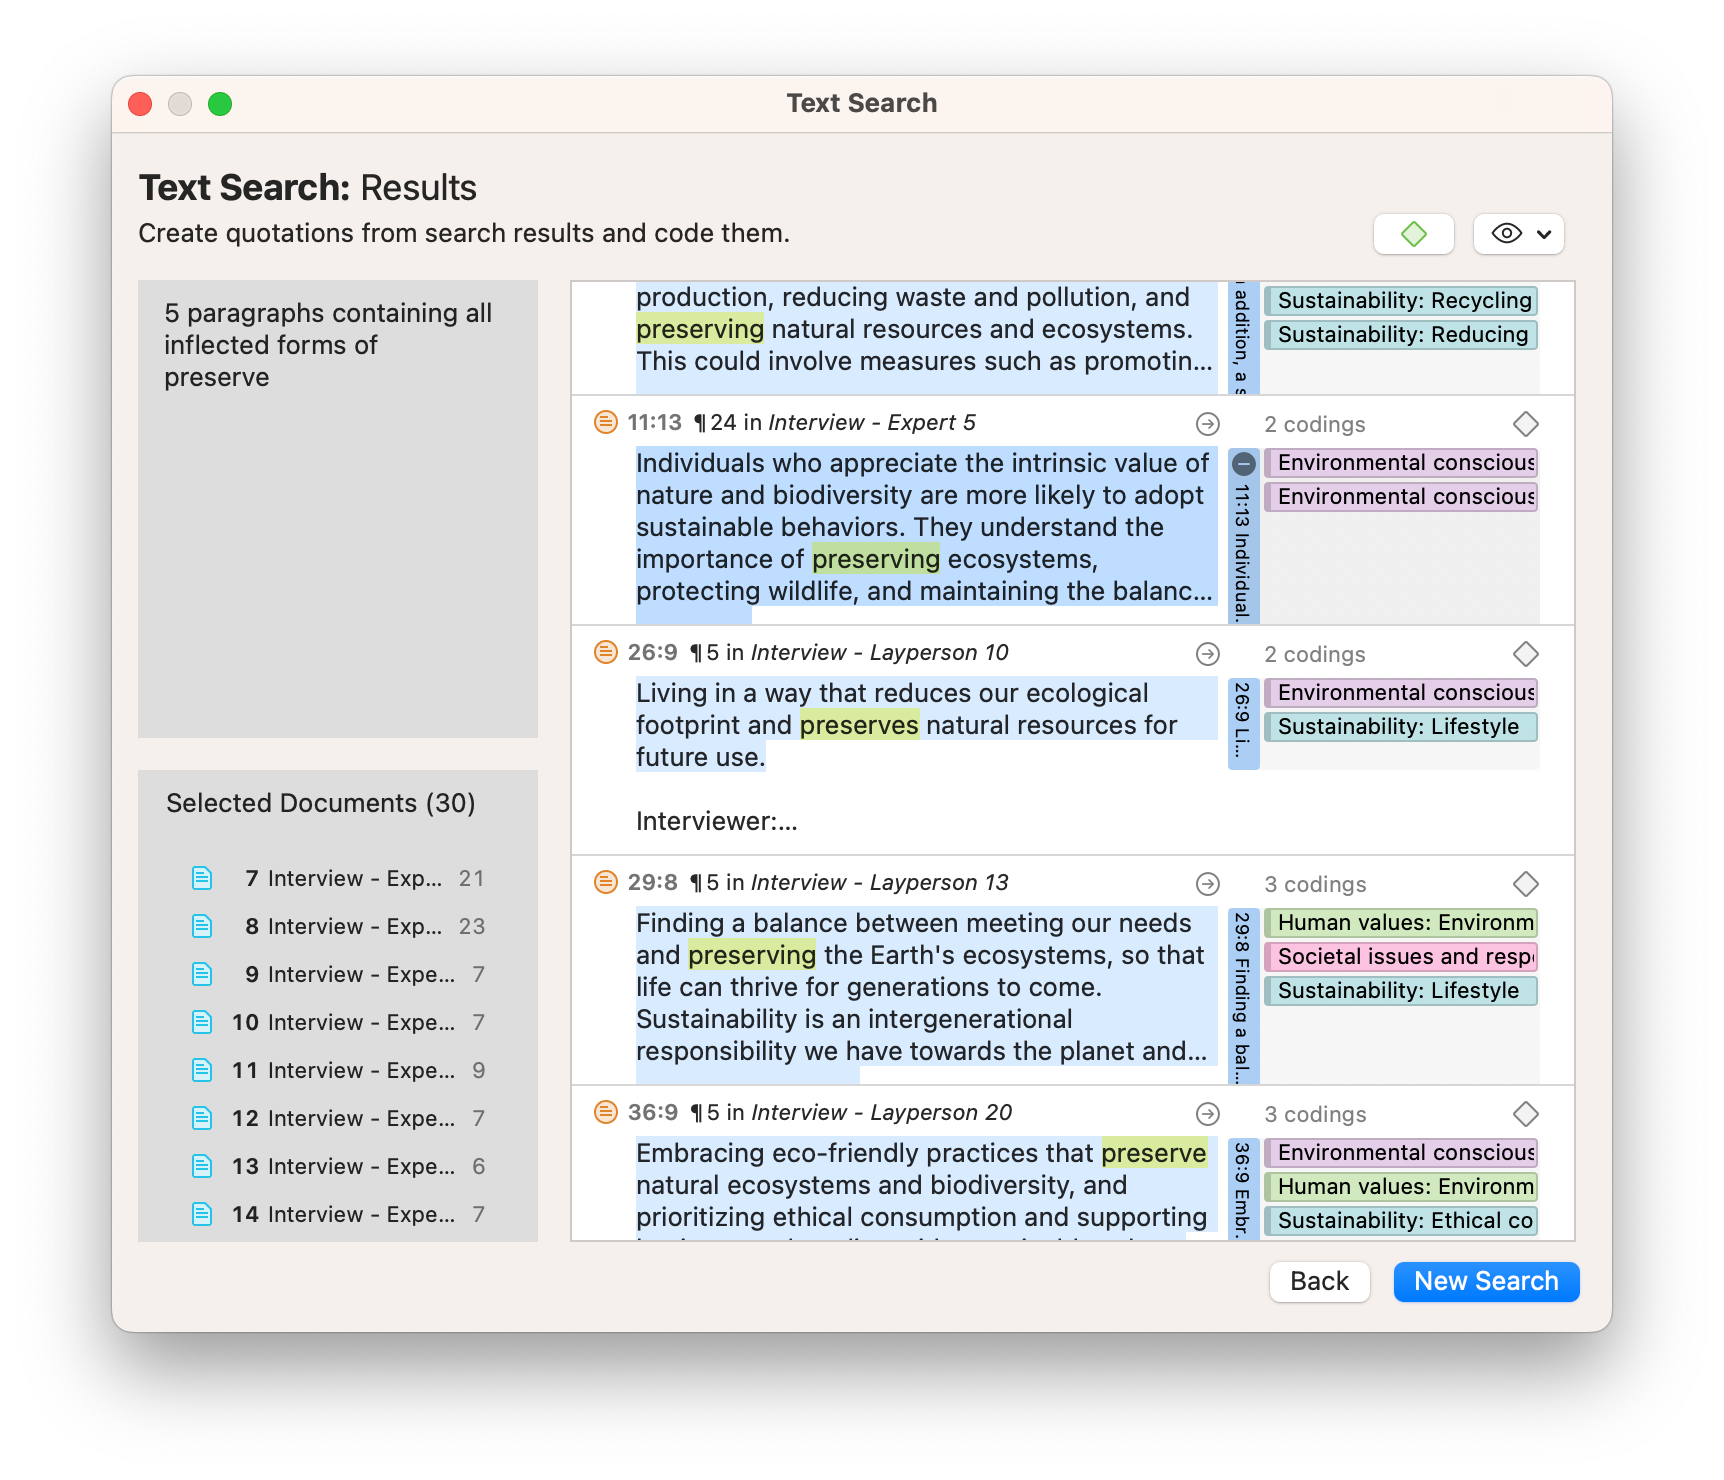
Refining codes and identifying themes
As analysis progresses, ATLAS.ti aids in refining codes and categorizing them into potential themes. The software offers tools for merging similar codes, modifying code definitions, and organizing codes hierarchically. This refinement process is crucial for condensing initial codes into broader themes that capture the essence of the data. Features in ATLAS.ti like the Query Tool and global filters allow researchers to examine the relationships between codes, facilitating the identification of emerging themes.
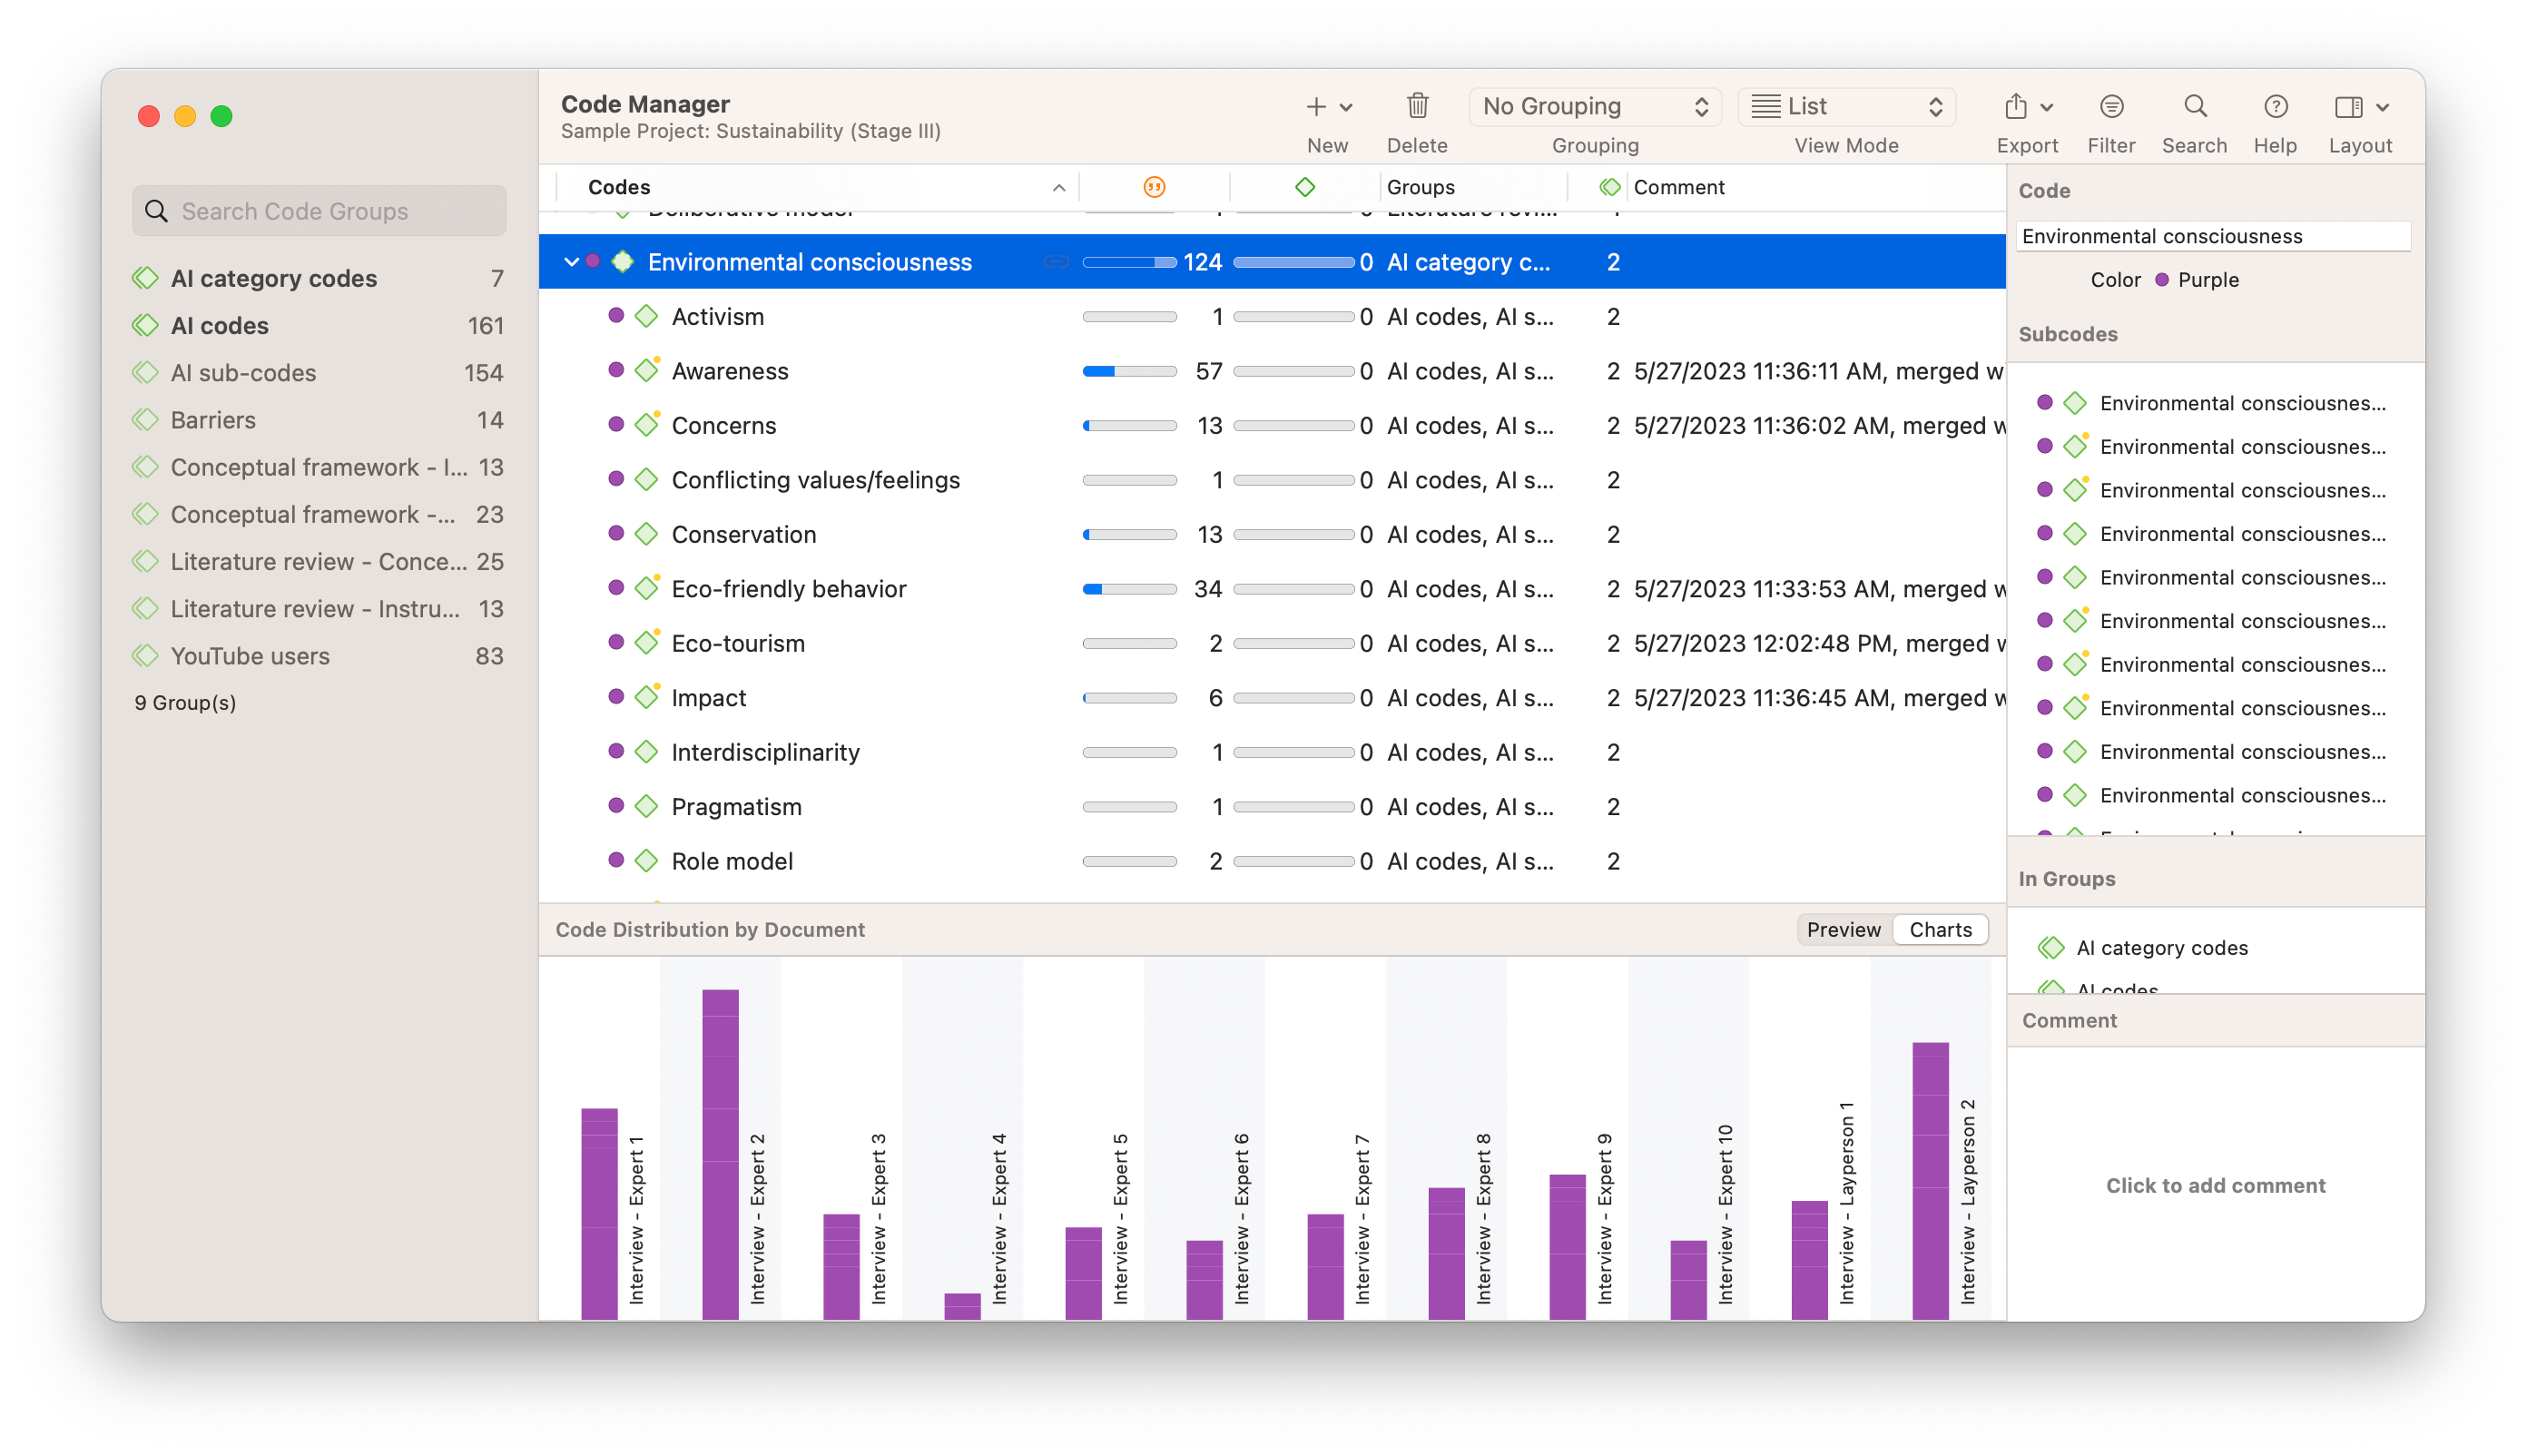
Visualizing connections and reporting findings
One of ATLAS.ti's strengths is its advanced data visualization capabilities. Researchers can use tools like the Network View or Code Co-Occurrence Analysis to create visual representations of the relationships between codes and themes. These visualizations provide a clear, graphical representation of how themes are interconnected, aiding in the analysis and interpretation of the data. Additionally, ATLAS.ti supports the creation of diverse reports and exports, such as Sankey diagrams, force-directed graphs, clouds, networks, and more. These customizable report and export options enable researchers to present their findings effectively or to convert qualitative data into quantitative data. The software's reporting features ensure that the thematic analysis process is not only thorough but also transparent and credible.