


- Handling qualitative data
- Transcripts
- Field notes
- Memos
- Survey data and responses
- Visual and audio data
- Data organization
- Data coding
- Coding frame
- Auto and smart coding
- Organizing codes
- Qualitative data analysis
- Content analysis
- Thematic analysis
- Narrative research
- Phenomenological research
- Discourse analysis
- Grounded theory
- Deductive reasoning
- Inductive reasoning
- Inductive vs. deductive reasoning
- Qualitative data interpretation
- Qualitative data analysis software
- How to cite "The Ultimate Guide to Qualitative Research - Part 2"
- Thematic analysis vs. content analysis
Images, audio, and video in qualitative research
If you think about qualitative and social science research, you probably have text data in mind. As research projects have evolved, however, researchers have found a need to conduct analysis on video data, audio files, images, and so much more.
Let's look at how video, images, and audio are used in qualitative data analysis in this section.
Non-textual data in qualitative research
In qualitative data analysis, there has traditionally been a strong focus on text such as interviews, focus groups, documents, and diaries. However, the role of non-textual data - specifically images, audio, and video - is increasingly being recognized for its ability to offer rich, complex, and nuanced insights that complement and extend our understanding derived from textual data. Non-textual data provide a unique vantage point from which researchers can look deeper into participants' lived experiences, cultural practices, social interactions, and personal narratives.
Understanding lived experiences
One of the key strengths of non-textual data is the capacity to capture the richness and complexity of lived experiences. Videos can record participant actions and interactions in their natural settings, providing an unfiltered lens into their world. Images, whether photographs or drawings, can encapsulate emotions, cultural nuances, and personal meanings that may be difficult to articulate in words. Audio recordings, with their attention to voice inflections, pauses, and tonality, can reveal underlying feelings or attitudes that textual data might miss. These forms of data capture the world as directly experienced by the participants, providing the researcher with a more comprehensive understanding of their perspectives.
Non-verbal and contextual data
Non-textual data can also capture non-verbal and contextual information. For instance, video data can record body language, facial expressions, gestures, and spatial arrangements, offering additional layers of meaning. Image data can represent complex ideas, connections, or feelings in a condensed and immediate way that text cannot always achieve. Audio data can reveal elements such as tone, pitch, volume, rhythm, or silences, adding depth to our understanding of verbal communication. This non-verbal and contextual information often provides insights into social dynamics, power relations, cultural practices, or personal experiences.
Participatory research
Non-textual data also open up new possibilities for participatory research. Participants can be involved in creating videos, images, or audio recordings, giving them greater control over what and how their experiences are represented. Techniques such as photovoice, video diaries, or audio elicitation engage participants creatively, potentially empowering them and facilitating deeper self-reflection. These methods can generate data that are personally meaningful to the participants and offer unique insights into their lived realities.
Reporting research findings
Lastly, non-textual data can enhance the communication of research findings. Videos, images, and audio clips can be incorporated into presentations, reports, or publications, making the findings more accessible, engaging, and impactful. They can help to "show" rather than "tell", allowing audiences to see, hear, and feel the research context and participants' experiences. This can be particularly effective in conveying complex or emotive issues, fostering empathy, and facilitating dialogue.
With all of this in mind, let's look at the various forms of non-textual data that a qualitative researcher will likely encounter.
Video data
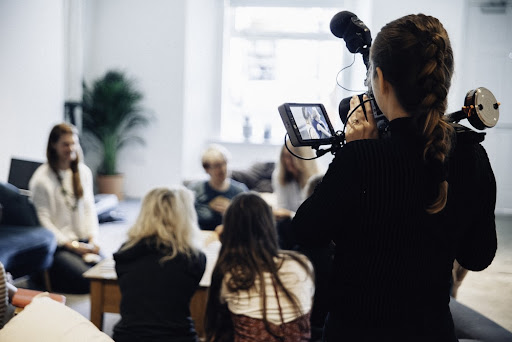
Gestures, body language, and facial expressions are important components of analysis of social interaction. Observing everyday movements in public places requires an understanding of spatial relations between objects and people. Joint social action in cultural rituals like religious ceremonies and ballet performances have considerations of temporality as interactants move in tandem with each other. These examples and more illustrate the collection and presentation of video data in research.
How are videos used in qualitative research?
If you are using videos in a research project gathering data from interviews or focus groups, you may be recording these interactions to get perspectives from your research participants. In most cases, simply transcribing the utterances in videos into text form is sufficient for data analysis.
However, you may also be interested in recording how people interact with each other. Their gestures, facial expressions, body posture, proximity to others, and a whole host of other factors can be visually analyzed through video analysis.
An example of this kind of research involving the study of video data includes the analysis of user-generated content on platforms like YouTube and Vimeo to understand how creators try to get their message across to their audience. Analysis of online video recordings can contrast with the analysis of television programs to provide a sense of how the development of presentation practices has evolved from medium to medium.
In other contexts, video content analysis in health care situations can look at not only the messages that doctors convey to patients and colleagues but also how they stand and act in relation to those around them. Perhaps they adopt a caring touch, which might be represented by standing in closer proximity to patients who require emotional support. In contrast, they might be more standoffish with nurses and other doctors by standing far apart or standing while others are sitting in meetings or casual conversations.
These sorts of examples highlight the limitations of a purely text-based approach to qualitative data analysis. As such, analyzing video and presenting the right video segment when sharing novel theory can be important skills in social science research.
What is video data analysis?
Researchers engage in the systematic examination and interpretation of video recordings to generate insights and understand phenomena under investigation. Video data analysis is a valuable method for capturing and analyzing rich, complex data that goes beyond what can be obtained through exclusively text-based research methods.
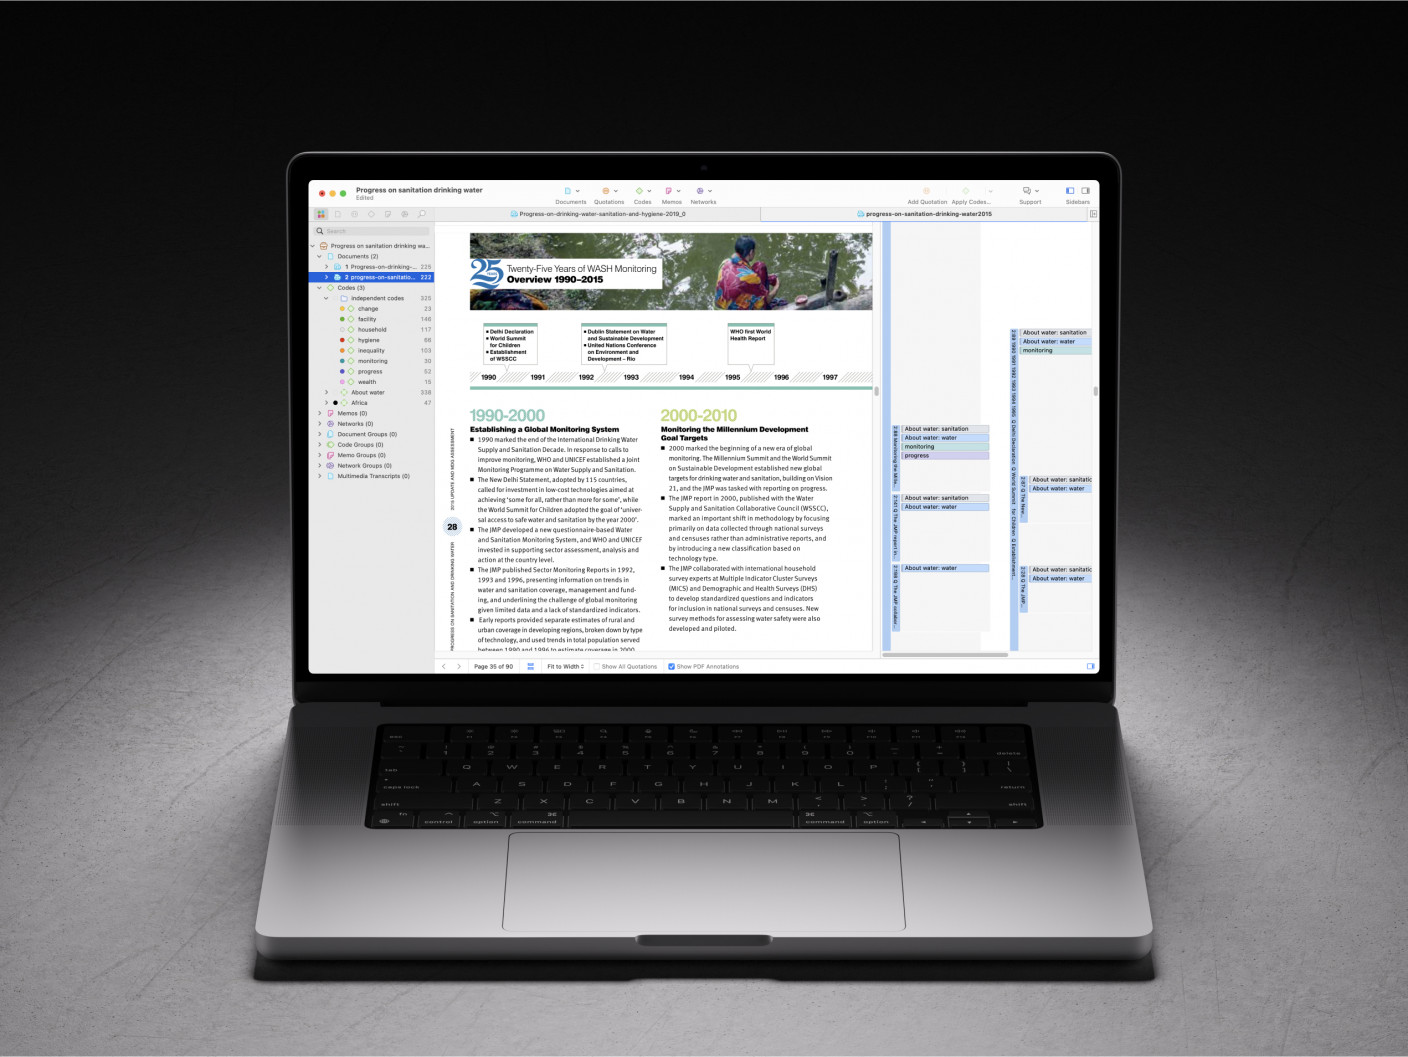
Video data is typically transcribed into text format to facilitate analysis. However, transcripts do not merely record the words uttered between speakers in a video. Transcription also involves creating a written record of the non-verbal aspects of the video, including gestures, facial expressions, and environmental cues. This more inclusive approach to transcription allows for easier coding and analysis of the data. On the other hand, qualitative data analysis software such as ATLAS.ti also makes it convenient to code video data directly, permitting a more nuanced examination of your data.
Researchers then organize the video or text data into manageable units such as video segments, episodes, or events. These units are often defined based on the research questions, objectives, or relevant themes emerging from the data. For example, suppose the research project deals with identifying the basic facial expressions in a given situation. In that case, the unit of analysis may be reduced to mere moments in interaction represented by segments of video data. On the other hand, if a researcher is looking at how people's facial expressions change over time, the video data analysis may look at larger episodes of interaction (e.g., a single interview or an entire classroom observation).
The researcher then tags or labels segments of the video or text data with descriptive or interpretive labels called codes. Researchers identify patterns, themes, or categories in the data and assign appropriate codes to capture the meaning or significance of those segments. Using qualitative data analysis software, coding can be done manually or, in the case of ATLAS.ti, with the use of automated tools to identify useful segments of text data.
Once the data is sufficiently coded, researchers analyze the coded data to identify relationships, patterns, and themes within the video recordings. They explore the data to gain a deeper understanding of the research question or objective and draw meaningful conclusions. This analysis often involves iterative processes of comparing, contrasting, and refining codes and themes.
Images as qualitative data
In qualitative research, images can serve as a potent tool for understanding human experiences, behaviors, social dynamics, and cultural phenomena. They provide an alternative lens through which to view the world, offering a rich, nuanced perspective that textual data may sometimes fail to capture. The use of images in research can include photographs, drawings, diagrams, maps, or any other visual materials that can help researchers gain insight into their subject of interest.
Collecting images
Collecting image data involves either creating images as part of the research process or using pre-existing images. In the former approach, researchers or participants may take photographs, make drawings, or generate other visual materials during the study. This method can offer a particularly rich source of data because the act of creating an image can bring forth subconscious thoughts, emotions, and perspectives.
Pre-existing images, on the other hand, can include anything from historical photographs to social media images, advertisements, and artworks. The key here is to ensure that these images are relevant to the research question and can contribute meaningful insights.
While collecting image data, it's critical to maintain an ethical stance. If you're taking photographs or using others' images, consider privacy issues, obtain necessary permissions, and maintain the anonymity of individuals if required.
Image analysis
Analyzing images in qualitative research involves the careful examination and interpretation of visual data to discern patterns, themes, and meanings. Researchers generally employ a two-step process: description and interpretation.
In the description phase, researchers meticulously document the physical details of the image, such as its color, size, form, and the subjects or objects it contains. This stage is purely observational, with researchers providing a factual account of what is present in the image. These descriptive details can be jotted down in memos, and qualitative data analysis software such as ATLAS.ti makes it even easier to analyze images as the images can be viewed and any segment of the image can be selected and coded.
During the interpretation phase, researchers attempt to understand the meaning behind the visual elements in the image. They may analyze the relationship between different parts of the image, consider the use of symbols, study the context in which the image was created or is viewed, and reflect on their own responses to the image. Here, researchers often draw on existing theories or frameworks to guide their interpretation, which can be developed through memo-writing and coding.
Two common analytical frameworks used for images include semiotics, which looks at the signs and symbols within the image, and discourse analysis, which examines the image in the context of social and cultural narratives.
Considerations for image analysis
Incorporating images into qualitative research can have numerous benefits. They can provide a wealth of detail and convey aspects of reality that are difficult to capture in words alone, including emotions, moods, atmospheres, and tacit knowledge. Images can facilitate participants' expression and engagement, particularly when dealing with sensitive topics, complex concepts, or with populations who might struggle with verbal communication.
However, the use of images also presents several challenges. Analysis can be time-consuming and requires a certain level of expertise in visual literacy. The interpretation of images is inherently subjective, and images can sometimes be ambiguous or open to multiple interpretations. Moreover, cultural differences can impact how images are perceived and interpreted, which researchers must carefully consider in multicultural studies.
Audio data in qualitative research
How do varieties of a language sound different from each other? Do passengers on a train or an airplane respond differently when the announcement is spoken by a man or a woman? At what decibel level does random noise become a problem and disrupt people's work or conversations?
To answer these questions, audio data offer a unique and valuable source of information. Audio recordings provide access to elements such as tone, pace, volume, and pauses, which may be lost in written transcriptions. Audio data can come from interviews, focus groups, and naturalistic recordings. You can also take audio data from non-traditional data sources like voice notes, podcasts, music, and more. Let's look into the collection, analysis, and interpretation of audio data in qualitative research.

Audio data collection
Audio data are typically collected through recording devices or applications. Often, researchers record in-person or remote interviews and focus groups. However, audio data can also be collected by recording naturalistic settings, such as meetings, public spaces, or events, to understand social dynamics, communication patterns, or ambient soundscape. In certain research projects, participants may be invited to contribute audio diaries or voice notes, offering personal narratives and reflections in their own time and space.
Consideration of ethics and consent is essential in audio data collection. Participants must be fully informed about the recording process, how the data will be used, stored, and who will have access to it. In naturalistic recordings, additional consent may be required from all individuals present or the custodian of the space, depending on the context and local regulations.
Approaches to audio analysis
Unlike images or text, audio data are time-based and sequential, which poses unique challenges and opportunities for analysis. Researchers can choose between verbatim transcription, where the audio is converted into text for analysis, or direct analysis of the audio data, where the focus is more on the sonic and aural aspects.
In transcriptions, the audio data are transformed into text, which can then be coded and analyzed using traditional qualitative analysis methods. The transcription should be as detailed as possible, capturing not only what is said but also how it is said, including nuances such as hesitations, laughs, emphasis, or overlaps in conversation. However, transcription inevitably loses certain elements of the original audio, such as tone, accent, or background noises.
Direct analysis of audio data focuses on the auditory experience. Researchers listen for patterns in sounds, silences, tones, accents, pace, or rhythm. This type of analysis can be especially valuable in sociolinguistic studies, conversation analysis, or research focusing on soundscapes or musical elements.
Use of software tools
Various software tools can assist in the organization, transcription, and analysis of audio data. Transcription software, such as Express Scribe or Trint, can facilitate the conversion of speech into text. Qualitative data analysis software programs like ATLAS.ti can import and analyze audio files directly, allowing researchers to code and annotate within the audio file, thus preserving the sonic richness of the data.
Moreover, audio editing software, such as Audacity or Adobe Audition, can be useful for manipulating audio data, isolating specific sound elements, or analyzing sound waves. Sonographic representation can offer a visual dimension to the audio data, aiding in pattern recognition or comparative analysis.
Triangulation and validation
Just as with other types of data, triangulation can be employed to cross-check findings from audio data. For example, the results from audio analysis could be compared with text, visual, or observational data. It can also involve using different theoretical frameworks to interpret the data or having multiple researchers independently analyze the data.
Validation in audio analysis can be quite challenging due to the subjective nature of interpreting sounds and spoken language. Member checking or respondent validation, where the researcher's interpretation is verified with the participants, and peer debriefing can help to enhance the trustworthiness and credibility of the findings.