Social Media Research: Analysis of Social Media Data

- Introduction
- What type of research is social media research?
- What is qualitative data in social media?
- Why do we analyze social media data?
- ATLAS.ti for social media research
Introduction
Social media platforms such as Twitter, Instagram, and TikTok are great sources of data useful to social science researchers. As a result, social media data collection is a critical task for researchers, social media managers, social media marketers, and any other stakeholders who are looking to understand the dynamics of social media communication.

What type of research is social media research?
Think about how a social media marketer needs to stay on top of the latest trends and how people react to pop culture in order to effectively advertise a new product or service. By collecting social media data, researchers can gain valuable insights about the target audience.
In this sense, social media data is the foundation of analysis aimed at understanding behavior and interaction on any particular social media platform.

Social media research, often considered a subfield of digital ethnography, encompasses a broad range of methods and focuses primarily on understanding human behavior, interactions, and trends on various online platforms. This research type often intersects with multiple disciplines, ranging from sociology and anthropology to marketing and information science.
At its core, social media research is predominantly exploratory. Researchers are keen to unearth patterns, sentiments, and the underlying motivations of social media users. They observe the organic interactions of users, discussions in comment sections, the use of hashtags, and the sharing of multimedia content, among other possibilities.
By doing so, researchers seek to understand not just the content itself but also the socio-cultural context in which it is produced and consumed.
Approaches to social media data analysis
There are two primary approaches to consider:
- Quantitative: This involves the analysis of large datasets, such as the number of likes, shares, or retweets, to discern patterns and trends. With the help of data analytics tools, researchers can gain insights into overall user engagement, the popularity of specific content, and even the best times to post for maximum engagement.
- Qualitative: In contrast to quantitative research, qualitative research focuses on the content and context of social media posts. Researchers might study narratives, the choice of emojis, or the tone of comments to comprehend the deeper sentiments and emotions users express. This approach is more interpretive and aims to understand the "why" and "how" behind user behaviors.
Regardless of the approach, social media research is a multi-faceted domain that taps into various methodologies to explore the intricate web of human interactions and behaviors on digital platforms.
Whether it's a brand trying to understand its audience better or a sociologist attempting to decode digital age dynamics, social media research provides the tools and insights necessary to examine perspectives and communication in online media.

What is qualitative data in social media?
What qualitative data looks like can differ by the various social media networks. Think about all the potential differences and audiences that exist across the following social networks:
- YouTube
Qualitative data in social media provides a deep and nuanced understanding of users' behaviors, emotions, and interactions. Unlike quantitative data, which often deals with numbers and measurable patterns, qualitative data focuses on the content and context of online discourse, aiming to grasp the subtleties of human experience.
This type of data offers rich insights into the intricacies of social media usage, capturing the essence of how users express themselves and engage with content. Two prominent aspects of qualitative data in social media are the analysis of content and the interpretation of analytics.
Analyzing content
Content analysis dives into the depth of posts, comments, hashtags, images, and videos. When researchers aggregate data from these sources, they can identify themes, sentiments, and narratives that emerge from the discourse in social media efforts. For instance:
- Posts and comments: The language used, tone, and choice of words can reveal a lot about a user's perspective, feelings, and beliefs.
- Hashtags: These offer insight into trending topics, user campaigns, or shared sentiments across large user groups.
- Multimedia content: Images, videos, and memes can be analyzed for symbols, themes, and underlying messages that might not be explicitly stated in text.
Assessing analytics
While analytics typically lean towards quantitative measurements, there's a qualitative dimension to them too. For instance:
- Engagement metrics: Beyond numbers, the type and quality of engagement (like a thoughtful comment versus a simple emoji reaction) can shed light on the depth of users' connection with the content.
- Shares and reposts: Analyzing the narratives or comments users add on social media pages when sharing content can provide insights into their interpretations or feelings about the original post.
- Click-through rates: Examining where users go after interacting with content can give clues about their interests, behaviors, and decision-making processes.
Qualitative data in social media offers a treasure trove of information regardless of the approach you adopt. Through careful analysis, it provides a window into the human psyche, revealing how we perceive, react to, and interact with the digital world around us.

Why do we analyze social media data?
The ubiquity of social media has turned these platforms into goldmines of data. By analyzing social media data, researchers, businesses, and policymakers can extract valuable insights from a wide range of subjects. Here are some compelling reasons underscored by real-world examples:
Understanding societal trends and movements
A classic example of this is the Arab Spring of 2010-2012. Through analyzing tweets, Facebook posts, and other online discourse, researchers could track the spread of dissent, identify key influencers, and understand the underlying grievances driving the protests.
A social media report providing this kind of analysis offers a real-time pulse of societal sentiments, helping stakeholders gauge public opinion and predict potential shifts.
Branding and consumer sentiment analysis
Businesses today rely heavily on social media feedback to understand their consumers. For instance, a beverage company launching a new drink might monitor Twitter reactions to gauge initial public sentiment.
Negative feedback about taste can prompt recipe adjustments, while positive feedback on packaging might lead to its design being incorporated into other product lines.
Public health surveillance
During the COVID-19 pandemic, health organizations monitored social media to track public sentiments on vaccinations, lockdowns, and health measures.
By doing so, they could understand common misconceptions, fears, and compliance levels, tailoring their communication strategies accordingly.
Crisis monitoring and response
Natural disasters, political crises, or public incidents often generate a flurry of social media activity. Analyzing this data can help local authorities and humanitarian organizations pinpoint affected areas, understand the scale of the crisis, and deploy resources efficiently.
For instance, during Hurricane Harvey in 2017, emergency responders utilized social media data to locate and rescue stranded individuals based on their posts and location tags.

ATLAS.ti for social media research
Qualitative analysis software is a natural fit for data taken from digital platforms. Data organization and coding are integral parts of every qualitative research project, but we'll use this section to describe two tools that are particularly useful for social media research.
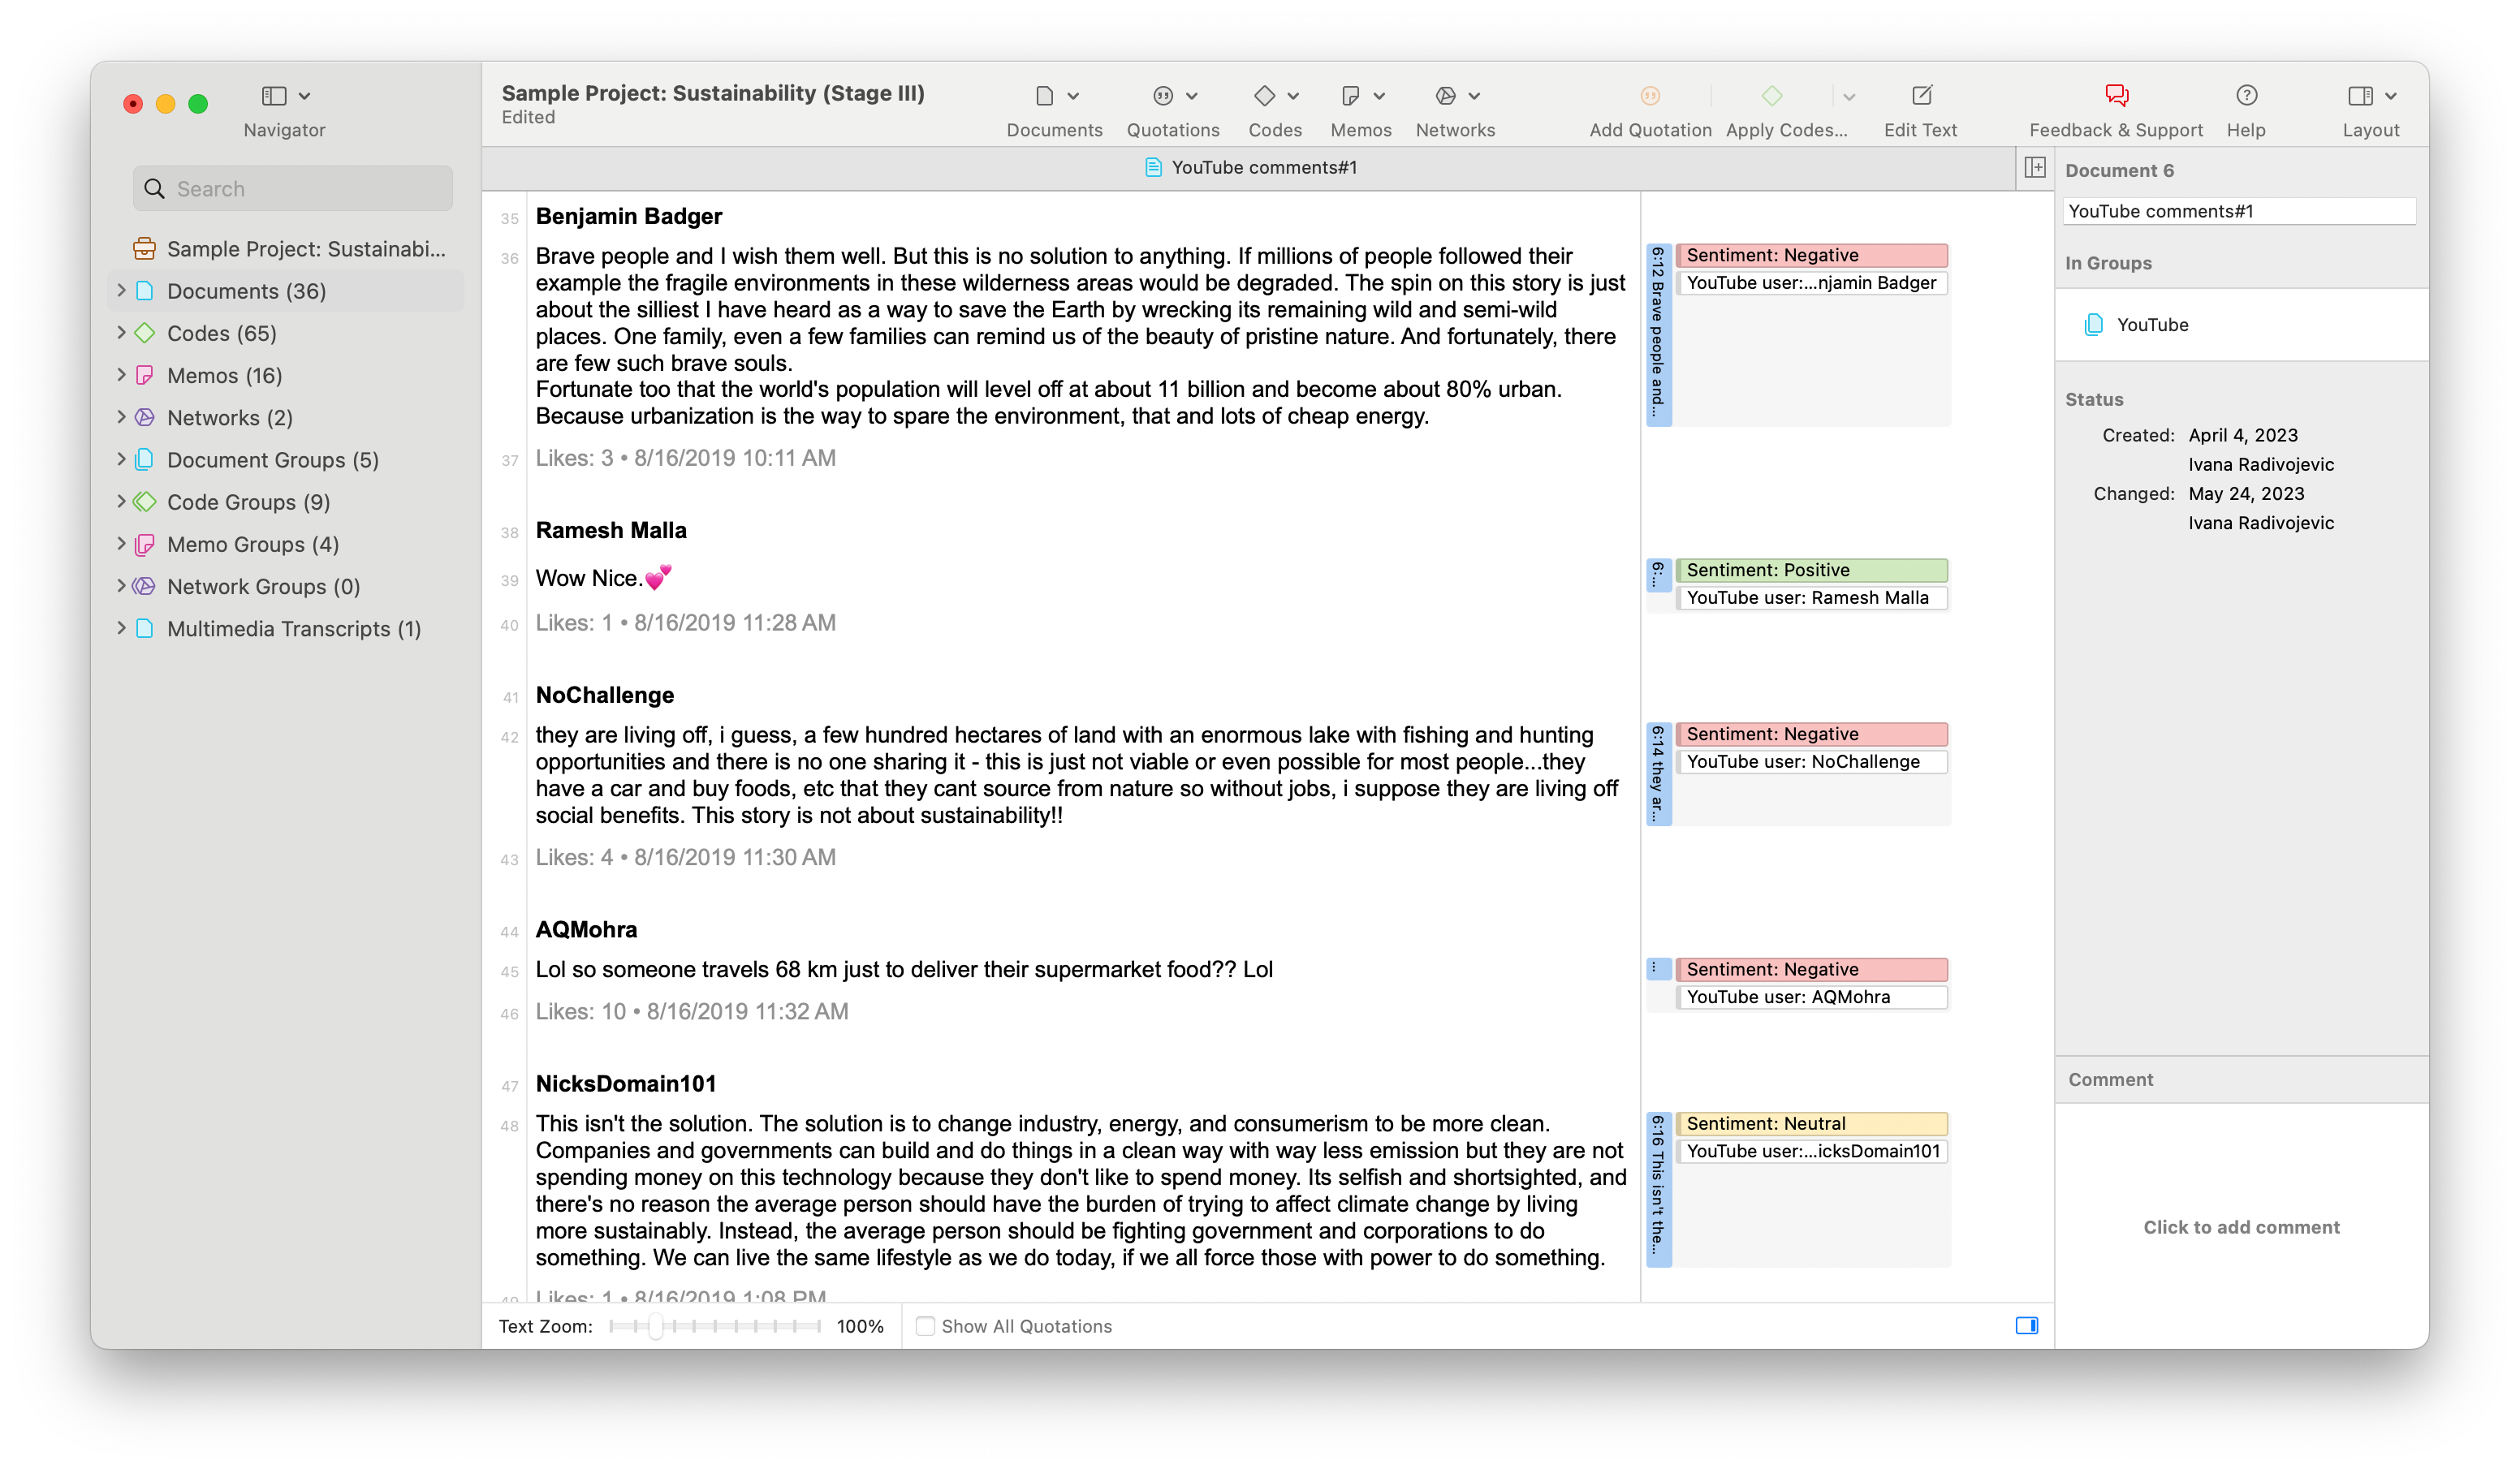
Sentiment Analysis
Sentiment analysis is a powerful tool for gauging public opinion on a vast scale. In social media, where millions express their feelings daily, it provides a systematic way to classify and interpret these emotions. By determining whether the sentiment of a post is positive, negative, or neutral, researchers can track shifts in public sentiment, be it for a product launch, a political event, or a societal issue.
This real-time feedback is invaluable. It enables businesses to adapt their strategies, policymakers to address public concerns, and researchers to understand the prevailing mood of a digital audience. This nuanced understanding generates useful insights for crafting responsive and effective strategies across various sectors.
ATLAS.ti's Sentiment Analysis tool relies on machine learning to examine textual data and determine the sentiment being expressed. Rather than painstakingly examining each comment or post manually, Sentiment Analysis can process large datasets quickly and efficiently to apply sentiment codes to data segments for subsequent analysis.
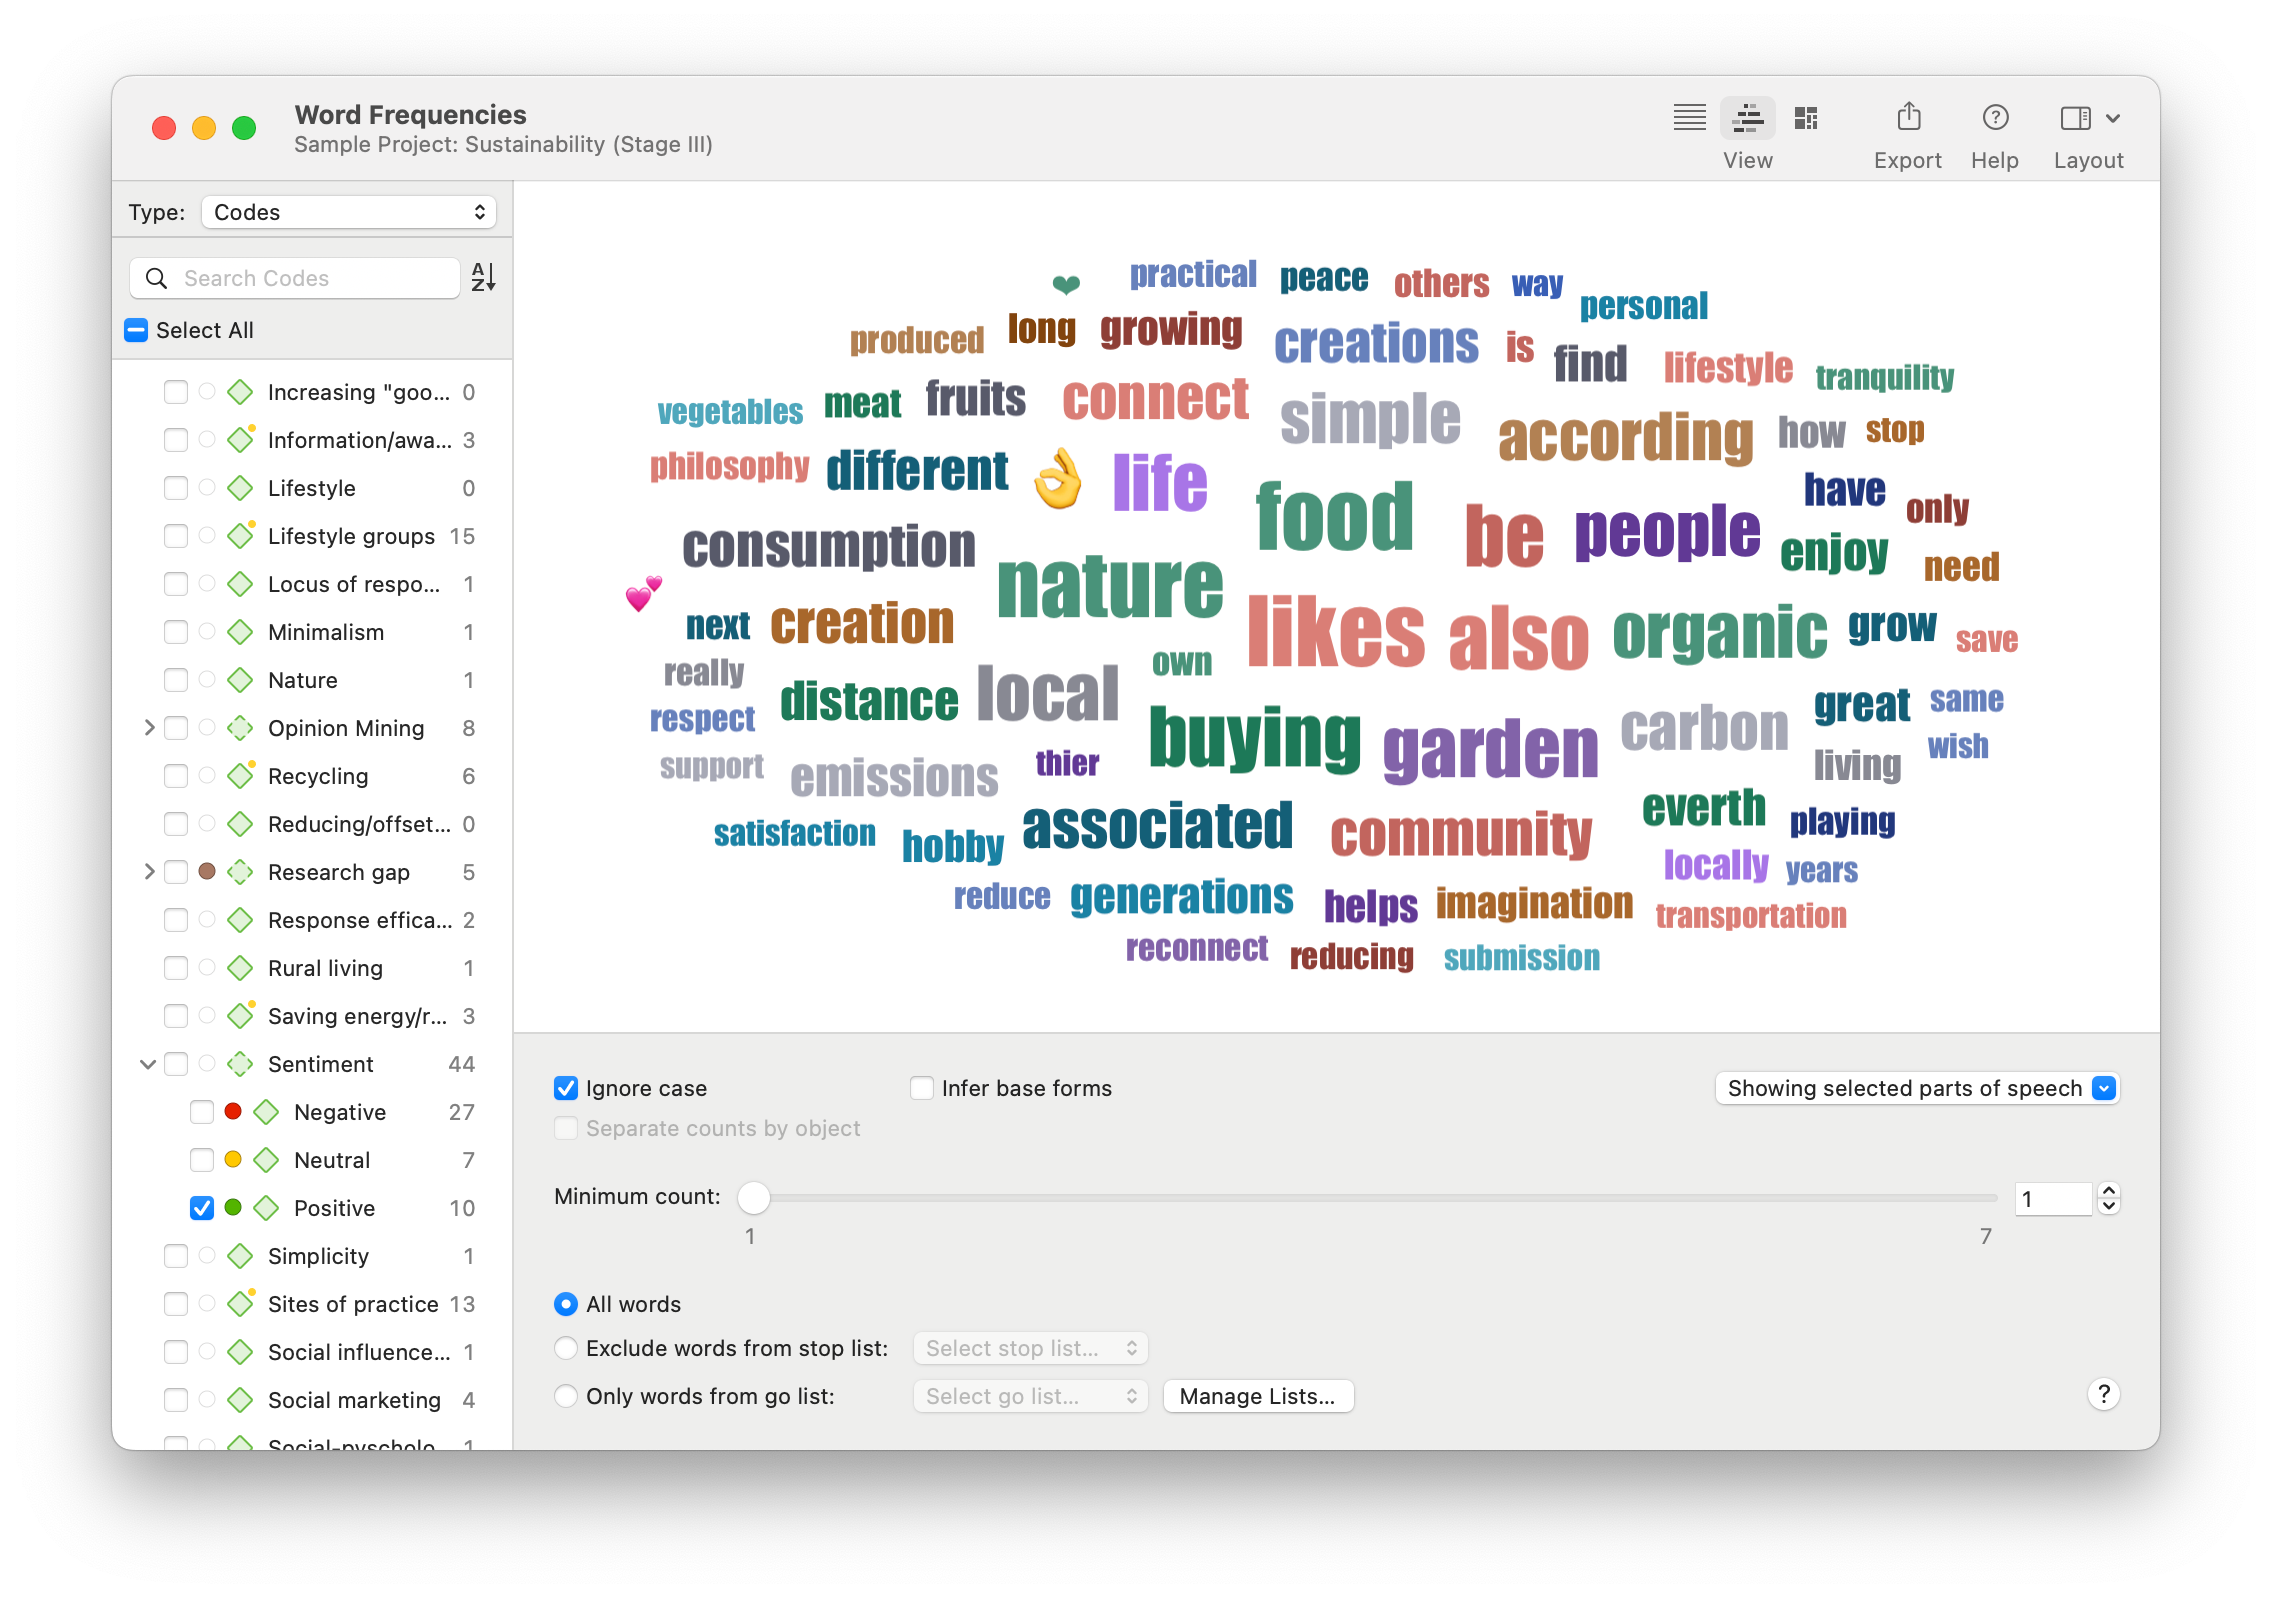
Word Frequencies
Social media content analysis emphasizes the occurrence of words and phrases that commonly appear in the data. Word clouds and word lists offer a visual representation of the frequency of words used within a given dataset, effectively highlighting the most discussed topics or terms in social media content.
For researchers, these tools simplify vast amounts of textual data, making patterns and trends immediately recognizable. In the context of social media, where vast swathes of text can be overwhelming, word clouds and lists distill key themes, allowing for quicker insights. By spotlighting recurrent words or phrases, researchers can swiftly identify predominant topics of conversation, ensuring they don't overlook important areas of discussion in their analyses.
The Word Frequencies tool in ATLAS.ti is useful for creating these visualizations. This tool not only looks at what words are used, but aggregates words together by their base forms (e.g., "enjoy" and "enjoys" are treated as one unit) and allows you to filter words by part of speech. You can also narrow the analysis in Word Frequencies to certain documents, quotations, or even codes to process the data most relevant to your research.
Putting it all together
Using ATLAS.ti tools in tandem is great for generating insightful analysis for your social media report. After applying Sentiment Analysis to a set of YouTube comments in the screenshot above, we used Word Frequencies to only look at the positive comments. After specifying what parts of speech to include in the analysis, the result is a word cloud that displays the most commonly occurring words among positive comments, which will likely differ from a similar visualization of an analysis of negative comments or even neutral comments. With ATLAS.ti, creating these different visualizations is quick and easy, so you can focus on analyzing similarities and differences across the different subsets of data.