Co-Occurrence Analysis with ATLAS.ti Desktop

- Introduction
- Coding and spatial relationships
- Code Co-Occurrence Analysis in ATLAS.ti
- The Query Tool in ATLAS.ti Windows
- Takeaways
In ATLAS.ti, codes are associated with quotations that refer to segments of your data. As you mark your data with codes, you will find that quotations and codes have various spatial relations to other quotations. They can overlap each other; one can occupy a part of a larger one; one can also follow the other. You can analyze these relationships to make interpretations about your data. Let’s briefly discuss a few of the basic foundations of this idea, then see how it applies to your research in ATLAS.ti.
Coding and spatial relationships
In qualitative research, codes are used to classify, categorize, and conceptually understand data. These codes help create a meaningful narrative from the multitude of responses collected in a study. Importantly, the way these codes relate to each other in a spatial manner, including co-occurrence, proximity, and embeddedness, can play a key role in drawing insightful conclusions from the data.
Firstly, the concept of co-occurrence refers to instances where two or more codes occur together in the same data context. For instance, if you are analyzing interviews on people's experiences with remote work, you might have codes like "productivity" and "flexibility." If these codes frequently appear together in the data, it suggests a connection between these concepts, perhaps indicating that participants associate productivity with the flexibility of remote work. Co-occurrence can reveal themes or patterns in the data, helping researchers understand complex relations between different elements of their study.
Proximity, on the other hand, is about the closeness or distance between codes within the data. For instance, if the code "anxiety" often appears right after the code "deadlines," it could indicate that the participants experience anxiety due to impending deadlines. However, if the two codes rarely show up together or are far apart when they do, the association might be weaker or even non-existent. Analyzing proximity can aid in identifying significant factors and understanding their influence in the context of the study.
Embeddedness pertains to the situation where one coded quotation is encompassed or contained within another, illustrating potential hierarchical or nested relationships. For example, a broader code like "emotional well-being" might encompass quotations with more specific codes such as "stress," "anxiety," and "happiness." This relationship can reveal important insights about the data, showing how narrower concepts contribute to broader themes or experiences.
In employing these spatial relations, visual aids like mind maps, diagrams, or even advanced software tools like those found in ATLAS.ti can help illustrate these relationships, making it easier to comprehend the potential interconnections. Moreover, these spatial relationships are not mutually exclusive but can coexist in a single data set, thereby creating a multifaceted picture of the qualitative data.
Code Co-Occurrence Analysis in ATLAS.ti
To analyze potential relationships among codes in ATLAS.ti, one of the most commonly used tools is Code Co-Occurrence Analysis. This tool displays a matrix that refers to all coded segments in a project, highlighting instances where two or more codes appear together in the data. The table's rows and columns represent different codes, and the intersecting cells indicate the frequency of their co-occurrence.
To generate this table, go to the "Analysis" tab and click on "Code Co-occurrence." A window will open with two identical menus listing all of your codes, one referring to the rows and the other referring to the columns of the table. You can select individual codes, category codes, code folders, and/or code groups.
The numbers in the cells represent the number of quotations where the intersecting codes co-occur. For instance, if the cell at the intersection of "Productivity" and "Flexibility" displays a '5', this indicates that there are five instances in your data where these two codes appear together. This could mean that these codes were applied to the same quotation or these codes are on overlapping quotations.
It's important to interpret these co-occurrences within the context of your data. You can click on any cell to view the specific quotations where the co-occurrence happens, helping you understand the nature of the relationship between the two codes.
Codes can also be organized into categories that can also be analyzed in Code Co-Occurrence Analysis. To show this, we have a sample sustainability project with data that consists of interview transcripts of people talking about sustainability. We nested the codes in larger categories to represent themes like adaptability and human values. Let’s look for co-occurrences between these themes.
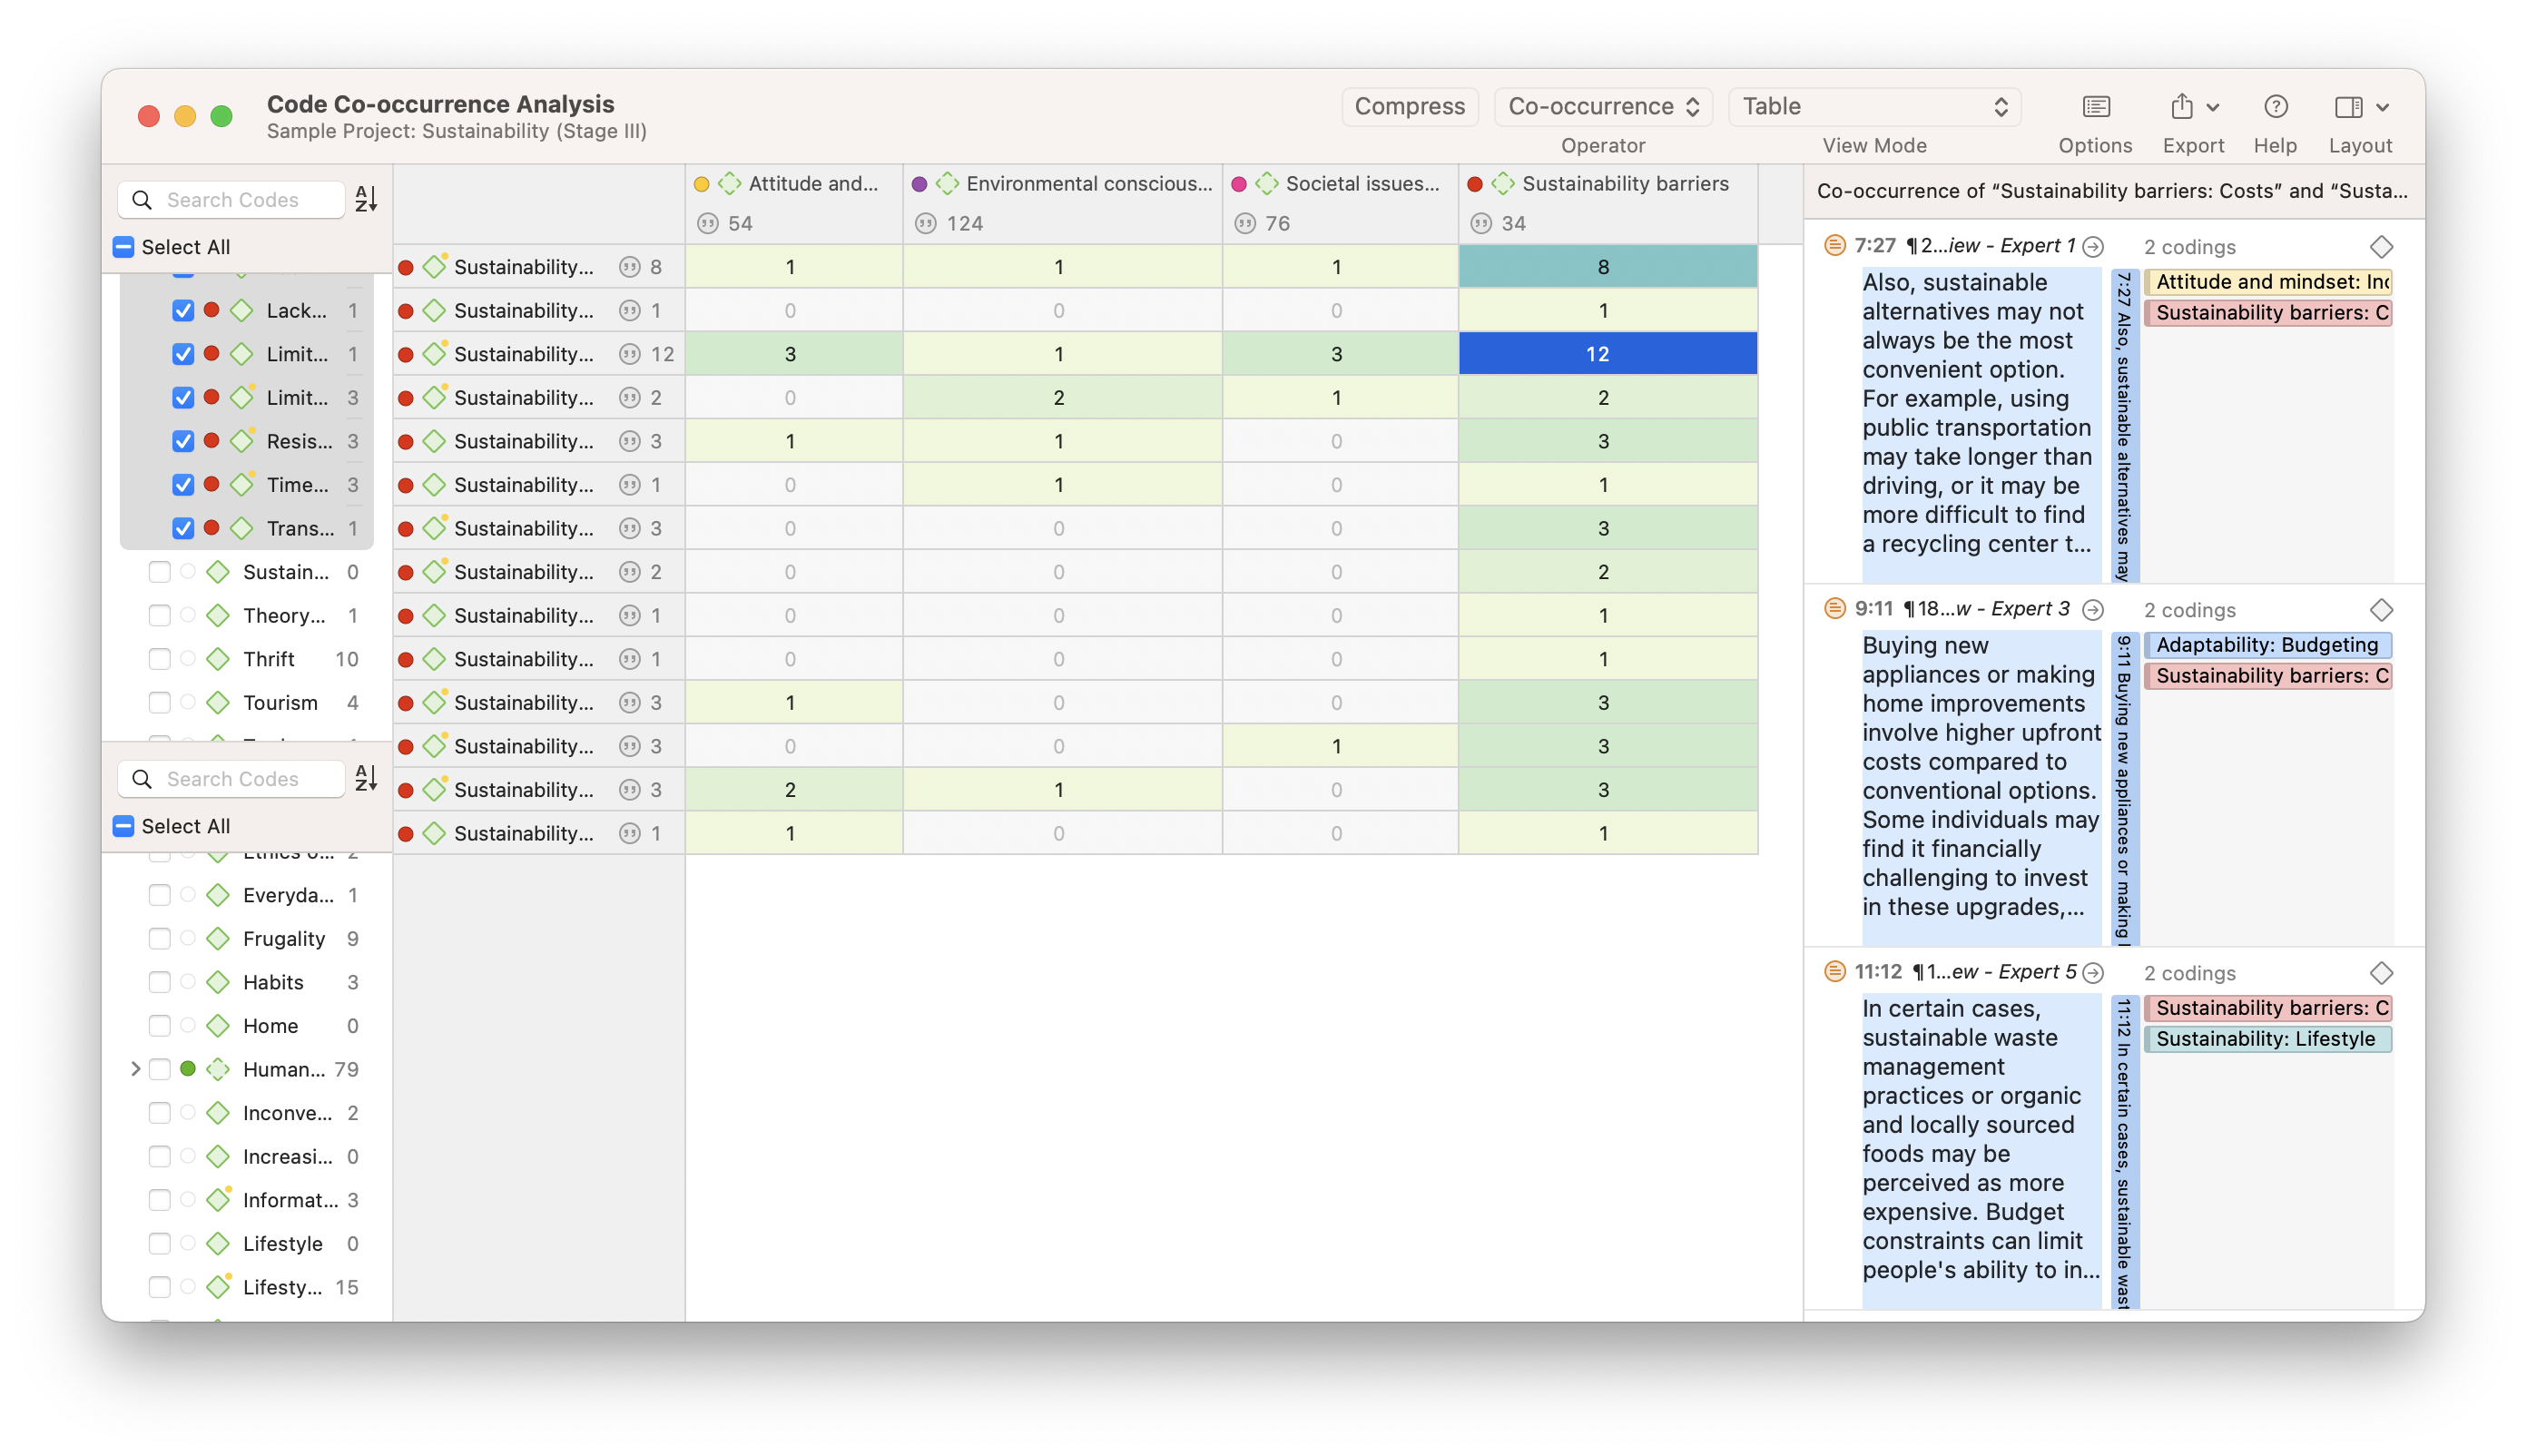
With Code Co-Occurrence Analysis, we have a table where the columns represent themes related to sustainability while the rows represent themes related to human action, behavior, and challenges. Essentially, we are trying to examine the relationship between sustainability and people’s roles in creating a sustainable world.
At least among the people interviewed for this sample project, there are relatively fewer co-occurrences between adaptability and attitude and mindset, and between adaptability and sustainability barriers, as evidenced by the lower numbers in the table above. This means that our interview respondents didn’t discuss these pairs of themes together at the same time very often. Conversely, there is a relatively stronger connection between sustainability and human values, which is highlighted by the darker color and represented by the 56 instances these two categories co-occur. This suggests that human values are discussed in tandem with sustainability often throughout our data, which might prompt us to explore ways in which practices of ethical consumption and waste management are interpreted as core human values.
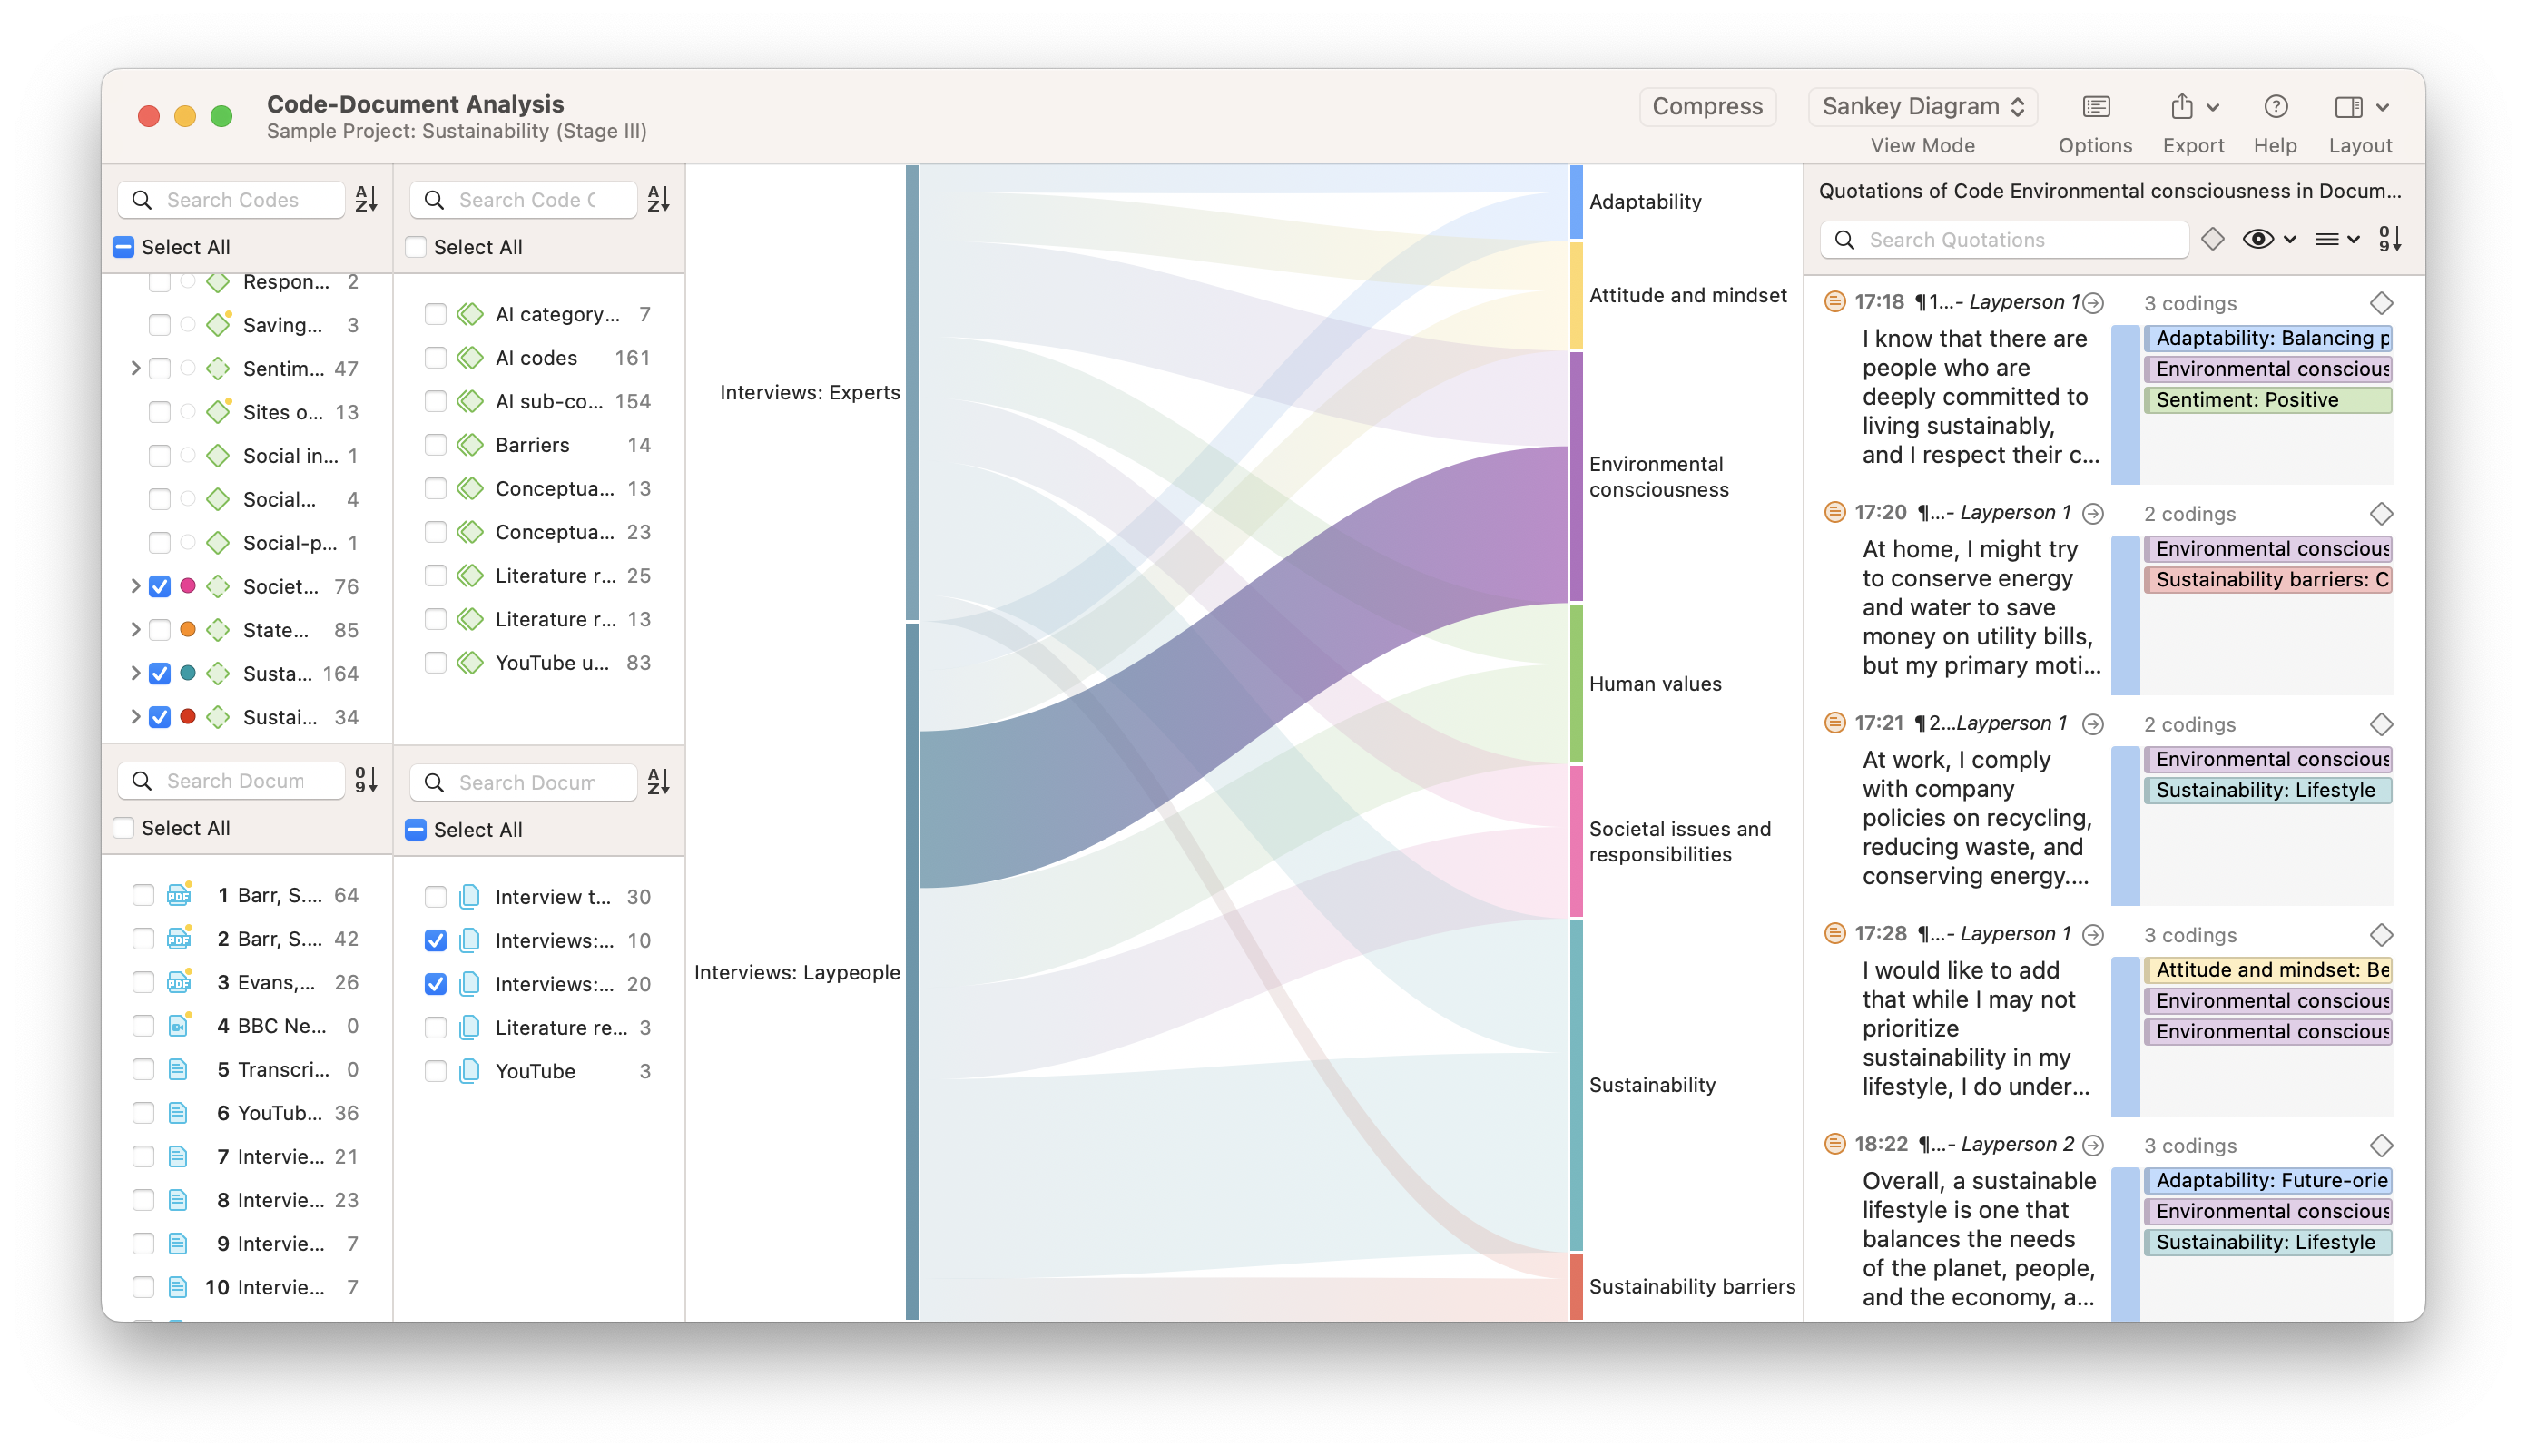
These co-occurrences can be visualized through Sankey diagrams, bar charts, and force-directed graphs for use in papers or presentations, thus turning your data into powerful illustrations of the key themes of your research.
The Query Tool in ATLAS.ti Windows
Query Tool is a powerful feature that allows researchers to conduct complex searches within their qualitative data. It's particularly useful when you need to find specific segments of coded data, evaluate relationships between codes, or examine patterns across your dataset.
The tool provides a variety of operators to help you construct queries that fit your needs. These include:
- AND: This operator helps to find instances where both of the specified codes occur together. For example, a query for 'Code1 AND Code2' will return all quotations that have been associated with both Code1 and Code2.
- OR: The 'OR' operator returns instances where either of the specified codes occurs. A query for 'Code1 OR Code2' will show all quotations that have been associated with Code1, Code2, or both.
- NOT: This operator helps you find instances where a certain code is not associated with quotations. For example, 'Code1 NOT Code2' will return quotations that have been associated with Code1 but not Code2.
- WITHIN: This operator is used to find codes that occur within other codes. If you query 'Code1 WITHIN Code2', it will return quotations associated with Code1 that are embedded within quotations associated with Code2.
- FOLLOWS/PRECEDES: These operators can be used to find instances where one code occurs before or after another. If you query 'Code1 PRECEDES Code2', it will return quotations associated with Code1 that occur right before quotations associated with Code2.
Using these operators, ATLAS.ti will return a list of quotations that match the criteria specified in the query.
Moreover, the results of the query can be saved as a new code or added to an existing one. This is particularly useful when you want to aggregate certain findings or further analyze specific subsets of your data.
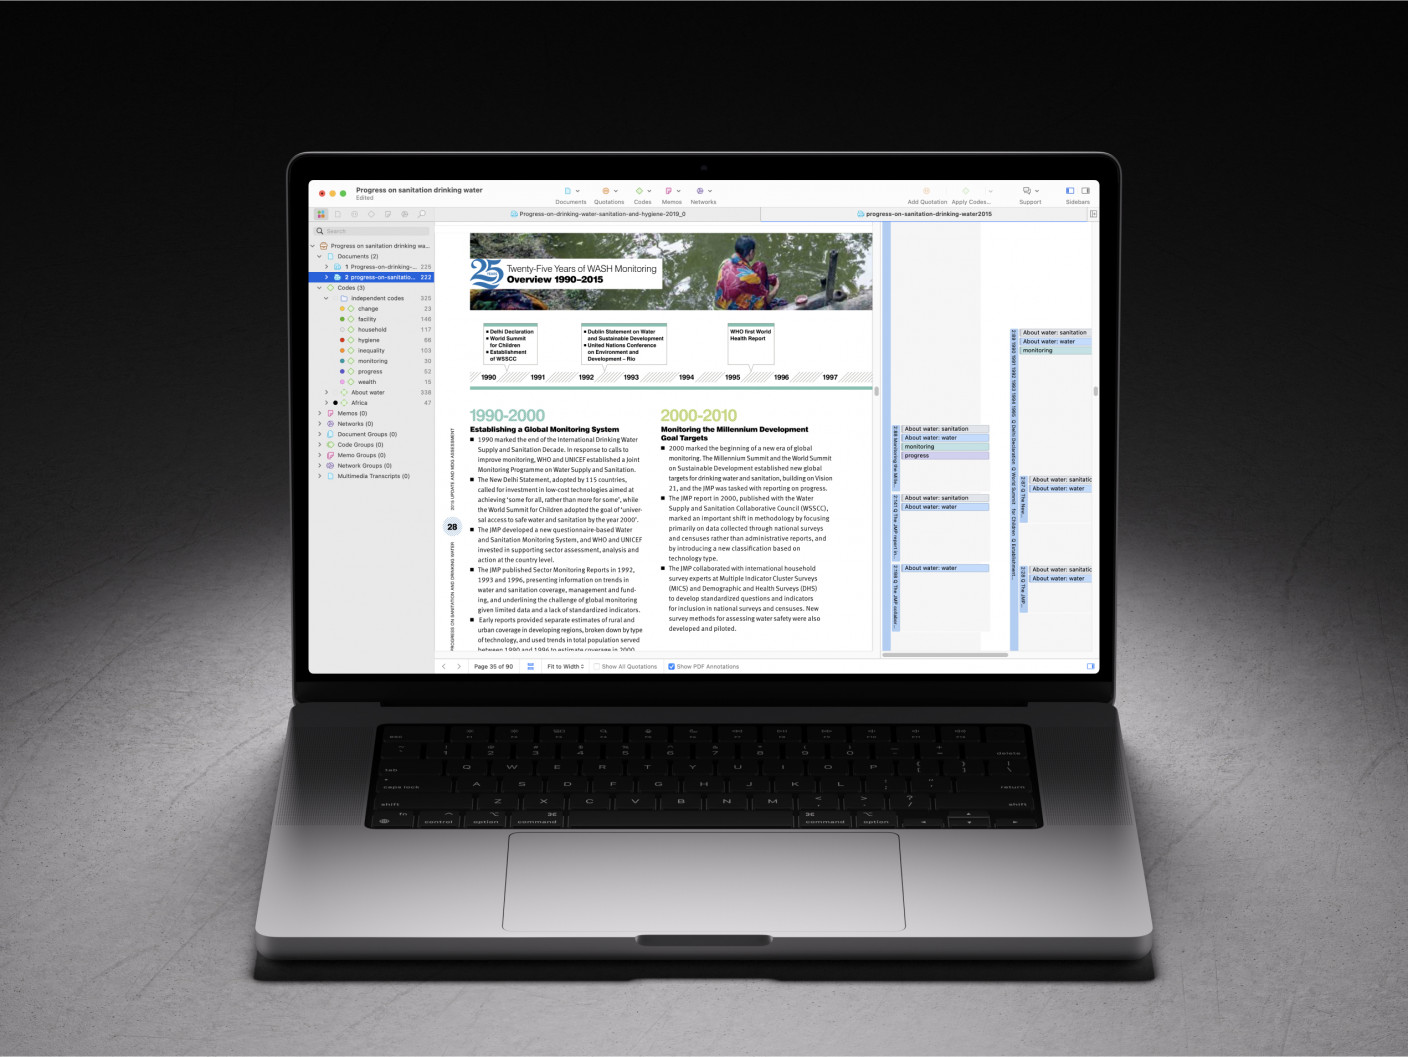
Take a look at a document found in our sample sustainability project. In this document, an expert on sustainability is being interviewed about the potential of individual actions in promoting a sustainable world.
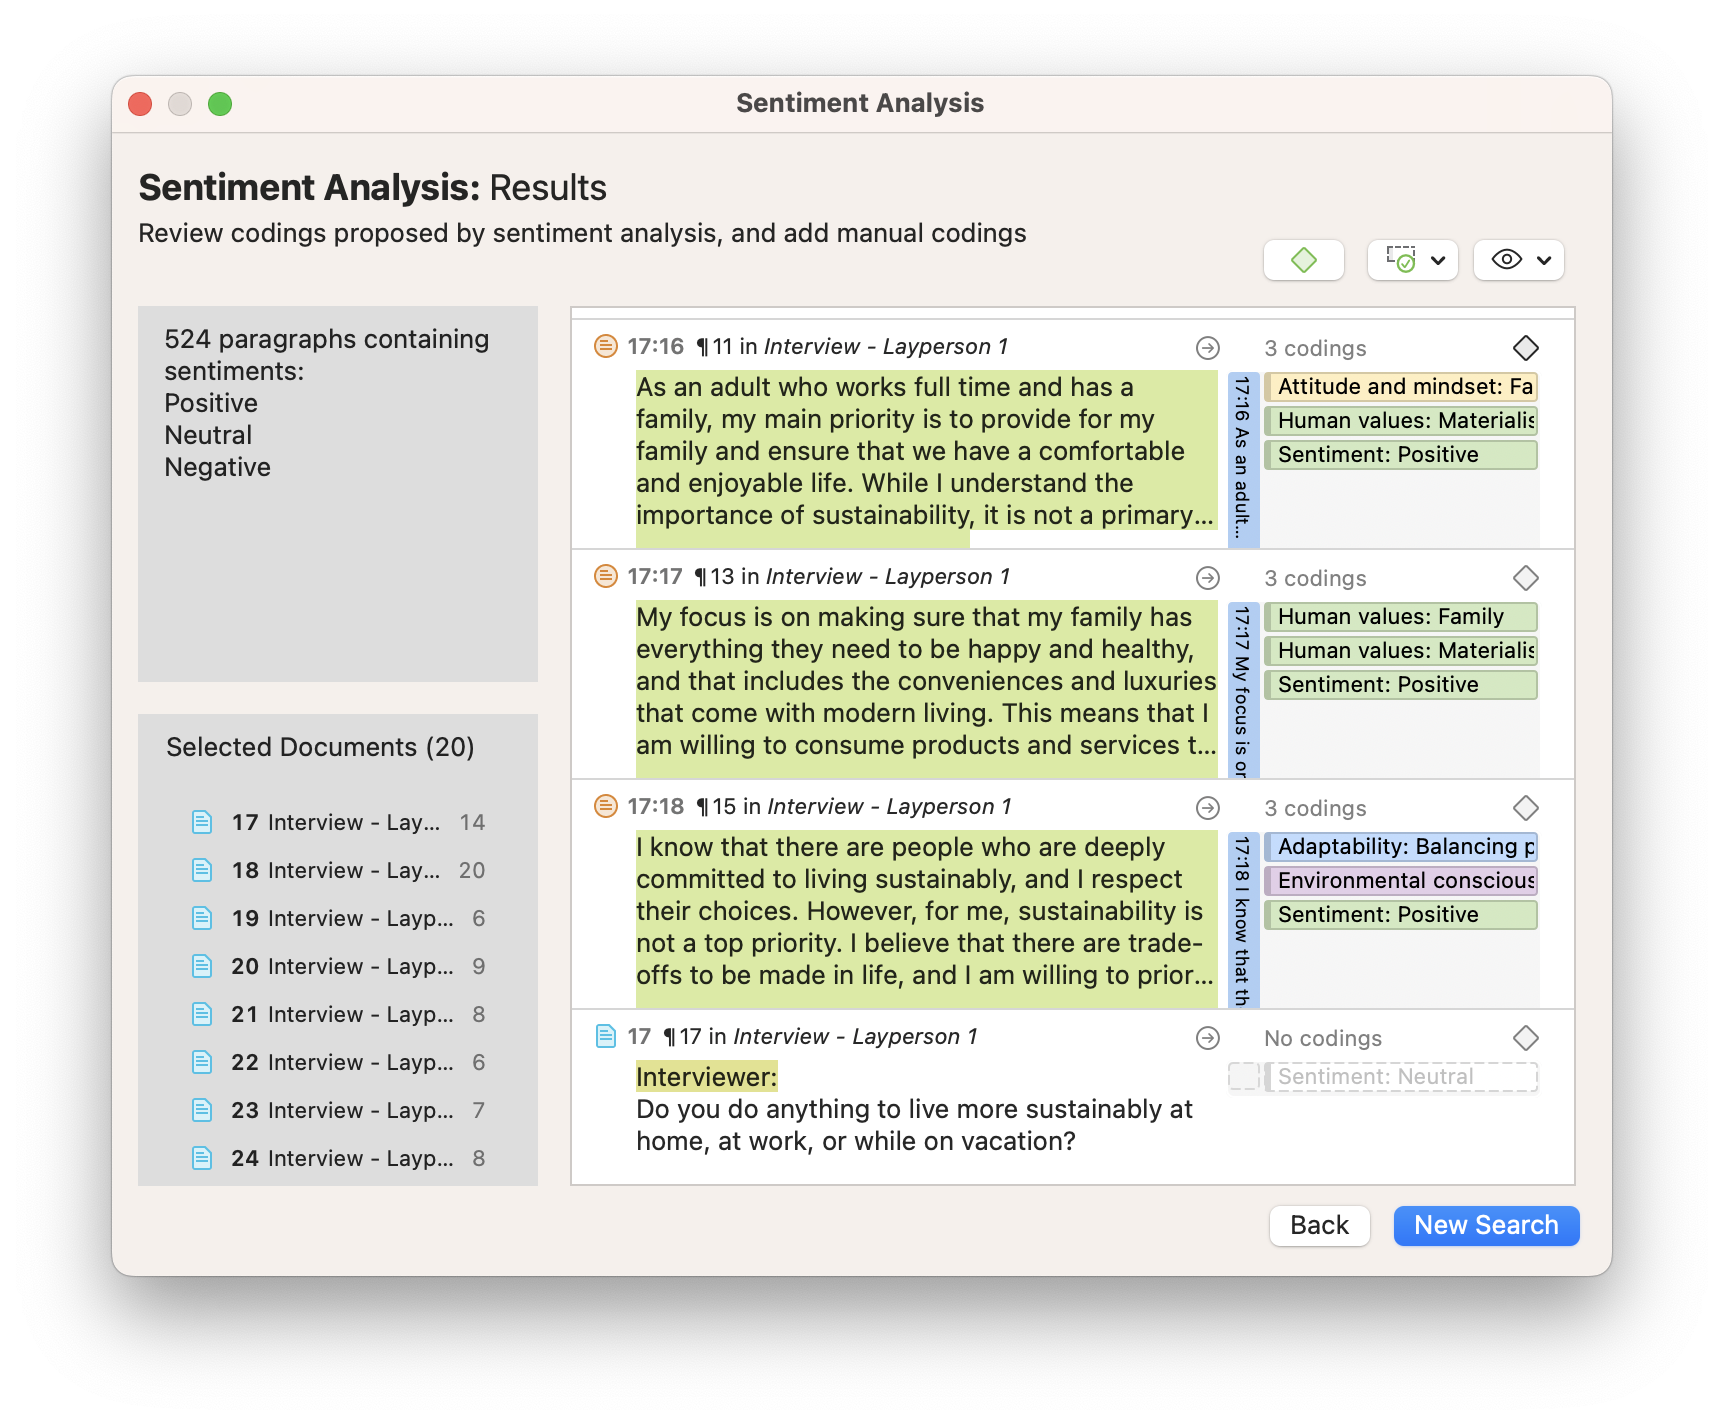
In the margin to the right of the document, there are quotations marking different data segments. Each quotation has a set of codes representing the meaning or sentiment of the data. As you can see, some quotations are enclosed in larger quotations, meaning that they mark a portion of the text that the larger quotation also marks. You will also notice that, in our approach to coding, entire paragraphs are coded with themes such as “Attitude and mindset” and “Sustainability barriers” while smaller data segments have been coded with sentiment codes (i.e., “Positive,” “Negative”) thanks to our Sentiment Analysis tool. These sentiments help us to determine how people talk about a particular topic or concept, which we will analyze through the Query Tool.
In the Query Tool, we can look for quotations containing themes that enclose quotations containing sentiments. In the example below, we have chosen the theme “Sustainability barriers,” which includes sub-codes such as “Access barriers” and “Costs.” When we look for negative sentiments associated with sustainability barriers, the Query Tool lists all of the results that are relevant to our inquiry.
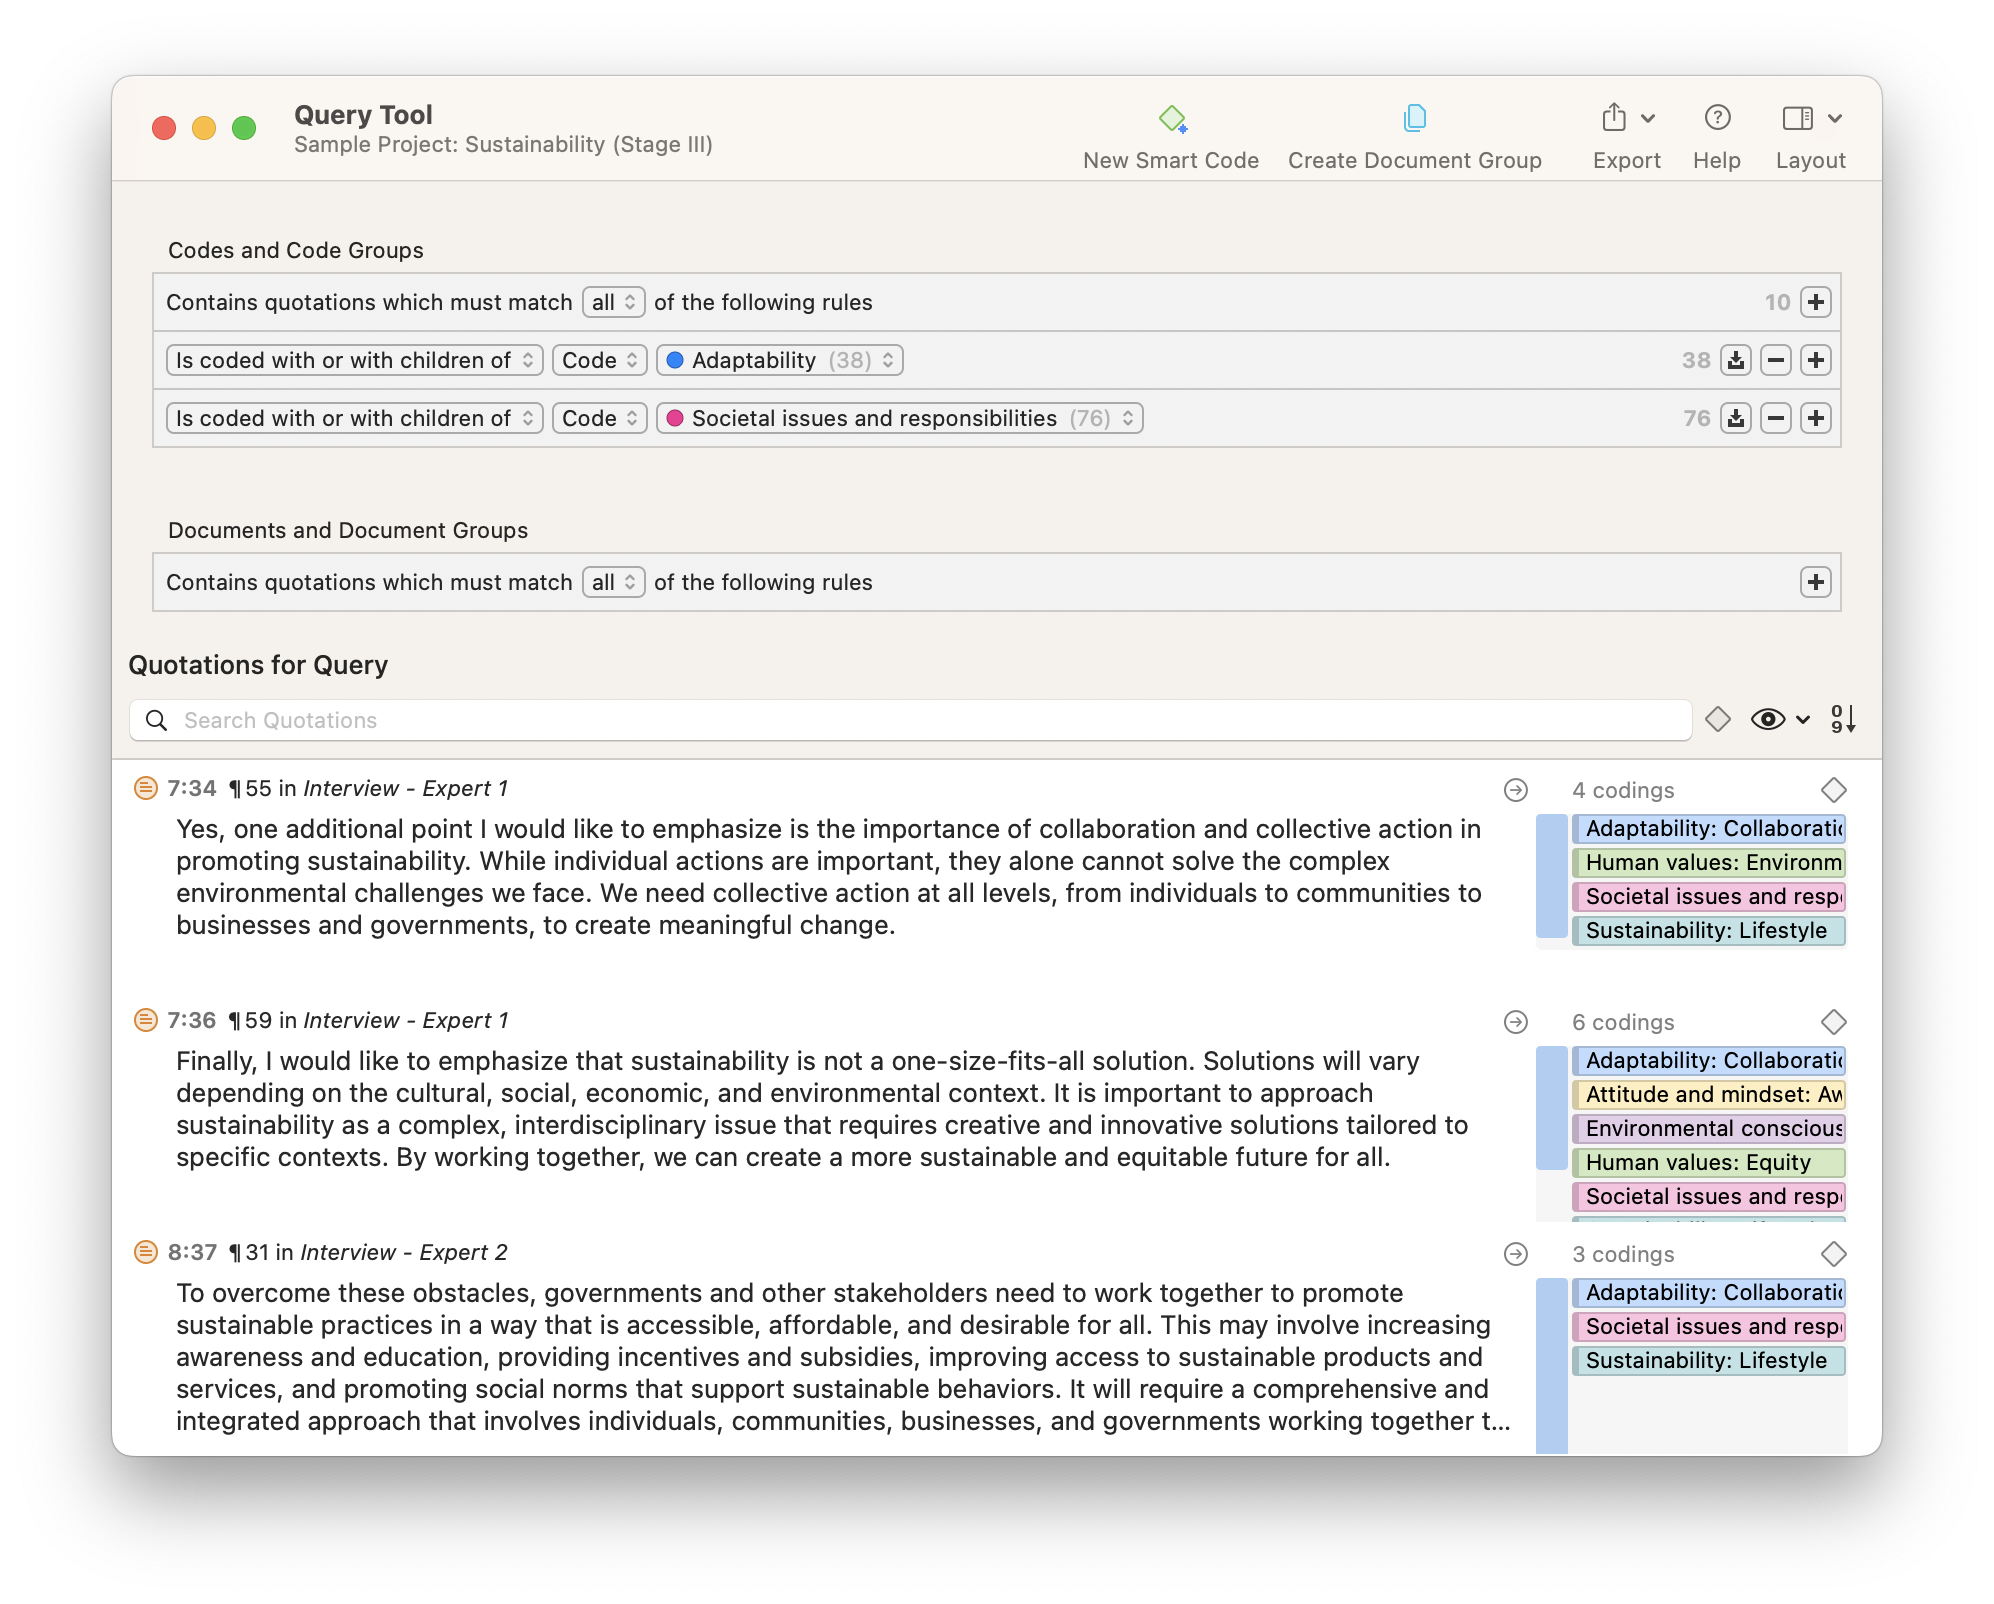
In this example, the Query Tool gives us all the relevant data that we are looking for in terms of negative sentiments about challenges to sustainability. At a glance, the Query Tool gives us results indicating that people think of sustainable alternatives as inaccessible or expensive. These results can be exported in report form that you can use in a presentation or paper.
Takeaways
The use of the Query Tool and Code Co-Occurrence Analysis is dependent on the application of codes to your data and an understanding of the patterns and spatial relationships that exist between codes and quotations in your project. With this in mind, think about your approach to coding and how you want your coded data to look as you analyze your data. If you want to analyze how distinct dimensions of your phenomenon are related, you might want to make sure that you always code for each dimension so that you can analyze their co-occurrences later on. Or suppose you have multiple participants within the same document (such as in a focus group or social media comments). In that case, you might want to code both for what is going on in the data and each participant’s demographic characteristics so that you can later easily compare what men and women talked about, for instance.
As always, the interpretation of this analysis is up to you. ATLAS.ti provides you with the analysis tools to give you a clearer picture of the data you are studying. By considering the different spatial relationships between codes while you are coding your data, you can engage in a richer analysis and key insights.