


- Presenting qualitative data
- Data visualization
- Research paper writing
- Transparency and rigor
- How to publish a research paper
- How to cite "The Ultimate Guide to Qualitative Research - Part 3"
Research paper writing
A successfully crafted research study culminates in the writing of the research paper. While a pilot study or preliminary research might guide the research design, a full research study leads to discussion that highlights avenues for further research. As such, the importance of the research paper cannot be overestimated in the overall generation of scientific knowledge.

While there are no prescriptions for the writing process in creating a qualitative research paper, there are essential guidelines to consider when turning your data into written reports.
What should be included in a report?
The physical and natural sciences tend to have a clinical structure for a research paper that mirrors the scientific method: outline the background research, explain the materials and methods of the study, outline the research findings generated from data analysis, and discuss the implications.
Qualitative research tends to preserve much of this structure, but there are notable and numerous variations from a traditional research paper. It is thus worth emphasizing the flexibility in the social sciences with respect to the writing process.
While there aren't any hard and fast rules regarding what belongs in a qualitative research paper, readers expect to find a number of pieces of relevant information in a rigorously-written report. The best way to know what belongs in a full research paper is to look at articles in your target journal or articles that share a particular topic similar to yours and examine how successfully published papers are written.
That said, there are a few sections found in a typical research paper outline that are worth discussing, not to recommend these sections prescriptively but to emphasize the role they play and the information they provide to readers.
Introduction section
Beyond any general preview of the content of the article, a good introduction includes a thesis statement. Thesis statements typically appear in the introduction section of the article and serve to articulate the main objective or research question that the study aims to address. It presents the central argument or focus of the research and provides readers with a clear understanding of the article's purpose.
The thesis statement helps to guide the overall structure and content of the research article. It informs the reader about the specific problem being investigated, the research methods employed, and the main findings or conclusions of the study. A well-defined thesis statement allows readers to assess the relevance and significance of the research, and it provides a framework for the subsequent sections of the article.
Literature review
A research study connects to past research and provides avenues for discussing future studies. With respect to the former, researchers must demonstrate that they are well-read on the scholarship that provides a broader context for their own research. Without such a context, other researchers may not perceive the need for the study outlined in the paper.
A literature review in a larger paper reporting a standalone study has its own set of requirements which are discussed in the literature review section of this guide.
Research gap
Given a sufficiently thorough synthesis of the literature, you should be able to articulate a research problem within your research paper topic. In scholarly research, a study is typically justified when there isn't existing inquiry on a particular topic, leading the researcher to form new research questions.
Methods section
Journals that are focused on breaking new theoretical or empirical ground are especially interested in a study's data collection and analysis methods. In research involving observation or interaction with participants, a description of the methods can be just as important as the findings themselves.
A methods section should immerse the reader in an understanding of the details of the study. Who or what did the researcher observe? How did the researcher observe or engage the research context?
What data was collected from this inquiry? How was it analyzed?
As the section on research rigor will outline, this section is important in terms of establishing the researcher's credibility when detailing how the data was generated and used in the paper. Without this section, it may prove difficult for readers to believe the information presented to them.
Results or findings
This is one of the main sections of any research paper. The presentation of findings depends on the type of study employed in the paper; experimental research will look very different from ethnographic observations or interviews, for example.
The main goal here is to highlight the main assertions that readers should take from the results and, as best as possible, provide the supporting evidence from the data to strengthen those assertions.
Discussion section
The discussion section transitions the paper from a relatively simple explanation of the analysis and findings to a description of the contributions that analysis has to the broader body of scientific knowledge. How does the study in this paper develop or challenge existing theories?
Essentially, the paper's discussion connects the new knowledge to existing knowledge, ultimately proposing new contributions to scientific knowledge in a manner that justifies the value of the paper.
Conclusion
The objective of a conclusion section in research papers is not to summarize the study one more time; readers can always just go back to the abstract for that. Rather, writers typically use this section to discuss implications, limitations, and future research inquiries.
Beyond the immediate research inquiry or research context, readers will want to know what the study means in terms of methods in future studies or practice outside of scholarly discussions. The researcher should also outline the missed opportunities or overlooked analytical strategies that future research should adopt, as well as potential research questions that new studies should address.
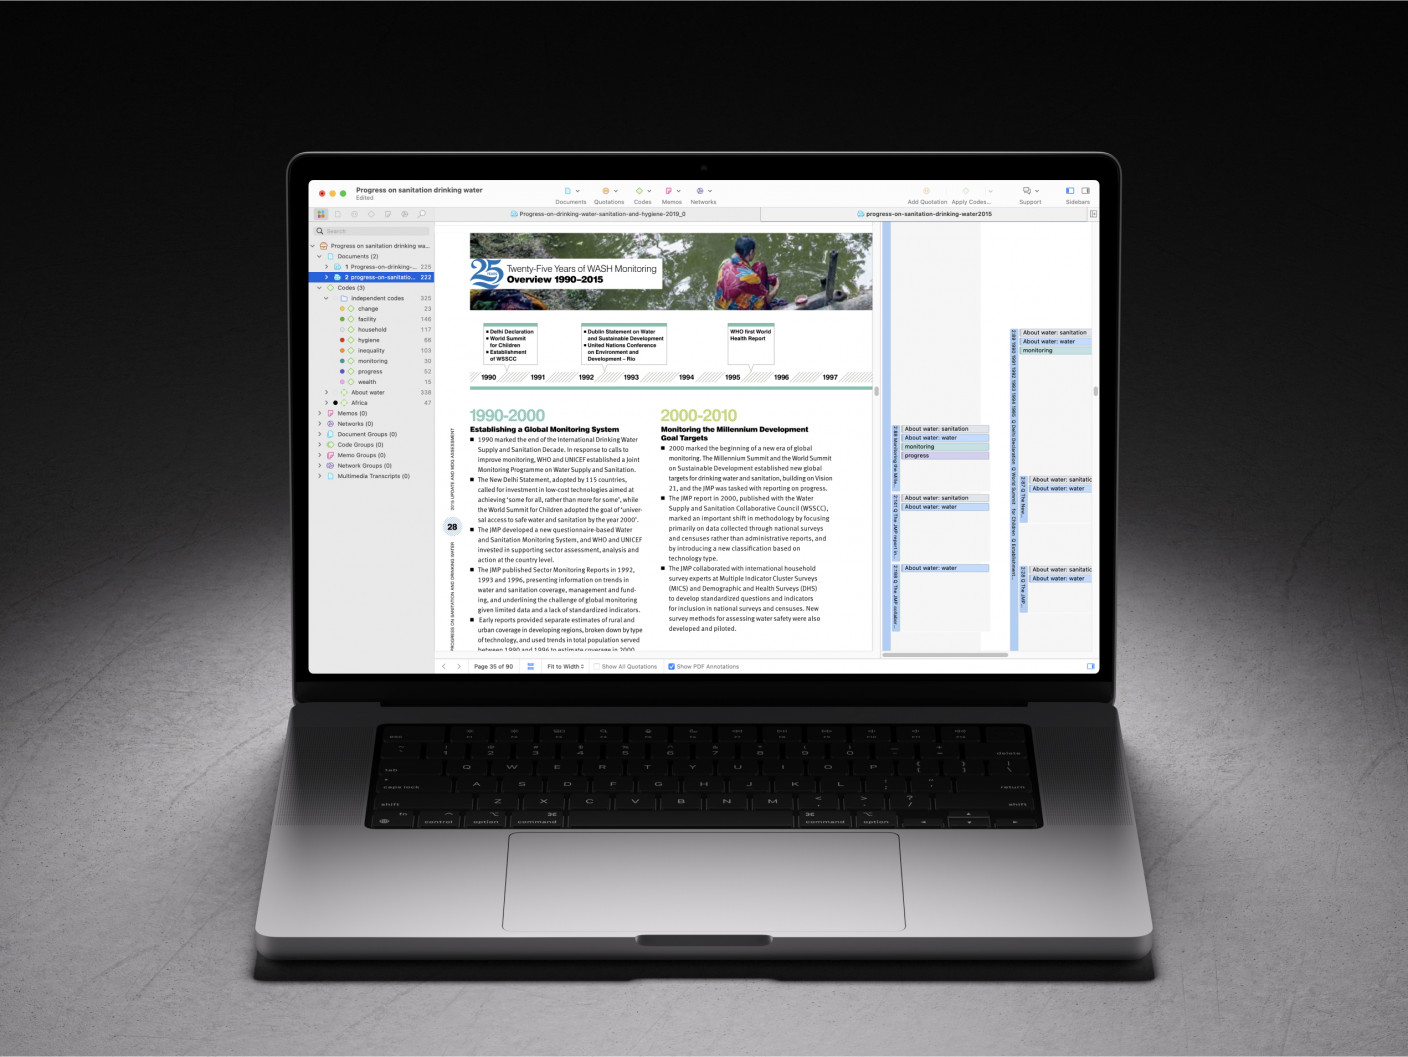
Research report creation with ATLAS.ti Web
Good research writing depends on rendering your analysis into useful reporting. ATLAS.ti is built to turn insights found in your project into reports and images that can be used in your research paper or presentation. In this section, let's look at what ATLAS.ti Web can do for research reporting.
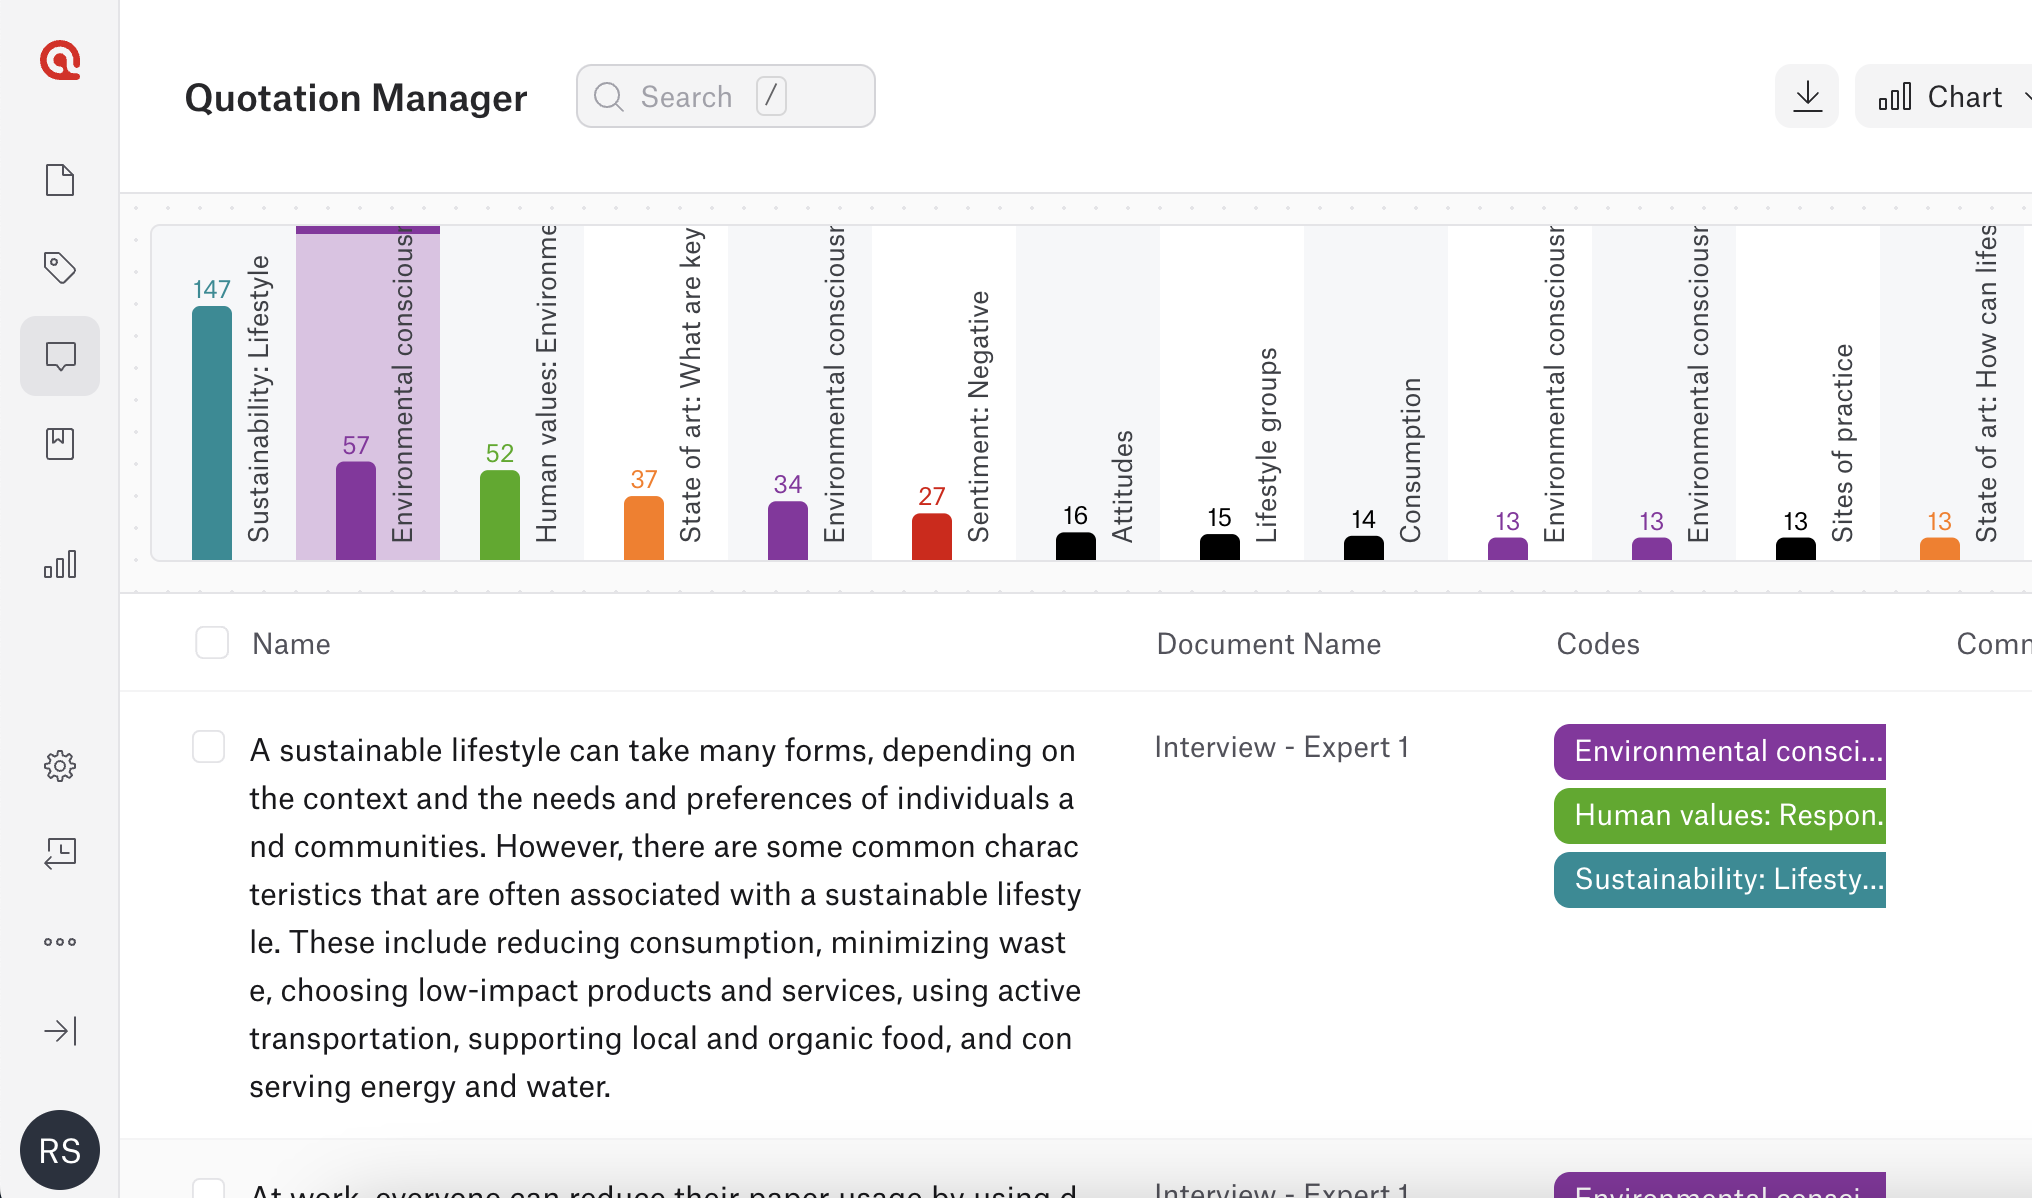
Code distribution reports
Code distribution reports show how many data quotations are associated with each code, and the code-document table displays frequencies of codes (or code groups) across documents (or document groups). Thus, you can use code distribution reports to explore how the data linked to each code, and you can use Code-Document tables to examine where in your project the different codes are appearing.
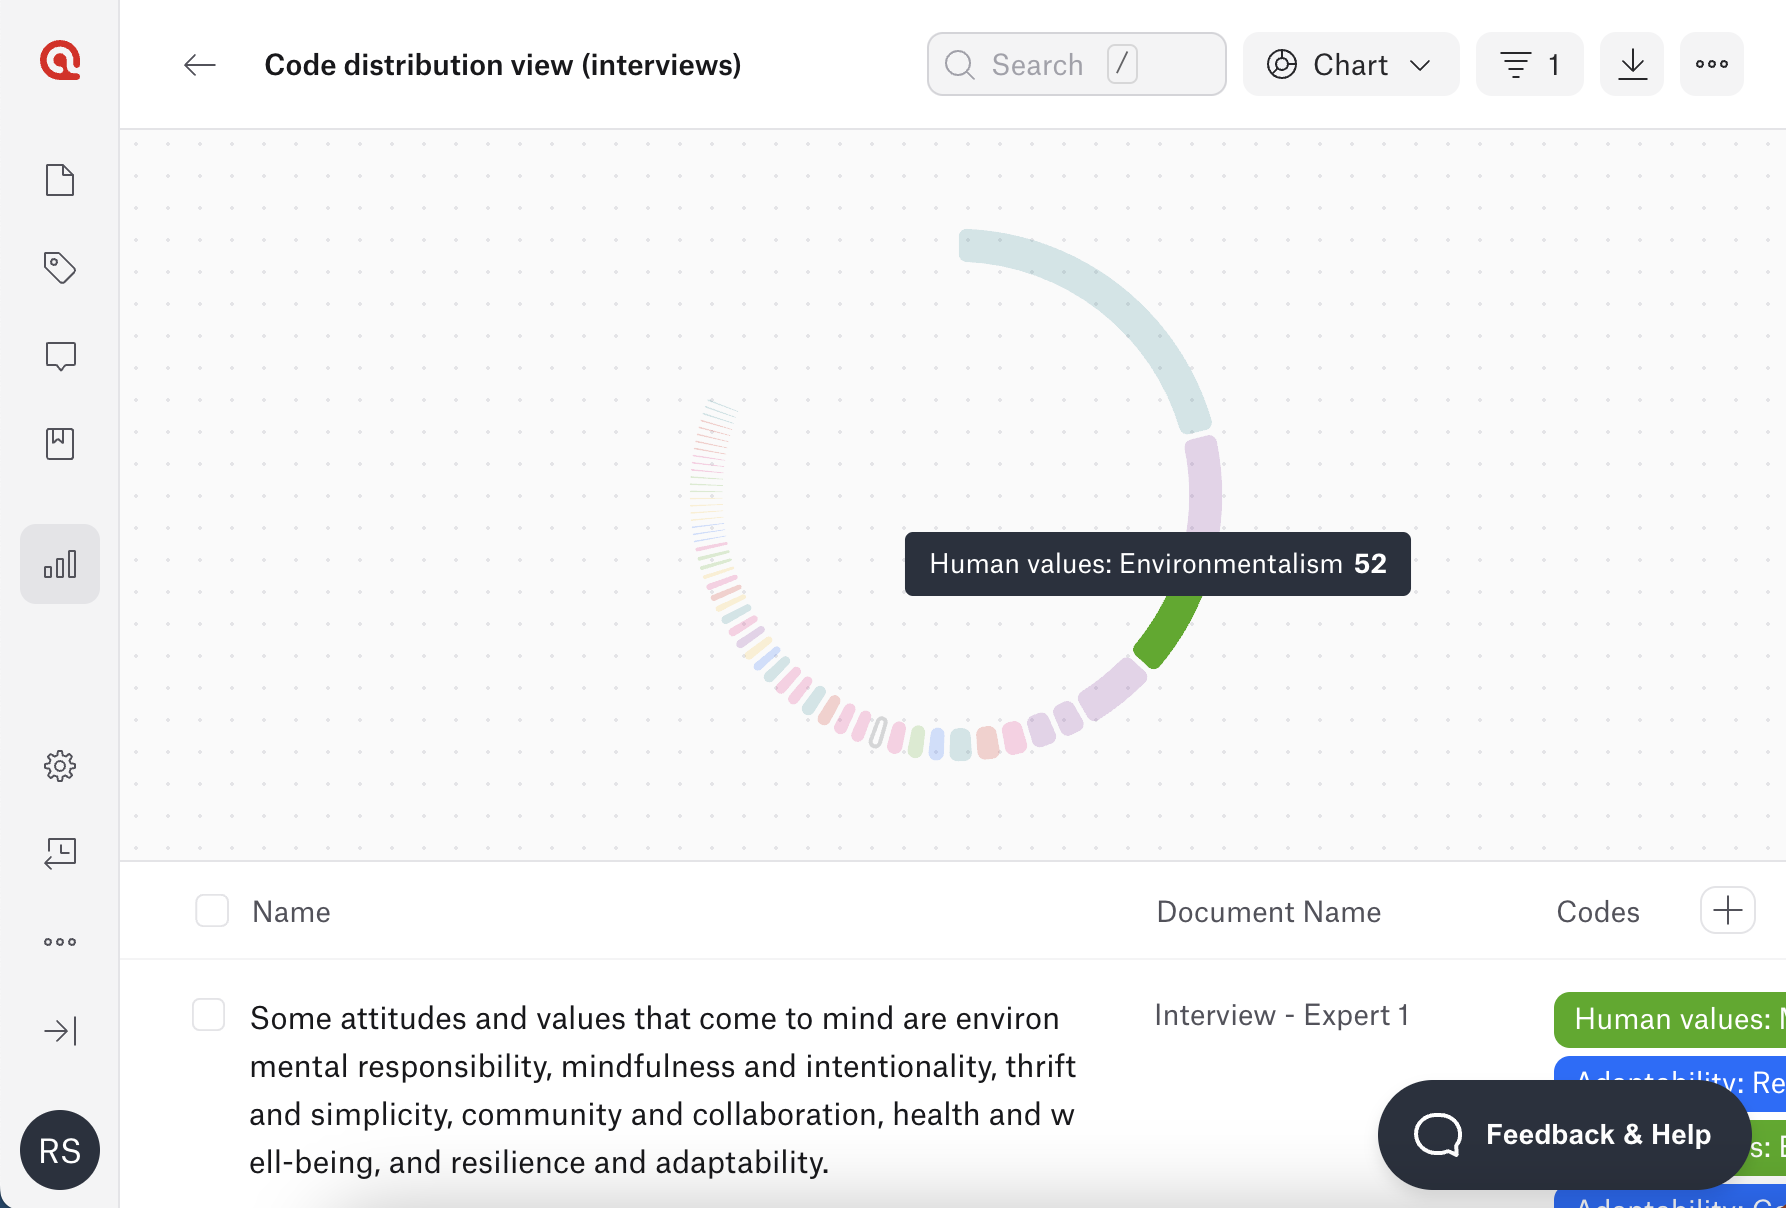
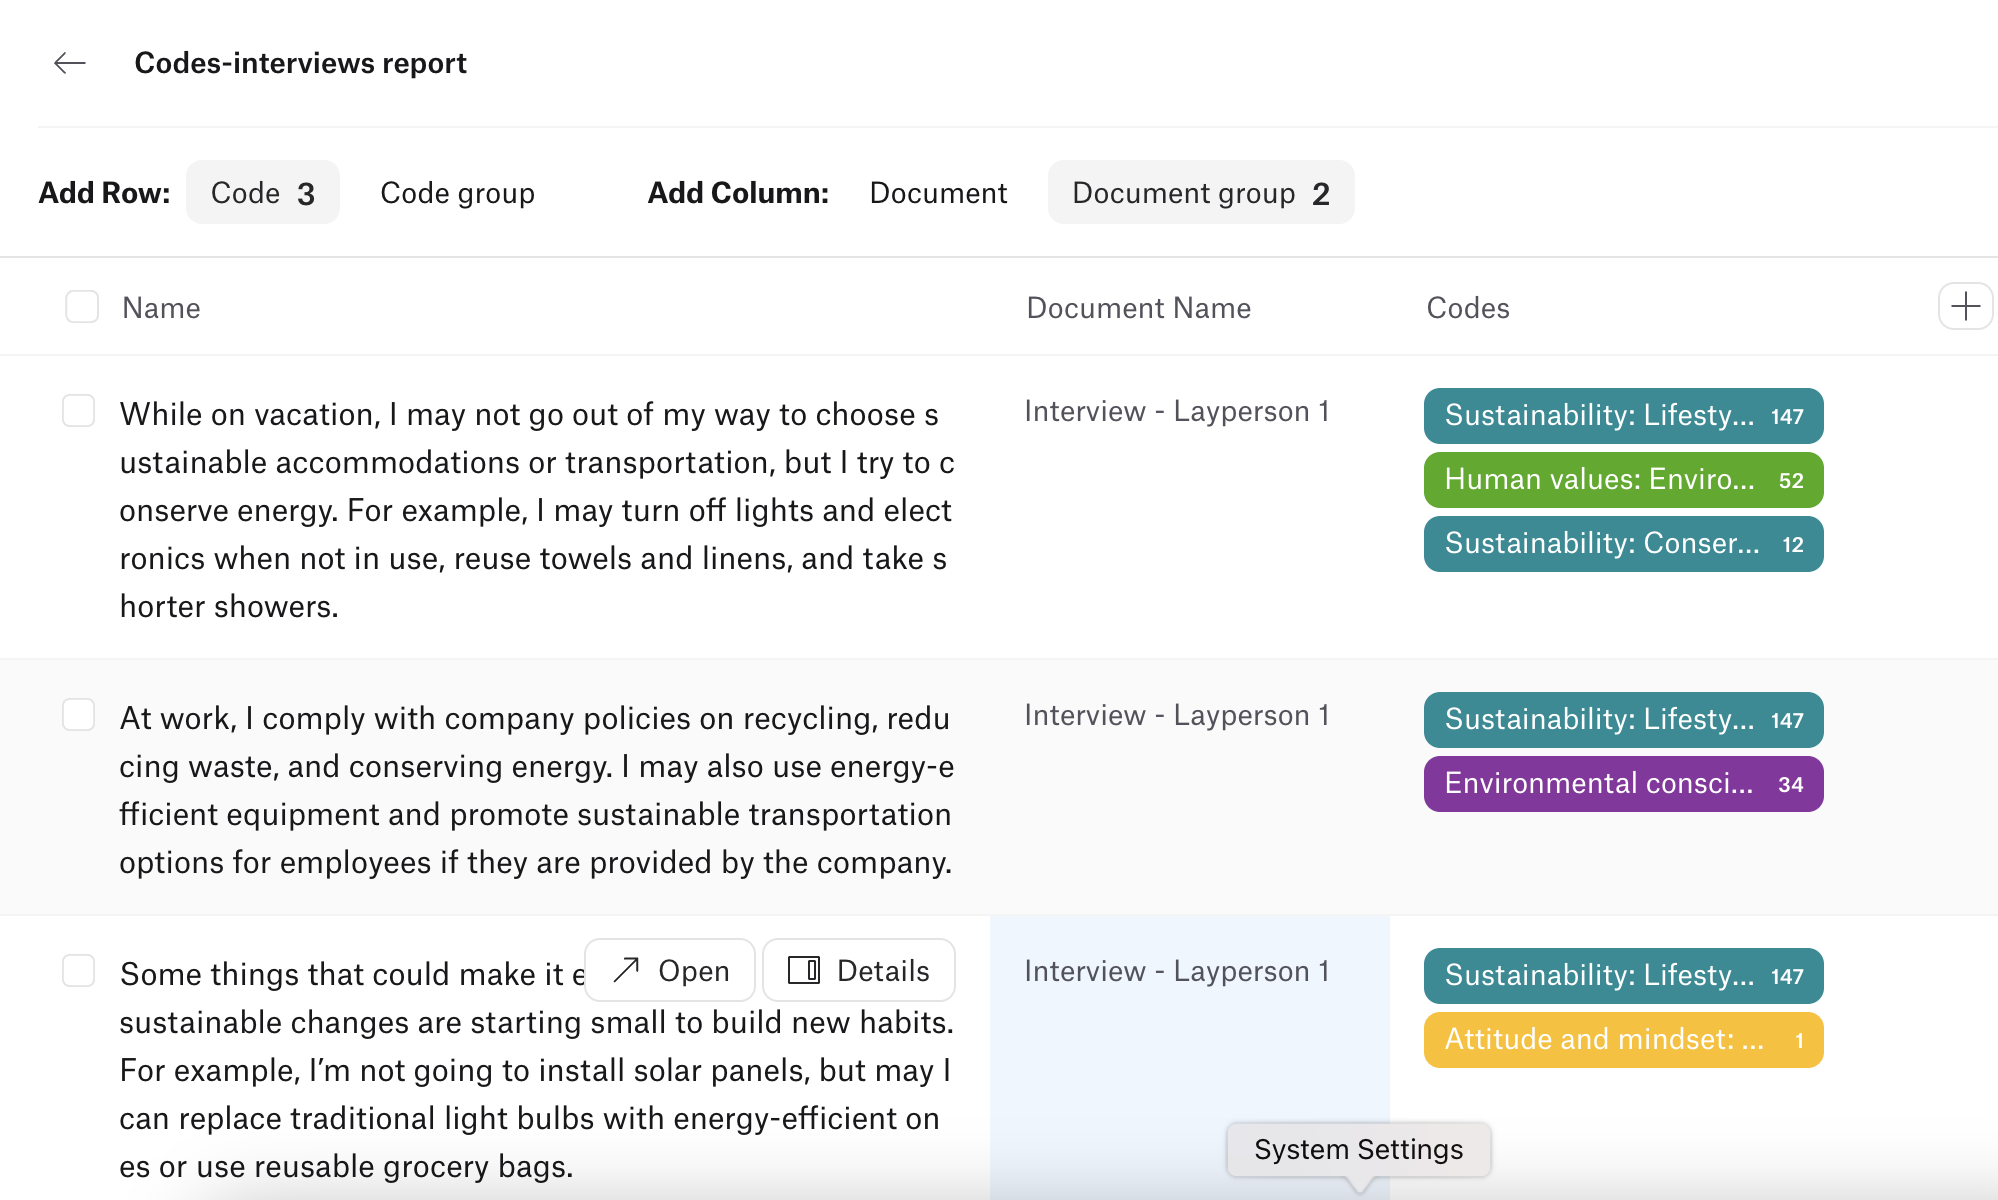
You can choose whether you would like to create a code distribution chart or a Code-Document table. A code distribution chart displays all the codes in descending order of their frequency.
Below the chart, you can see all of the data quotations. By clicking on any code in the chart, ATLAS.ti Web will filter the quotations below to only show quotations that are associated with your selected code(s).
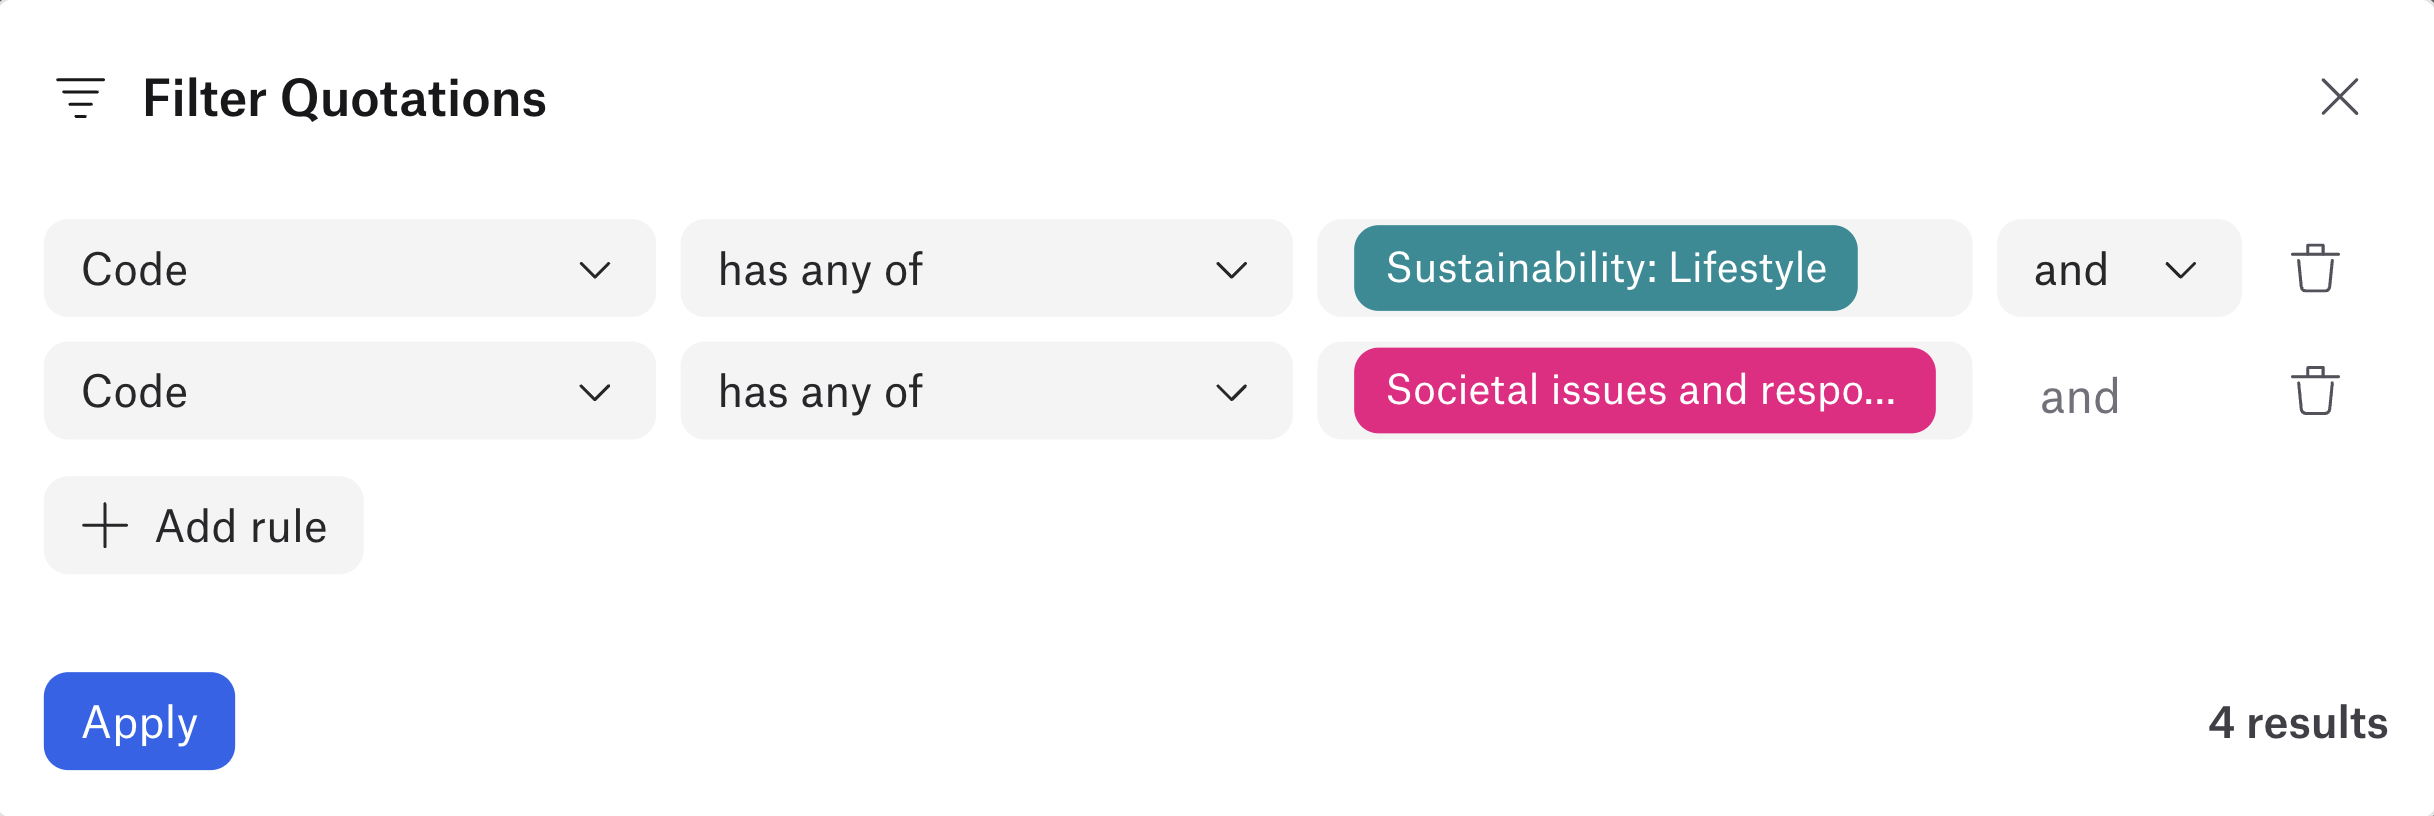
A powerful way to query your project is to apply filter rules. You can filter by the content of quotations, document name, document group, code, code group, comment, and creator, depending on what you want to report in your paper.
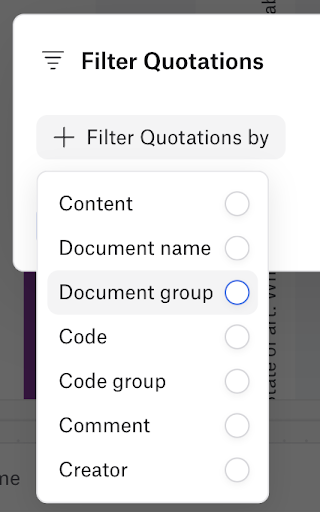
You can add as many filter rules as you would like. For example, if we wanted to see what executive leaders thought about the benefits of using a web-based software, we could set the filters for the document group that contains all data coming from executive leaders and another filter for the code group that contains all the codes about benefits of using a web-based software.
You can also edit the name and comment of this chart view by clicking on the “information” button along the top. You could save a report view for each research question you may be interested in, and these saved report views will automatically update as you continue coding your data. The comment space of the report view offers a perfect space to note down your research question (or the purpose for which you created this report view).
You can save the report to your computer by clicking on the “Download” button. This will generate an Excel spreadsheet of the data quotations, their associated codes and comments, and the document from which each quotation comes.
Code-document table
In addition to examining code distributions, you can construct code-document tables to explore code (or code group) frequencies across your documents (or document groups). In other words, the code-document table lets you see where in your project the different codes are being used.
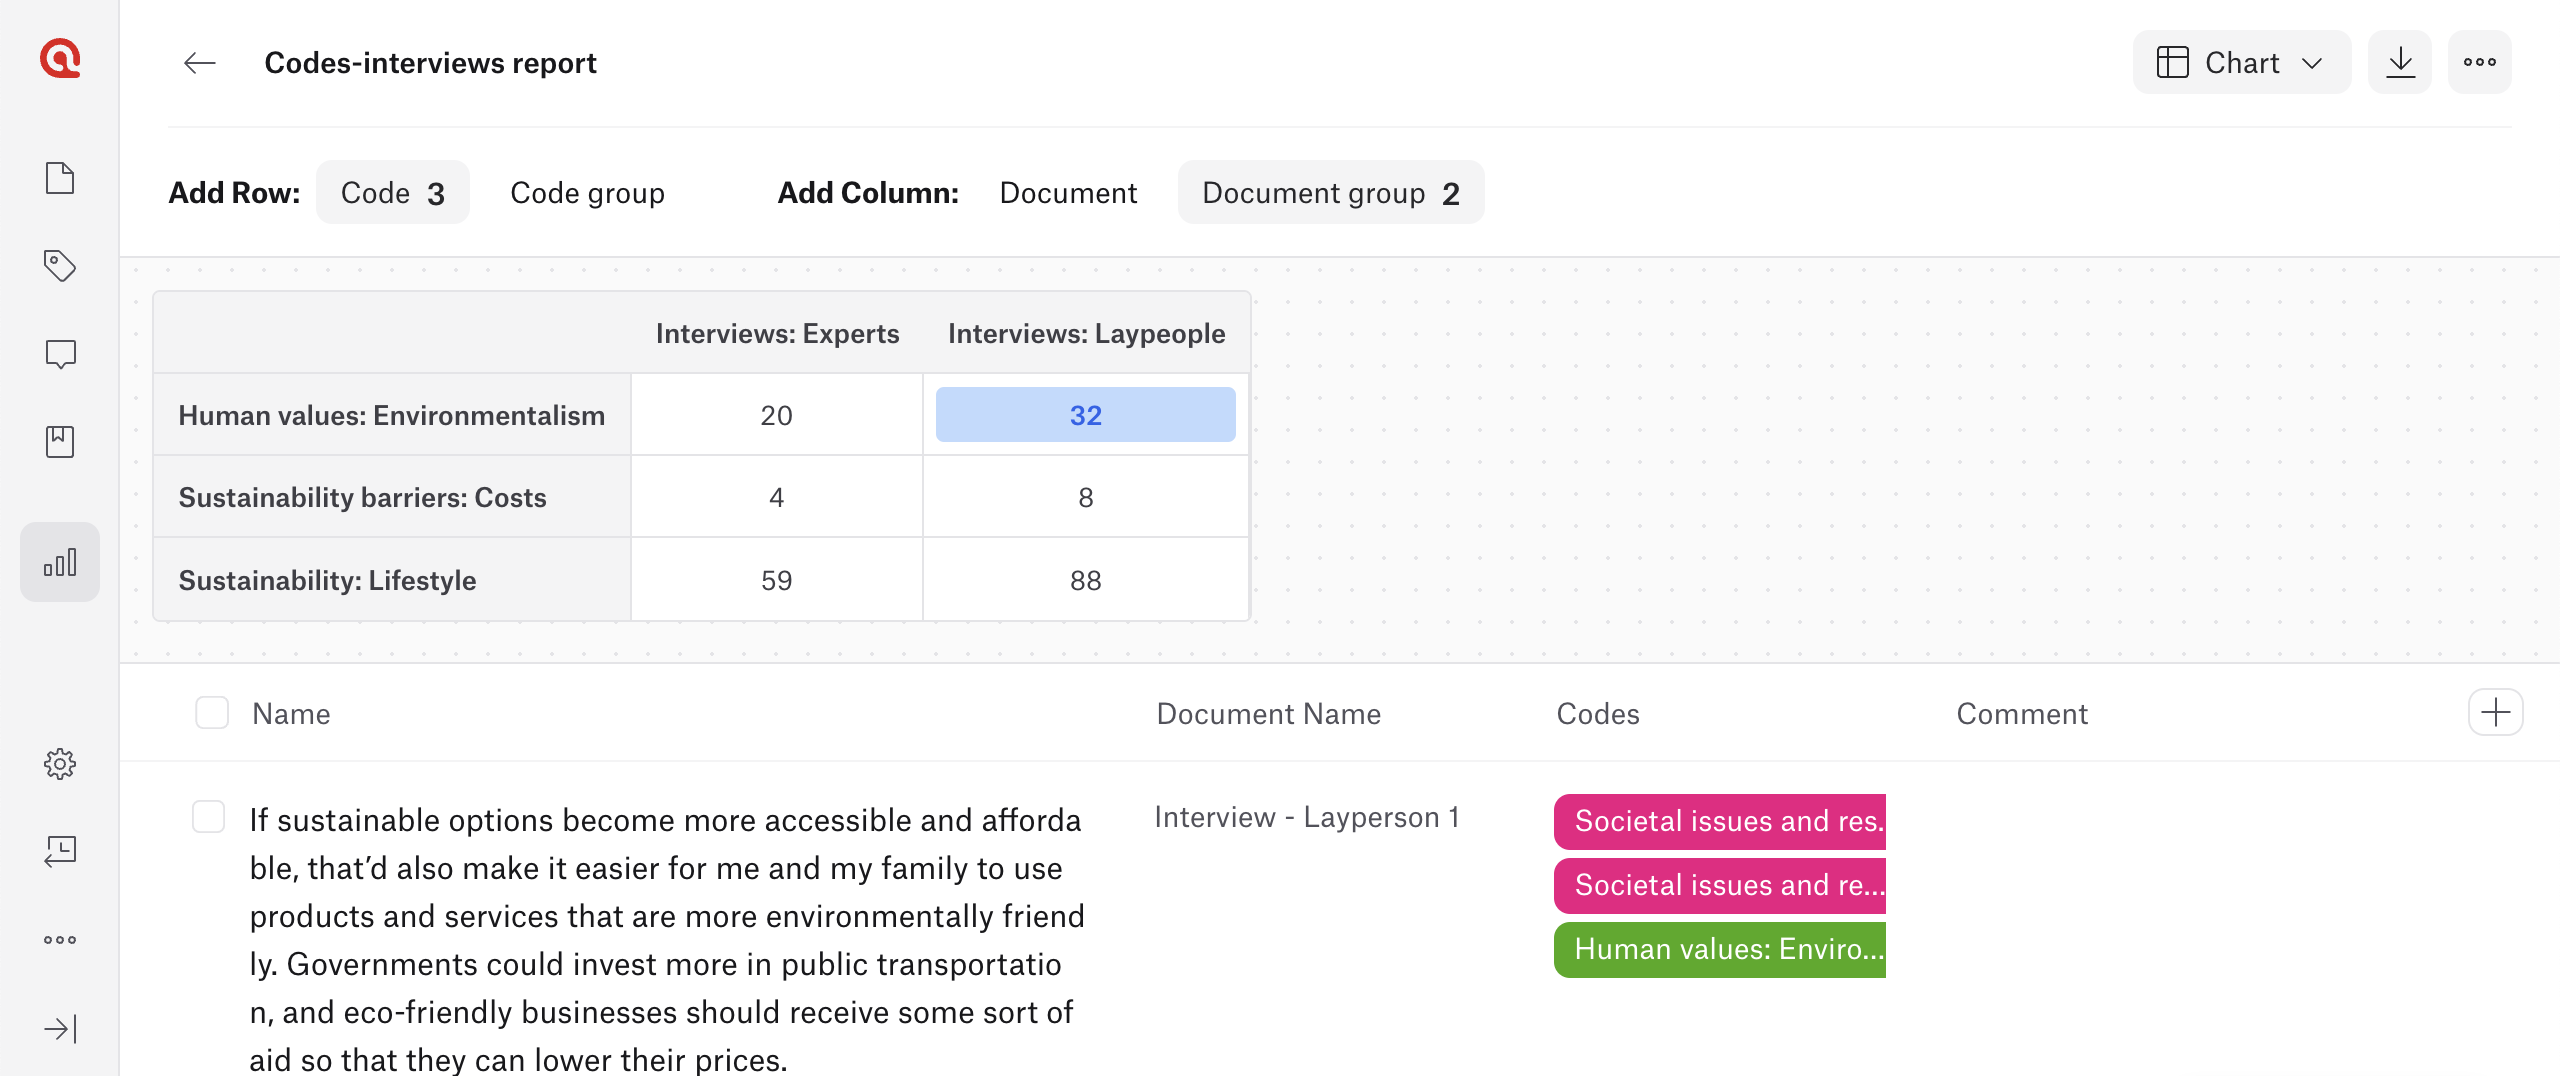
From the code-document table, you can add codes, code groups, documents, and/or document groups. For example, if we wanted to compare which benefits of online tools were mentioned by male and female participants, we could select the individual codes on benefits. Then, we can select the document groups for male and female participants.
The code-document table then shows how many times each code was used across all the data from male and female participants, providing a helpful global overview and permitting comparisons across the data. With this tool, you can construct tables that show the frequencies of your codes and/or code groups, so you can see how many times a certain code (or code group) was used in a particular document (or document group).
Preparing a research paper for publication
While a later section of this guide will deal with the peer review process in research publication, it's important to emphasize the more mundane but equally important concerns of proofreading and formatting guidelines commonly found when you write a research paper. Research publication shouldn't strictly be a test of one's writing skill. Acknowledging the importance of communicating to peer reviewers the credibility of your research means accepting the responsibility of preparing your research manuscript to commonly accepted standards in research.
As a result, seemingly insignificant things such as spelling mistakes, page numbers, and proper grammar can make a difference with a particularly strict reviewer. Even when you expect to develop a paper through reviewer comments and peer feedback, your manuscript should be as close to a polished final draft as you can make it prior to submission. As such, there are a couple of key points to keep in mind.
Matching journal style
A significant responsibility in writing a research paper is matching the expected voice that a journal's editors would prefer to have in their articles. An anthropology journal with an ethnographic focus, for example, might be more interested in language that employs an active voice and a sequence of events in chronological order to draw out the voice of ethnographers as they collect data in the field. A more applied journal might employ a specific set of technical terms with which the target audience is familiar. A journal that adopts a particular theoretical stance might give more weight to primary sources authored by a central scholar in the field.
The point of highlighting these examples is to emphasize the importance of writing for a particular journal in terms of matching their style and aligning with their theoretical underpinnings. Since journals publish articles that they believe will resonate with (or at least provoke discussion among) their readership, a successful research writer will have studied their ideal journals to emulate the sort of voice that will align with the reviewers' expectations.
Following formatting guidelines
As boring as this part of the writing process may be, journals often adopt a system that requires a set of standards that every submission should meet before it can be considered by reviewers. Differences between submissions in terms of form might pose challenges to reviewers who review multiple submissions for a journal, so the journal establishes standards to help streamline the process.
A journal's required citation style, for example, might depend on the field it's in or the preferences the editors and reviewers may have. A journal might prescribe a page limit or word limit that needs to be strictly observed. Pages might need to be formatted with a particular size of margin, font, and font size. Tables and figures should be placed either in the document or as separate entities in the submission package.
A journal's submission guidelines can be very exacting in terms of formatting. Ironically, because it is such a mundane topic, there is very little, if any, room for negotiation for a research writer to exercise any creativity in the formatting process. The important point here is to carefully read the requirements of your target journal.
Preparing a cover letter
In the pre-Internet days of scholarly research, research papers would be submitted to journals by traditional postal mail, complete with a cover letter on a separate page to detail the key elements of the submission package and assert the value of the research contained within.
While online submissions essentially make the cover letter irrelevant, some journals still recommend or even require one, making it necessary for researchers to give some thought as to what to write.
What can proofreading do for your paper?
As the section on the review process will emphasize, scholarly publishing is a human endeavor, involving editors and reviewers who are humans. We humans have good days and bad days, and on our worst days, the simplest things like a spelling mistake or a bad word choice might set us off.
As insignificant as typos may be in the grand scheme of scholarly research, there's no reason to take a risk by not polishing your paper as much as possible prior to submission. For that task, you can either decide to proofread your paper with the help of software or rely on a professional service that will do it for you. Both have their benefits and drawbacks.
Proofreading software
A simple grammar check in a word processing program may be sufficient for addressing the simplest or most noticeable typos. Better still, there are dedicated proofreading programs that can not only look at spelling and grammar but also style appropriate for academic research.
Such solutions are free or relatively inexpensive and provide quick proofreading as opposed to professional services that could take days or even weeks. The catch is that automated proofreading cannot give feedback specifically tailored to the language in your field. Words and names that are specific to a particular research area may look like spelling mistakes to a proofreading program, requiring researchers to carefully look at the feedback that software gives them before making potentially consequential changes.
Professional proofreading services
When you need human eyes to double-check your work before submitting to a journal, there are a number of proofreading services that can look at your paper in significant detail. This is useful for research writers for whom the journal's language is not their first language or when the text of the paper is too specialized for an automated spell check or grammar check.
Naturally, these services can be expensive as they often employ proofreaders familiar with the research writing process and with the terminology and concepts specific to your research field. Nonetheless, if you need some professional guidance on scholarly writing, using a professional service might be your best option.