


- Introduction and overview
- What is qualitative research?
- What is qualitative data?
- Examples of qualitative data
- Qualitative vs. quantitative research
- Mixed methods
- Qualitative research preparation
- Theoretical perspective
- Theoretical framework
- Literature reviews
- Research question
- Conceptual framework
- Conceptual vs. theoretical framework
- Data collection
- Qualitative research methods
- Interviews
- Focus groups
- Observational research
- Case studies
- Surveys
- Ethnographical research
- Ethical considerations
- Confidentiality and privacy
- Bias
- Power dynamics
- Reflexivity
- How to cite "The Ultimate Guide to Qualitative Research - Part 1: The Basics"
What is qualitative data?
When you think of the word "data," you might think about numbers and tables and organized spreadsheets. Qualitative data, on the other hand, can take on so many forms and serve so many purposes that it's important to examine the topic in greater detail.

What is qualitative data?
Qualitative research methods collect unstructured or unorganized data that is often difficult to define statistically or numerically. There are many uses for collecting and analyzing qualitative data, such as understanding social phenomena, gathering people's opinions on various subjects, and building evidence for recommendations. Ultimately, researchers will need to organize and categorize qualitative data in order to perform qualitative data analysis.
Why collect qualitative data?
Qualitative and quantitative data are almost always juxtaposed against each other. Data generated from quantitative research lends itself to statistical analysis, while qualitative data contextualizes a concept or phenomenon by describing its constituent elements.
For example, consider the difference between comparing the average temperatures of two different cities and comparing the innate beauty of those two cities. The former can be quantified so that researchers can reach a quick conclusion about the differences in the climate. On the other hand, the latter is rather difficult to reduce to numbers. Even if beauty can be placed on a ten-point scale, what does "7 points" or "4 points" on the beauty scale mean? How does someone determine such a score? Understanding the beauty of a particular city requires collecting qualitative data.

Where is qualitative data used?
Many different kinds of researchers, such as anthropologists, professionals engaged in health services research, and market researchers, collect and analyze qualitative data. While the method of collecting data in each area may differ, fields that commonly utilize qualitative data have research questions that an analysis of numerical data cannot easily answer.
Advantages and disadvantages of qualitative data
Researchers often perceive a divide between qualitative data and quantitative data and get into debates about which form of data is "better." The more important task is to collect relevant data for your research. Let's consider the pros and cons of qualitative data.
Advantages
Qualitative data helps offer in-depth analysis and a more nuanced understanding of phenomena than quantitative data can provide. For example, statistics can tell us the average test scores for each school whose students took a standardized test. Comparisons of average scores can give us information about which schools are more successful or are struggling. Further statistical analysis can indicate a correlation between school funding and test performance.

However, these statistics are less likely to point out the causes leading to these test results. A qualitative study gathers data that can supplement those test scores with further context, such as teachers' instructional practices, students' opinions about learning activities, and funding for educational resources.

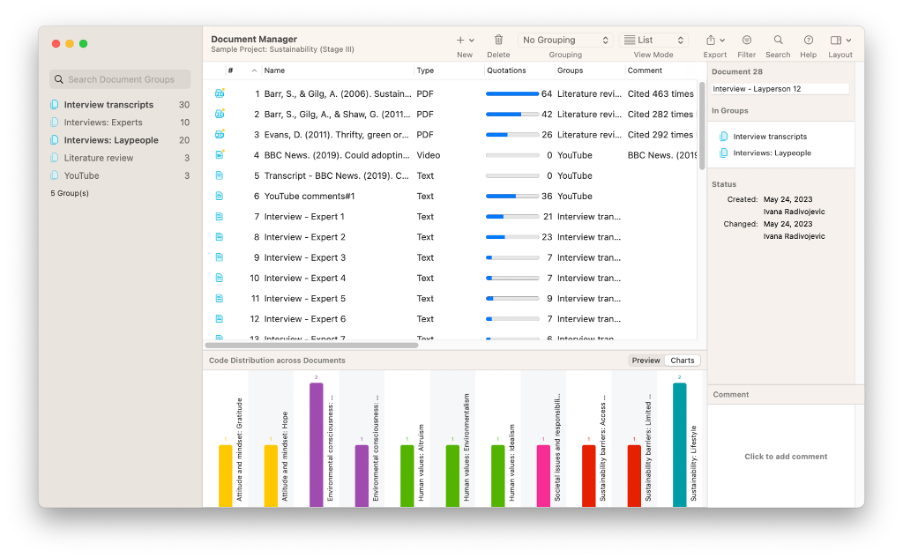
An analysis of qualitative data can allow researchers to draw relationships between ideas. This is accomplished by "coding" the data for ideas. Coding qualitative data involves looking at your data and applying short, descriptive labels called codes to segments of text, images, audio, or video for later analysis. With systematic coding, you can turn your raw data into an organized, meaningful data set from which you can draw insightful conclusions.
Suppose the study above involves interviewing students about their test performance and teachers. A researcher can code all of the instances where students describe their teacher as "nice," "helpful," or "strict." Qualitative data analysis software like ATLAS.ti helps researchers with the coding process so that themes emerging from the data become easier to understand.
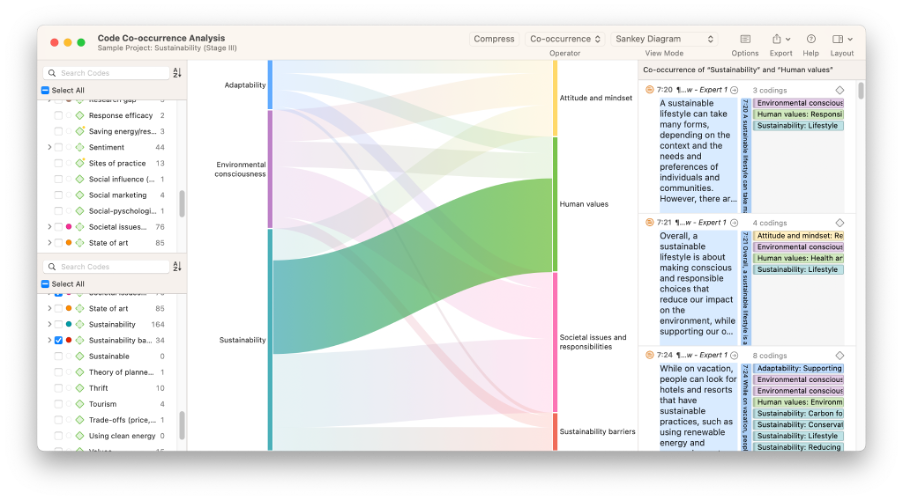
Researchers can then conduct qualitative data analysis by determining whether the well-performing or struggling students have a specific set of keywords that describe their teachers' personalities. If so, the researcher can propose a connection between a teacher's personality characteristics and their students' test scores.
Disadvantages
The main disadvantage of using qualitative data is that the analysis can be complex and time-consuming. On the other hand, quantitative data is relatively straightforward to collect and analyze. Because qualitative data cannot easily be reduced to numbers or statistics, researchers need to reorganize the data in more structured and meaningful ways for analysis. A qualitative researcher often has to read their data line by line to determine what information to code and how.

Another concern that critics of qualitative research point to is researchers' potential biases and subjectivities when analyzing qualitative data. The reorganization and analysis of the data must be presented clearly and transparently so that research audiences can easily understand the analysis and assess the credibility of the subsequent conclusions themselves.
Qualitative and quantitative data
The research objectives you want to pursue will dictate how you should collect data and what data you should collect.
Quantitative data
Let's say you are conducting an experimental study to determine the effectiveness of a nutritional supplement in helping people lose weight. In this case, you will likely collect quantitative data such as weight, caloric intake, and time spent exercising. Quantitative data like these can be analyzed statistically to help you understand if research participants are losing weight because of the supplement.
Qualitative data
On the other hand, you may also want to gather opinions on whether people are satisfied with the supplement. Qualitative data collection methods such as interviews or focus groups might ask research participants what they think the supplement tastes like, how they feel after taking it, and why they believe it is effective or not effective. Answers to these questions don't provide easy numbers or simple statistics.

Still, these insights are just as important to product researchers because even if the supplement is effective, people may choose not to buy it if it leads to unpleasant experiences. Qualitative data is valuable to researchers when they need to know more about an unfamiliar phenomenon and when understanding the phenomenon requires more complexity than a simple yes/no binary or a numerical scale can provide. Instead, a thematic analysis of qualitative data on the subject might explore the emotions (e.g., happy, frustrated) associated with each particular taste (e.g., sweet, sour, bitter).
Mixed methods research
You may want to consider a mixed methods approach to research and thus combine quantitative and qualitative data collection methods. Researchers can best understand a complex problem by collecting various types of data collected on the subject. In the example above, the successful launch of a nutritional supplement depends on its effectiveness and customer satisfaction. One is only particularly helpful if the other is also present. Ultimately, it is essential to consider whether you are collecting the right kinds of data for the research inquiry you want to pursue.
Qualitative data collection
A researcher can employ various qualitative methods to collect qualitative data. As a result, numerous types of qualitative data can be used for data analysis.
Questionnaires
Questionnaires or surveys are among the easiest methods for collecting large-scale qualitative and quantitative data. In addition to capturing quantitative data for statistical analysis, questionnaires can also be used to collect open-ended answers from respondents.
For example, researchers can ask respondents to rate their satisfaction with a particular product on a scale of 1 to 5 and then write down their reasons for their ratings. Qualitative data analysis can reveal sentiments about a product among respondents who are very satisfied with it and compare sentiments among unsatisfied respondents.
Interviews
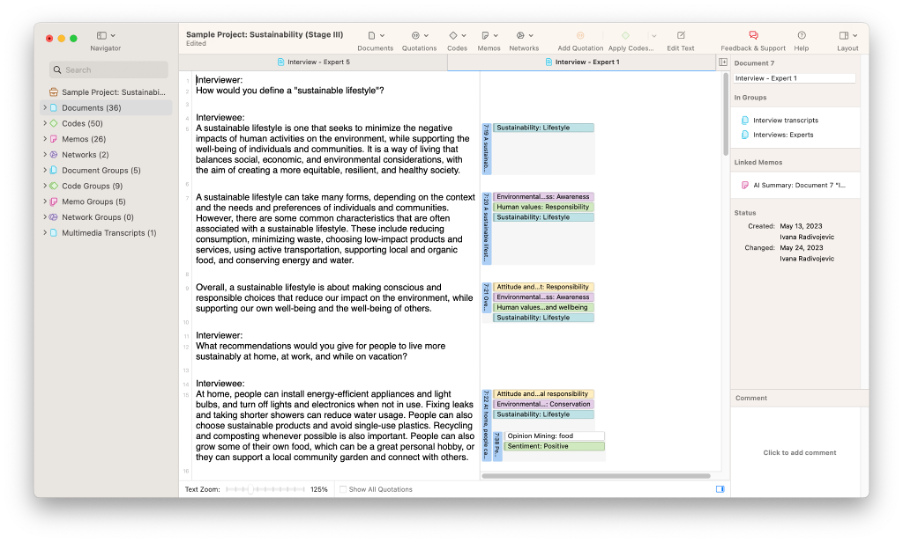
Qualitative data from in-depth interviews often involve transcripts and audio or video recordings. Transcription converts interviews into text that can be read and cited in documents and presentations when you want the audience to see what research respondents have said.

Recordings are also valuable as they allow researchers to see respondents' facial expressions and gestures or hear their non-verbal utterances. This qualitative data analysis helps researchers better understand how respondents feel (e.g., excited, upset, confused) during interviews.
Focus groups
Focus groups are similar to interviews except that multiple respondents talk simultaneously with the interviewer. Similarly to interviews, qualitative data from focus groups can be analyzed from transcripts or multimedia recordings. The recordings can have significant value for qualitative research because they can capture how focus group respondents interact or collaborate.
Observations
An observational research method can conduct data collection on a particular social phenomenon in a less controlled environment than where interviews or focus groups would be conducted. Collecting such naturalistic qualitative data in the field can help researchers who want to see the social world outside of a confined experiment. Researchers can collect various forms of data, such as audio or video recordings, the observers' field notes, and photographs. The type of research you want to conduct will help you determine which data collection methods to employ.

For example, if you are at a train station, you may want to record audio of train station announcements or record field notes about how easy or difficult it may be to navigate the station. Additionally, taking pictures or videos while walking around the train station may be valuable to later analyze what you see.

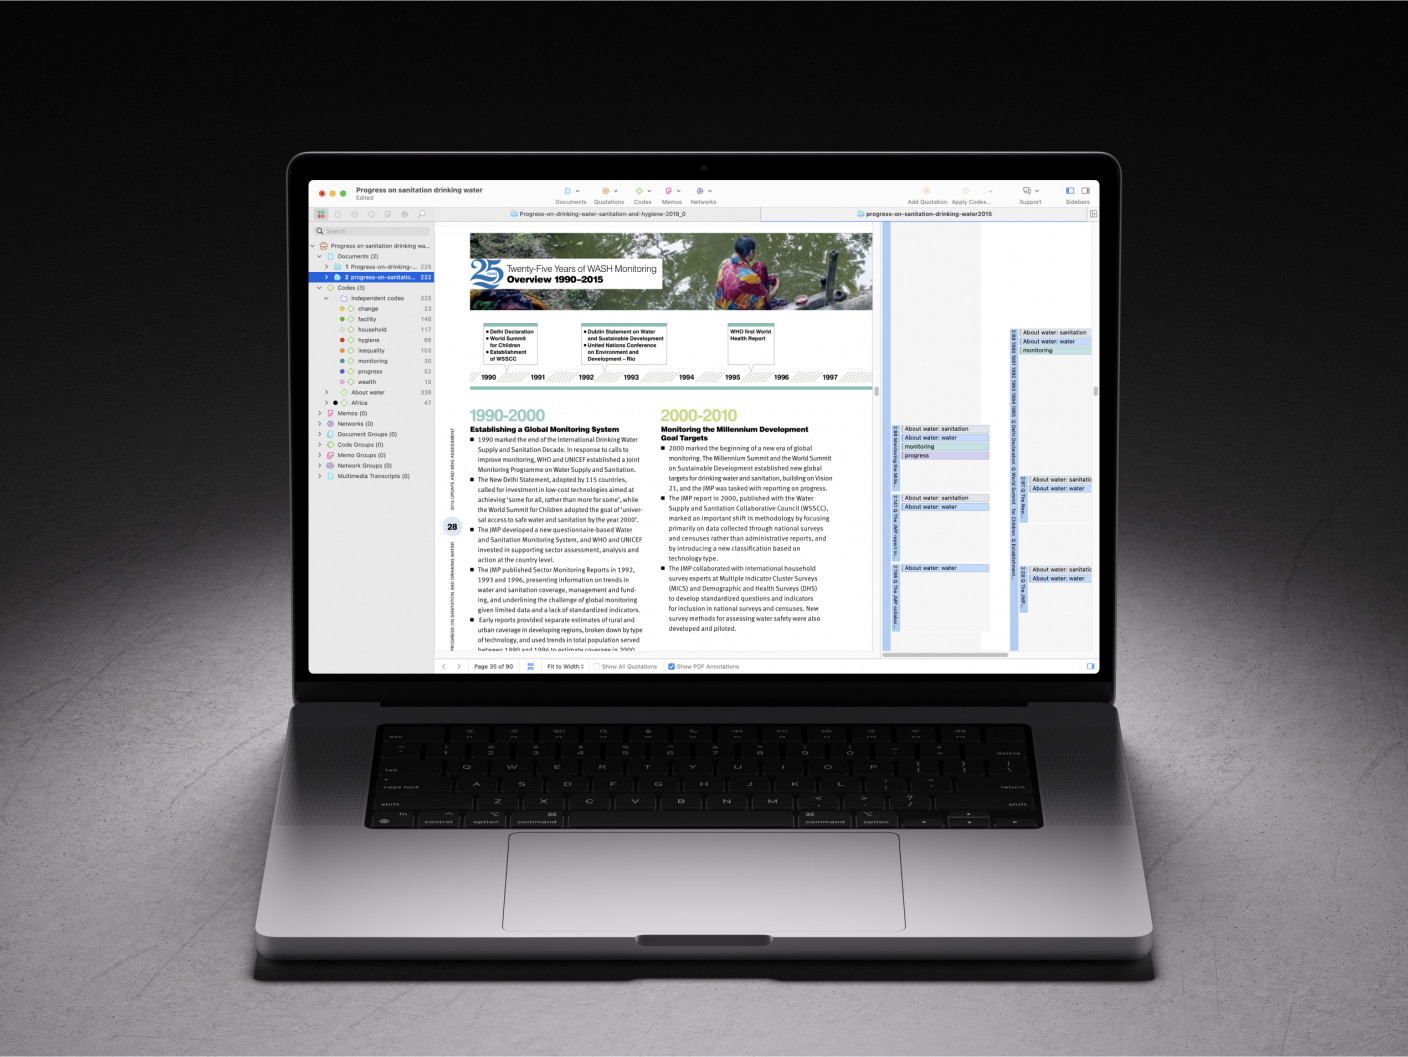
Document analysis
Any textual data, such as medical records, journal articles, and website pages, can be analyzed qualitatively. Collecting documents is useful to researchers looking to conduct a comparative analysis, thematic review, or user research. Researchers can analyze documents for their text, images, or other features depending on the inquiry they want to conduct.
Social media analysis
Content from Twitter, Instagram, and other similar platforms can provide abundant opportunities for qualitative analysis. ATLAS.ti allows researchers to import tweets directly into their project as well as comments from any social media post, such as Instagram, TikTok, Facebook, and so on. Researchers can easily search and incorporate any tweets or comments as qualitative data instantly.
Ethical considerations for qualitative data
Researchers should always be careful with collecting and handling qualitative data, especially if it contains personal information or needs to be obtained with consent. People's perspectives are simplified and aggregated into numbers when quantitative analysis is pursued, but qualitative data collection often preserves the words, circumstances, and behaviors of people, and participants may feel uncomfortable with how such data might be used. An important consideration is how the researcher should present the data to their audiences while not revealing any clues about participants' identities.
Medical records, for example, are especially sensitive as people can connect names to health conditions that patients may prefer to keep secret. In observations, people may not want their pictures taken if they don't want to be associated with being in a particular place. Respondents in interviews and focus groups may choose to withdraw from research after having said something about which they feel embarrassed or uncomfortable.

Before collecting any data, researchers should obtain informed consent from participants to ensure that participants understand their rights and how their privacy is protected. This might be a challenge in observations, especially when they occur outside a controlled environment. When collecting data in the field, researchers might consider avoiding taking pictures or videos of people's faces, recognizable clothing, or possessions. As a result, field notes might be the most appropriate form of data to collect while observing in the field.
Even if research participants give informed consent, there is always the possibility they might say something sensitive or provide information that they later wish they hadn’t. Researchers should always take precautions when collecting data from research participants to ensure that potentially damaging information isn't disseminated in research presentations or academic publications.
By thoughtfully engaging with rigorous data collection methods, researchers can collect rich data that provides novel insights and offers participants a chance to meaningfully express themselves.