
- Handling qualitative data
- Transcripts
- Field notes
- Memos
- Survey data and responses
- Visual and audio data
- Data organization
- Data coding
- Coding frame
- Auto and smart coding
- Organizing codes
- Qualitative data analysis
- Content analysis
- Thematic analysis
- Narrative research
- Phenomenological research
- Discourse analysis
- Grounded theory
- Deductive reasoning
- Inductive reasoning
- Inductive vs. deductive reasoning
- Qualitative data interpretation
- Qualitative data analysis software
- How to cite "The Ultimate Guide to Qualitative Research - Part 2"
- Thematic analysis vs. content analysis
Coding qualitative data for valuable insights
Qualitative researchers, at one point or another, will inevitably find themselves involved in coding their data. The coding process can be arduous and time-consuming, so it's essential to understand how coding contributes to the understanding of knowledge in qualitative research.
Qualitative data
Qualitative research tends to work with unstructured data that requires some systematic organization to facilitate insights relevant to your research inquiry. Suppose you need to determine the most critical aspects for deciding what hotel to stay in when you go on vacation. The decision process that goes into choosing the "best" hotel can be located in various and separate places (e.g., travel websites, blogs, personal conversations) and scattered among pieces of information that may not be relevant to you. In qualitative research, one of the goals prior to data analysis is to identify what information is important, find that information, and sort that information in a way that makes it easy for you to come to a decision.

Coding qualitative data
Qualitative coding is almost always a necessary part of the qualitative data analysis process. Coding provides a way to make the meaning of the data clear to you and to your research audience.
What is a code?
A code in the context of qualitative data analysis is a summary of a larger segment of text. Imagine applying a couple of sticky notes to a collection of recipes, marking each section with short labels like "ingredients," "directions," and "advice." Afterward, someone can page through those recipes and easily locate the section they are looking for, thanks to those sticky notes.
Now, suppose you have different colors of sticky notes, where each color denotes a particular cuisine (e.g., Italian, Chinese, vegetarian). Now, with two ways to organize the data in front of you, you can look at all of the ingredient sections of all the recipes belonging to a cuisine to get a sense of the items that are commonly used for such recipes.
As illustrated in this example, one reason someone might apply sticky notes to a recipe is to help the reader save time in getting the desired information from that text, which is essentially the goal of qualitative coding. Coding allows a reader to get the information they are looking for to facilitate the analysis process. Moreover, this process of categorizing the different pieces of data helps researchers see what is going on in their data and identify emerging dimensions and patterns.
The use of codes also has a purpose beyond simply establishing a convenient means to draw meaning from the data. When presenting qualitative research to an audience, researchers could rely on a narrative summary of the data, but such narratives might be too lengthy to grasp or difficult to convey to others.
As a result, researchers in all fields tend to rely on data visualizations to illustrate their data analysis. Naturally, suppose such visualizations rely on tables and figures like bar charts and diagrams to convey meaning. In that case, researchers need to find ways to "count" the data along established data points, which is a role that coding can fulfill. While a strictly numerical understanding of qualitative research may overlook the finer aspects of social phenomena, researchers ultimately benefit from an analysis of the frequency of codes, combinations of codes, and patterns of codes that can contribute to theory generation. In addition, codes can be visualized in numerous ways to present qualitative insights. From flow charts to semantic networks, codes provide researchers with almost limitless possibilities in choosing how to present their rich qualitative data to different audiences.
Applying codes
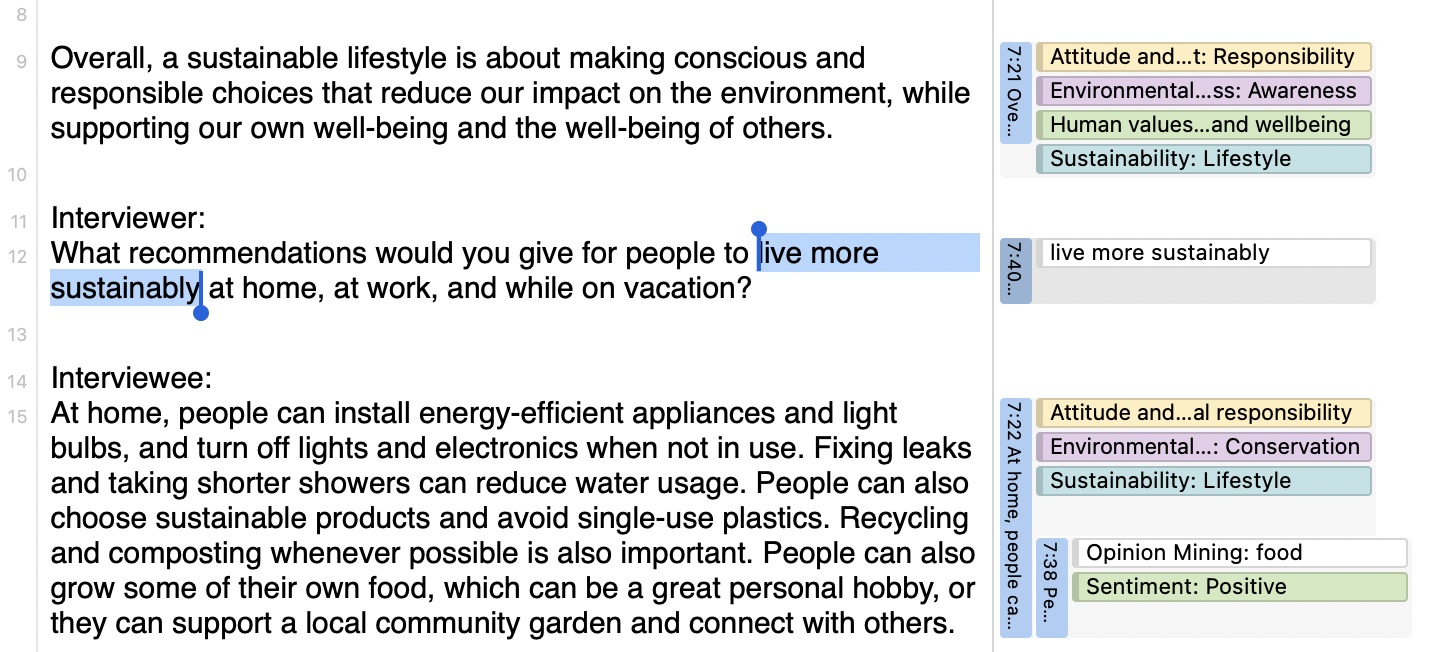
To engage in coding, a researcher looks at the data line-by-line and develops a codebook by identifying data segments that can be represented by words or short phrases.
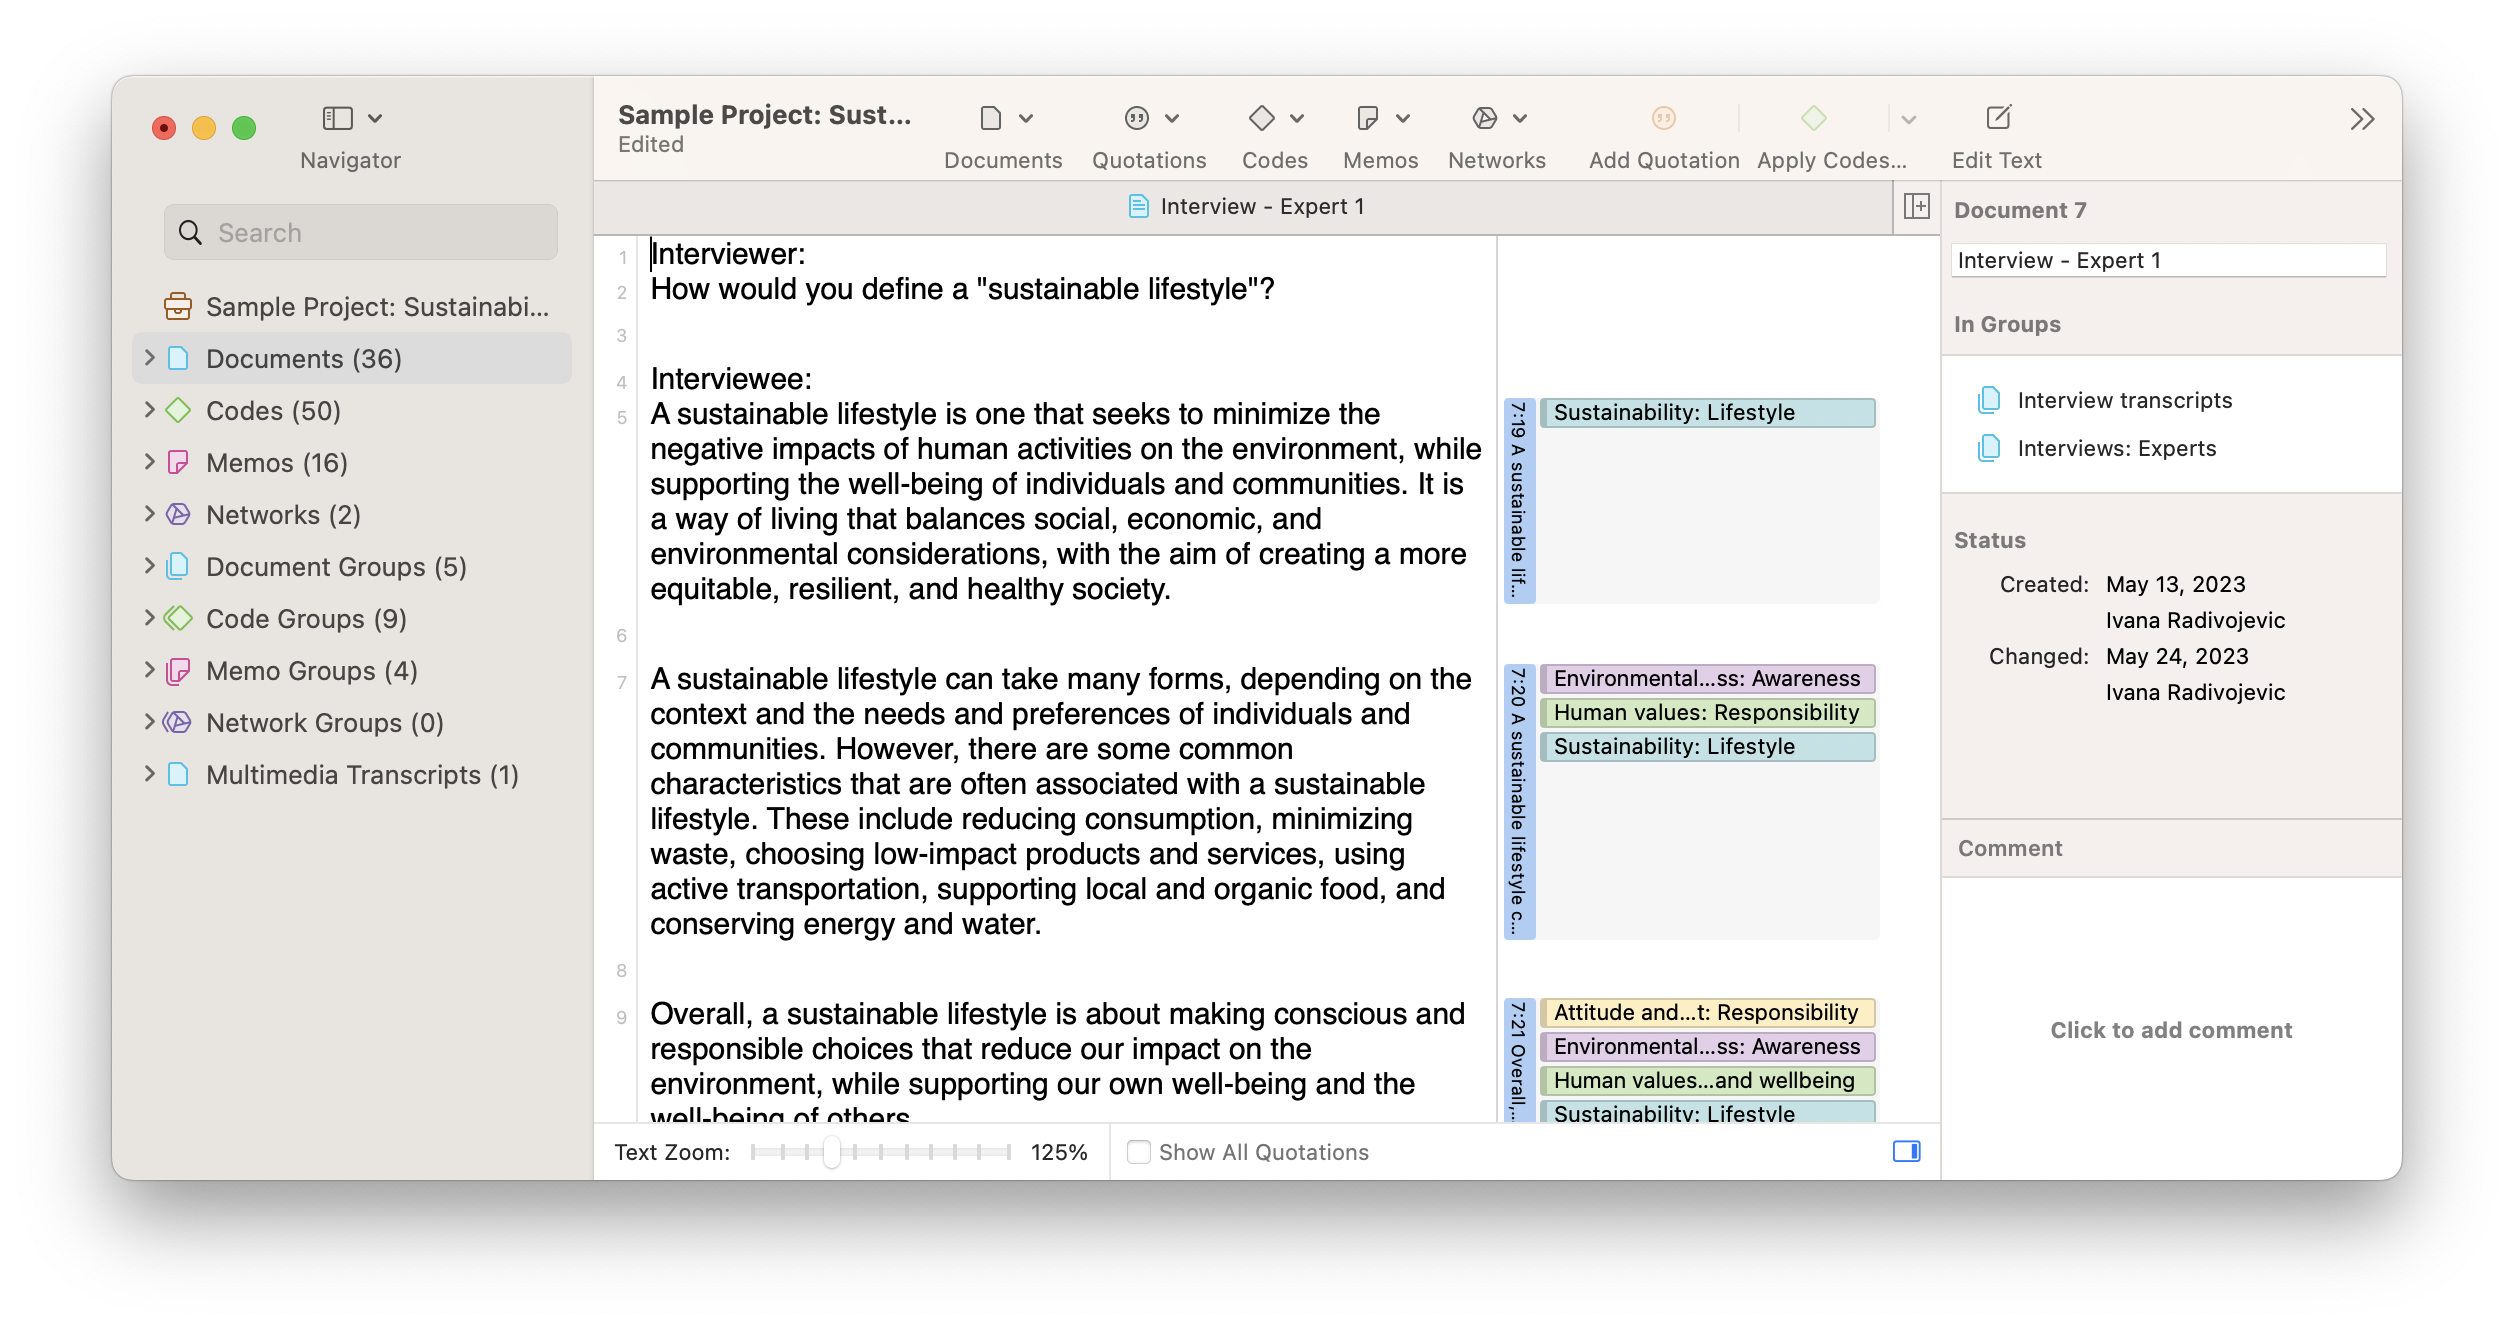
In the example above, a set of three paragraphs is represented by one code displayed in green in the right margin. Without codes, the researcher might have to re-read all of the text to remind themselves what the data is about. Indeed, any researcher who examines the codebook of a project can glean a sense of the data and analysis.
Analyzing codes
Think of a simple example to illustrate the importance of analyzing codes. Suppose you are analyzing survey responses for people's preferences for shopping in brick-and-mortar stores and shopping online. In that case, you might think about marking each survey response as either "prefers shopping in-person" or "prefers shopping online." Once you have applied the relevant codes to each survey response, you can compare the frequencies of both codes to determine where the population as a whole stands on the subject.
Among other things, codes can be analyzed by their frequency or their connection to other codes (or co-occurrence with other codes). In the example above, you may also decide to code the data for the reasons that inform people's shopping habits, applying labels such as "convenience," "value," and "service." Then, the analysis process is simply a matter of determining how often each reason co-occurs with preferences for in-person shopping and online shopping by analyzing the codes applied to the data.
As a result, qualitative coding transforms raw data into a form that facilitates the generation of deeper insights through empirical analysis.
That said, coding is a time-consuming, albeit necessary, task in qualitative research and one that researchers have developed into an array of established methods that are worth briefly looking at.
Coding methods
Years of development of qualitative research methods have yielded multiple methods for assigning codes to data. While all qualitative coding approaches essentially seek to summarize large amounts of information succinctly, there are various approaches you can apply to your coding process.
Inductive coding
Probably the most basic form of coding is to look at the data and reduce it to its salient points of information through coding. Any inductive approach to research involves generating knowledge from the ground up. Inductive coding, as a result, looks to generate insights from the qualitative data itself.
Inductive coding benefits researchers who need to look at the data primarily for its inherent meaning rather than for how external frameworks of knowledge might look at it. Inductive coding can also provide a new perspective that established theory has yet to consider, which would make a theory-driven approach inappropriate.
Deductive coding
A deductive approach to coding is also useful in qualitative research. In contrast with inductive coding, a deductive coding approach applies an existing research framework or previous research study to new data. This means that the researcher applies a set of predefined codes based on established research to the new data.
Researchers can benefit from using both approaches in tandem if their research questions call for a synthesized analysis. Returning to the example of a cookbook, a person may mark the different sections of each recipe because they have prior knowledge about what a typical recipe might look like. On the other hand, if they come across a non-typical recipe (e.g., a recipe that may not have an ingredients section), they might need to create new codes to identify parts of the recipe that seem unusual or novel.
Employing both inductive coding and deductive coding, as a result, can help you achieve a more holistic analysis of your data by building on existing knowledge of a phenomenon while generating new knowledge about the less familiar aspects.
Thematic analysis coding
Whether you decide to apply an inductive coding or deductive coding approach to qualitative data, the coding should also be relevant to your research inquiry in order to be useful and avoid a cumbersome amount of coding that might defeat the purpose of summarizing your data. Let's look at a series of more specific approaches to qualitative coding to get a wider sense of how coding has been applied to qualitative research.
The goal of a thematic analysis arising from coding, as the name suggests, is to identify themes revolving around a particular concept or phenomenon. While concepts in the natural sciences, such as temperature and atomic weight, can be measured with numerical data, concepts in the social sciences often escape easy numerical analysis. Rather than reduce the beauty of a work of art or proficiency in a foreign language down to a number, thematic analysis coding looks to describe these phenomena by various aspects that can be grouped together within common themes.
Looking at the recipe again, we can describe a typical recipe by the sections that appear the most often. The same is true for describing a sport (e.g., rules, strategies, equipment) or a car (e.g., type, price, fuel efficiency, safety rating). While later analysis might be able to numerically measure these themes if they are particular enough, the role of coding along the lines of themes provides a good starting point for recognizing and analyzing relevant concepts.
Process coding
Processes are phenomena that are characterized by action. Think about the act of driving a car rather than describing the car itself. In this case, process coding can be thought of as an extension of thematic coding, except that the major aspects of a process can also be identified by sequences and patterns, on the assumption that some actions may follow other actions. After all, drivers typically turn the key in the ignition before releasing the parking brake or shifting to drive. Capturing the specific phases and sequences is a key objective in process coding.
Structural coding
The "structure" of a recipe in a cookbook is different from that of an essay or a newspaper article. Also, think about how an interview for research might be structured differently from an interview for a TV news program. Researchers can employ structural coding to organize the data according to its distinct structural elements, such as specific elements, the ordering of information, or the purpose behind different structures. This kind of analysis could help, for instance, to achieve a greater understanding of how cultures shape a particular piece of writing or social practice.
Longitudinal coding
Studies that observe people or practices over time do so to capture and understand changes in dynamic environments. The role of longitudinal coding is to also code for relevant contextual or temporal aspects. These can then be analyzed together with other codes to assess how frequencies and patterns change from one observation or interview to the next. This will help researchers empirically illustrate differences or changes over time.
Using ATLAS.ti for qualitative data coding
Qualitative data analysis software should effectively facilitate qualitative coding. Researchers can choose between manual coding and automated coding, where tools can be employed to suggest and apply codes to save time. ATLAS.ti is ideal for both approaches to suit researchers of all needs and backgrounds.
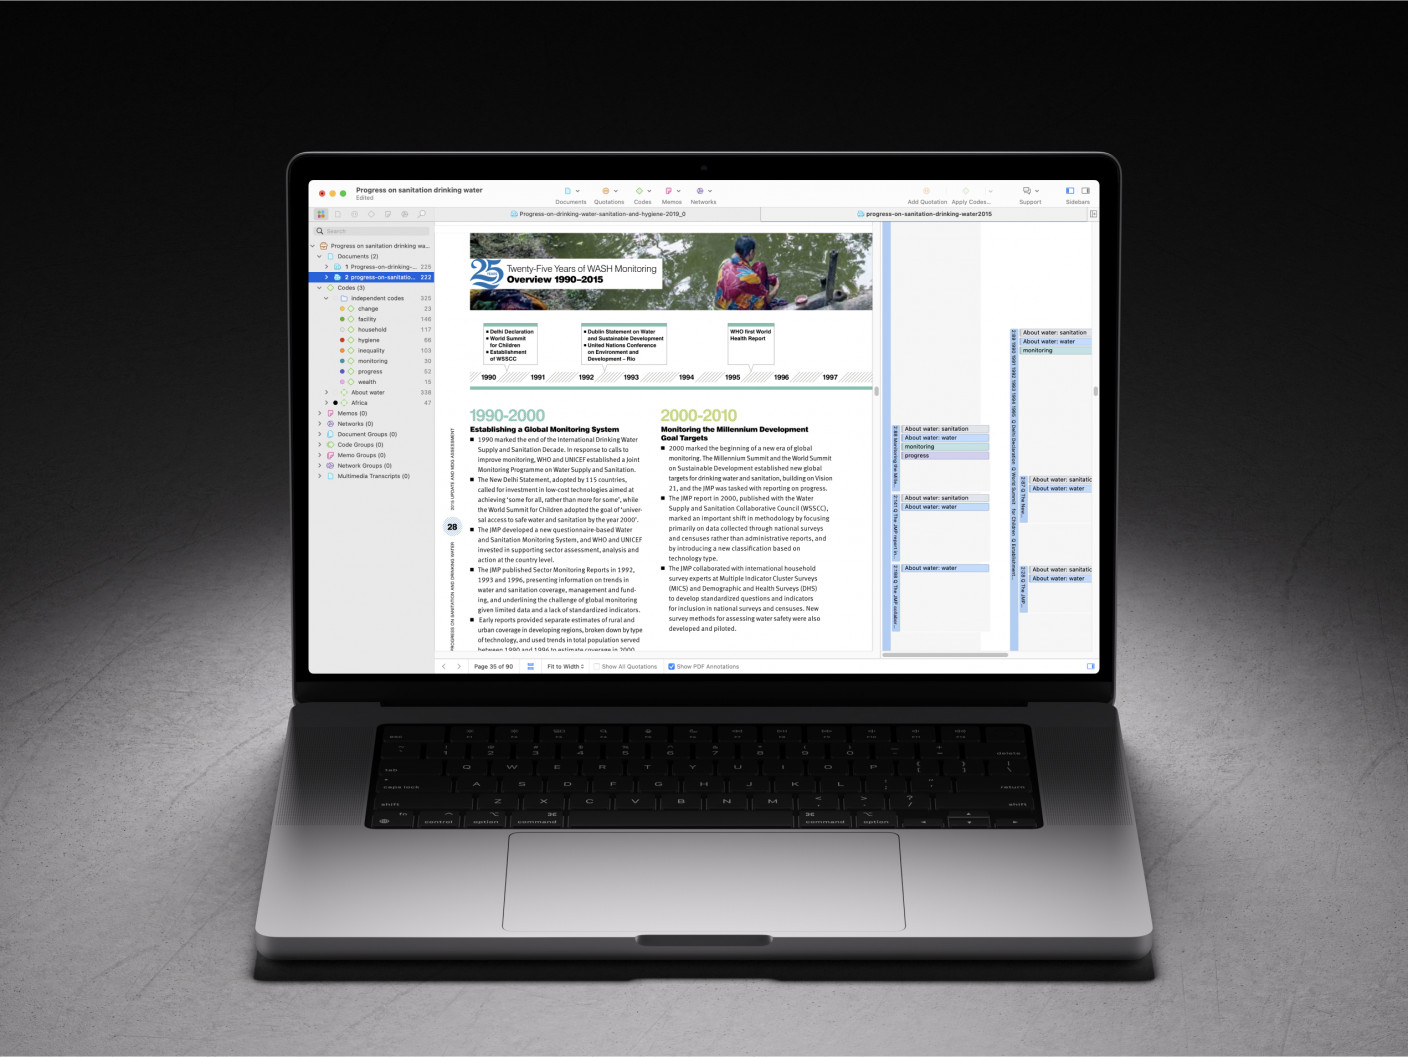
Manual coding
At the core of any qualitative data analysis software is the interface that allows researchers the freedom of assigning codes to qualitative data. ATLAS.ti's interface for viewing data makes it easy to highlight data segments and apply new codes or existing codes quickly and efficiently.
In vivo coding
Interpreting qualitative data to create codes is often a part of the coding process. This can mean that the names of codes may differ from the actual text of the data itself.
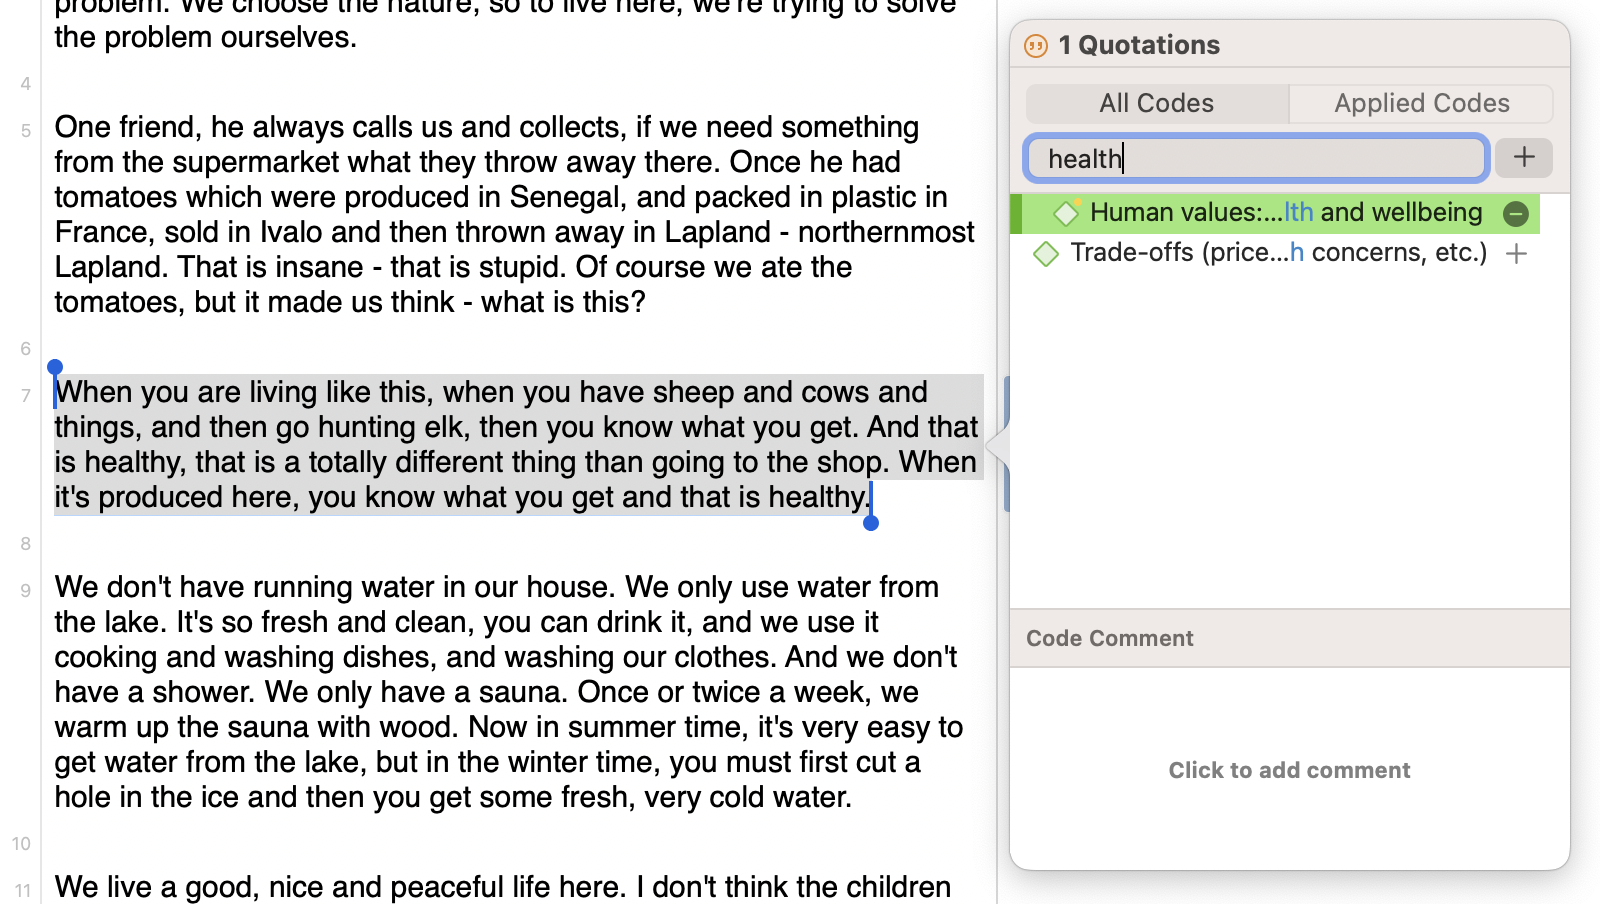
However, the best names for codes sometimes come from the textual data itself, as opposed to some interpretation of the text. As a result, there may be a particular word or short phrase that stands out to you in your data set, compelling you to incorporate that word or phrase into your qualitative codes. Think about how social media has slang or acronyms like "YOLO" or "YMMV" which condense a lot of meaning or convey something of importance in the context of the research. Rather than obscuring participants’ meanings or experiences within another layer of interpretation, researchers can build meaningful and rich insights by using participants’ own words to create in vivo codes.
In vivo coding is a handy feature in ATLAS.ti for when you come across a key term or phrase that you want to create a code out of. Simply highlight the desired text and click on "Code in Vivo" to create a new code instantly.
Code Manager
One of the biggest challenges of coding qualitative data is keeping track of dozens or even hundreds of codes, because a lack of organization may hinder researchers in the main objective of succinctly summarizing qualitative data.
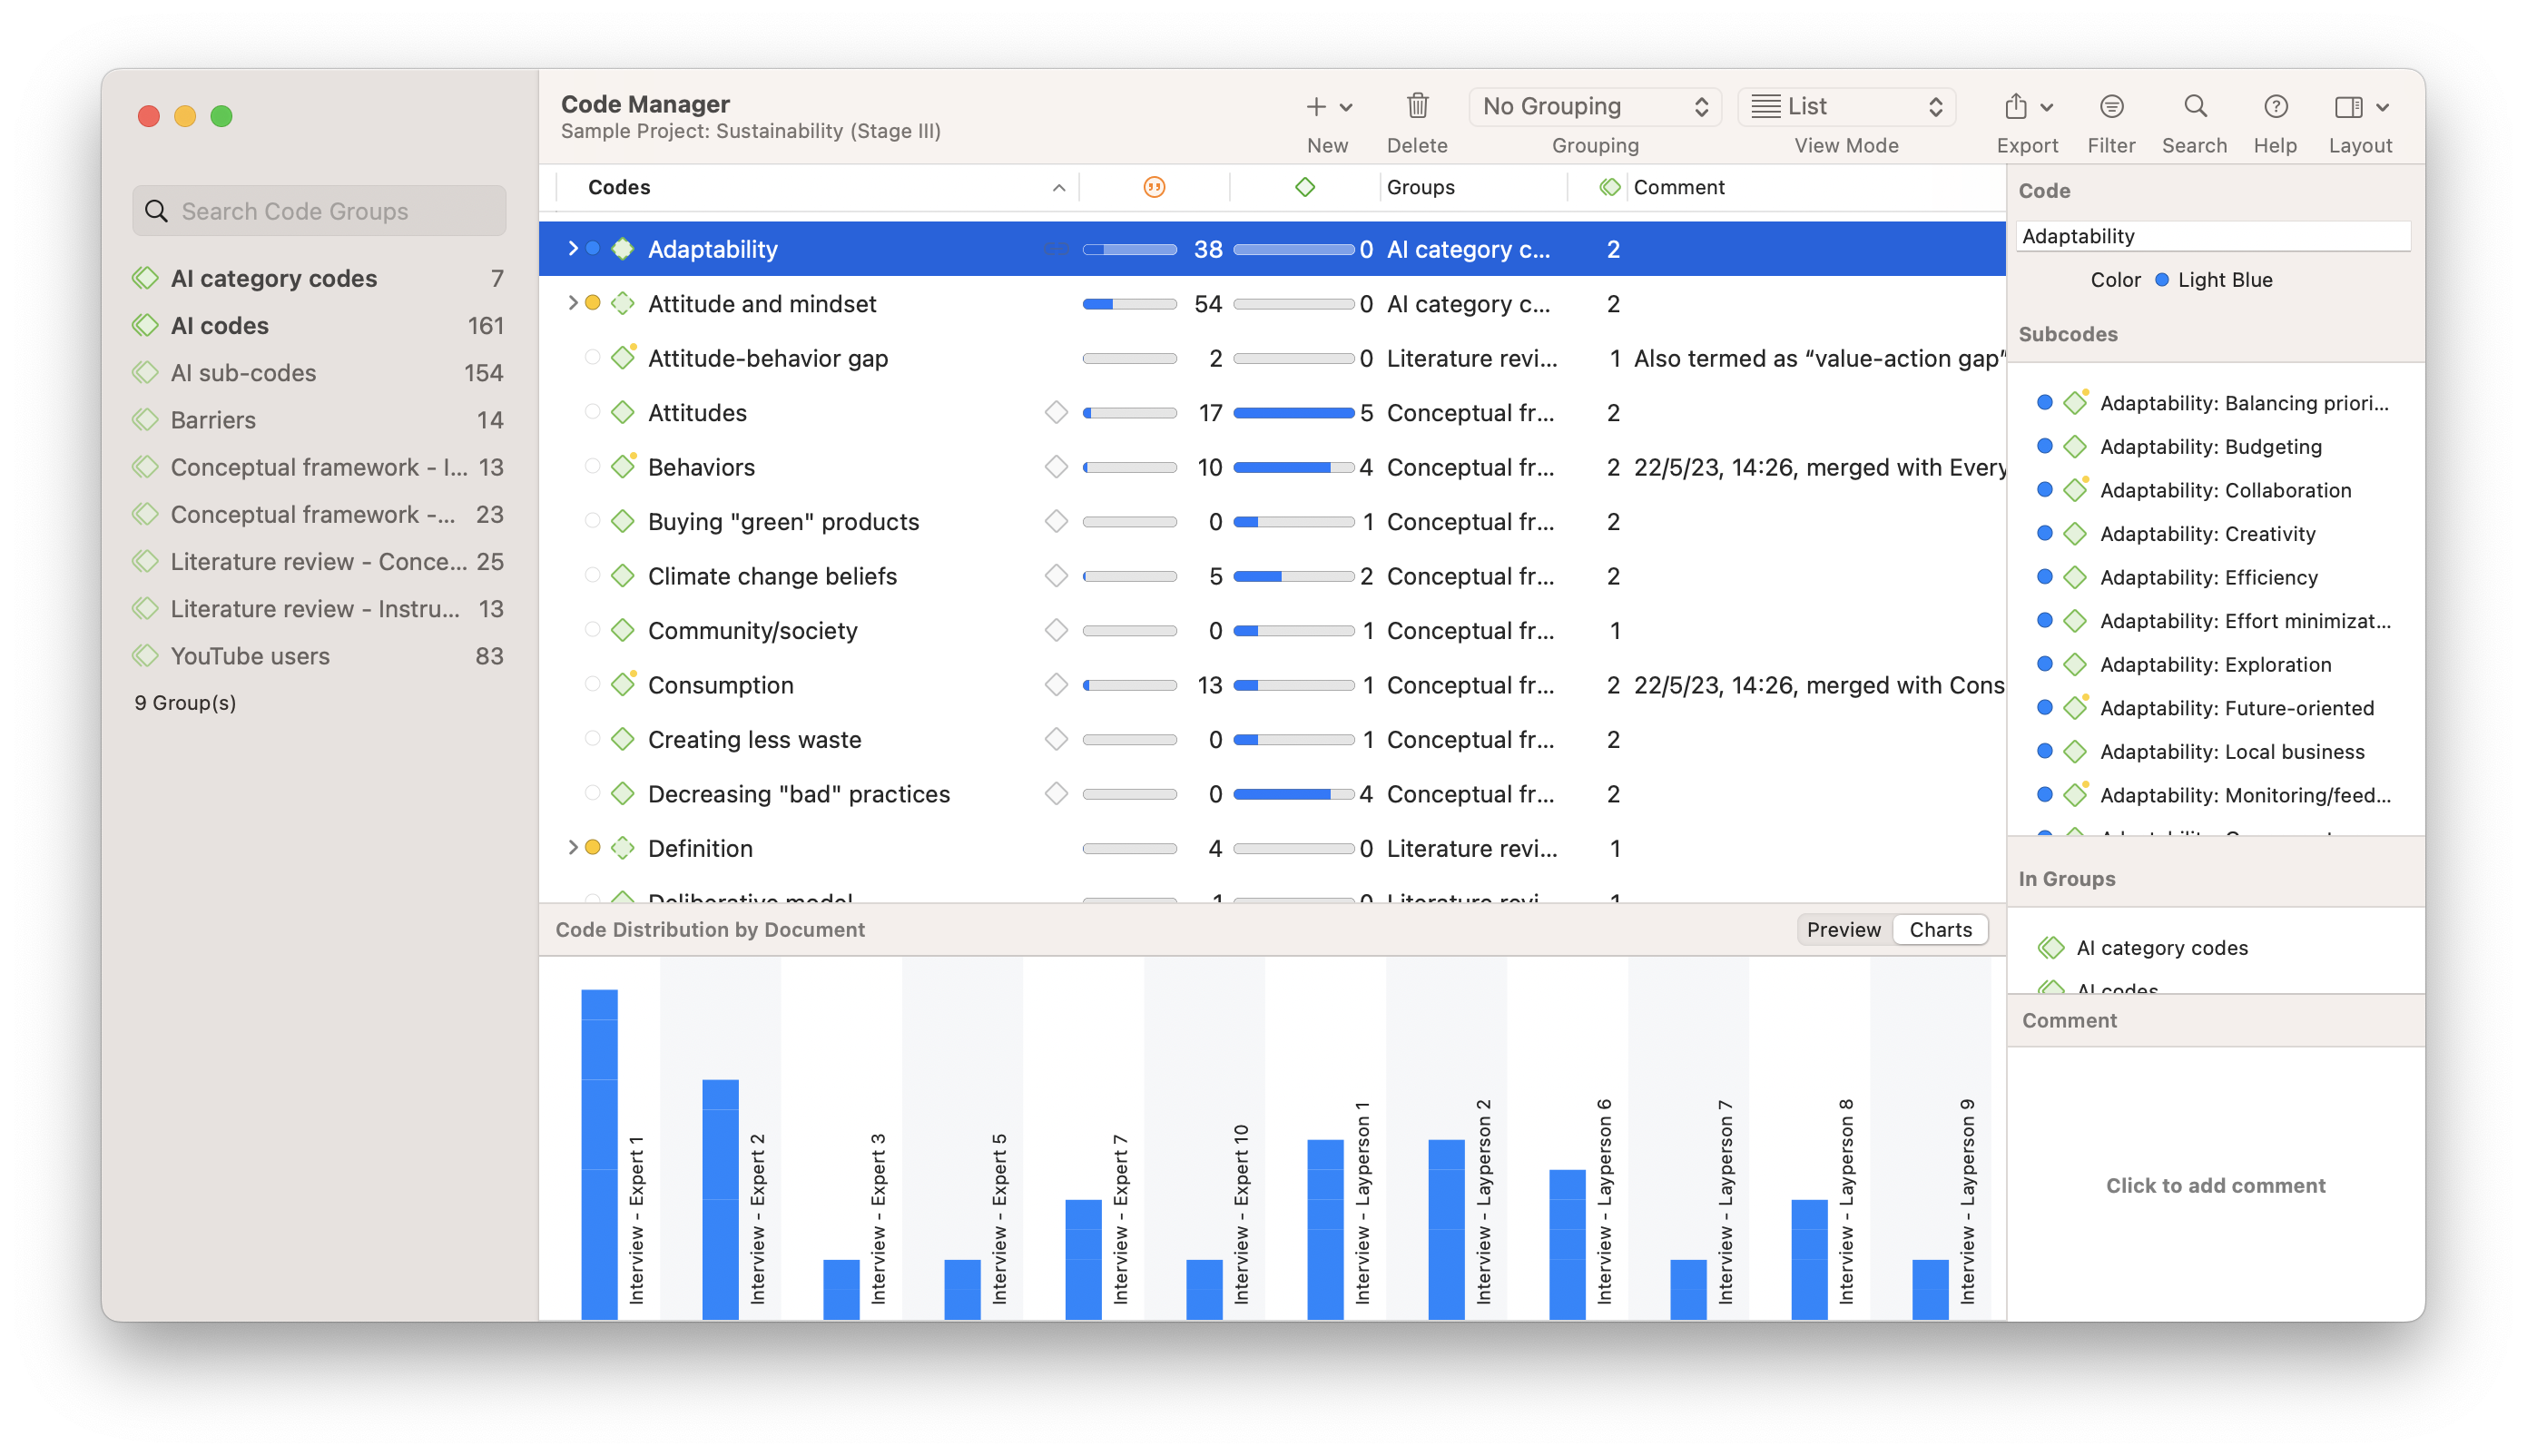
Once you have developed and applied a set of codes to your project data, you can open the Code Manager to gain a bird's eye view of all of your codes so you can develop and reorganize them, into hierarchies, groups, or however you prefer. Your list of codes can also be exported to share with others or use in other qualitative or quantitative analysis software.
Automated coding tools in ATLAS.ti
Traditionally, qualitative researchers would perform this coding on their data manually by hand, which involves carefully reading each piece of data and attaching codes. For qualitative researchers using pen and paper, they can use highlighters or bookmark flags to mark the key points in their data for later reference. Qualitative researchers also have powerful qualitative data analysis software they can rely on to facilitate all aspects of the coding process.

Although researchers can use qualitative data analysis software to engage in manual coding, there is also now a range of software tools that can even automate the coding process. A number of automated coding tools in ATLAS.ti such as AI Coding, Sentiment Analysis, and Opinion Mining use machine learning and natural language processing to apply useful codes for later analysis. Moreover, other tools in ATLAS.ti rely on pattern recognition to facilitate the creation of descriptive codes throughout your project.
AI Coding
One of the most exciting implications of recent advances in artificial intelligence is its potential for facilitating the research process, especially in qualitative research. The use of machine learning to understand the salient points in data can be especially useful to researchers in all fields.
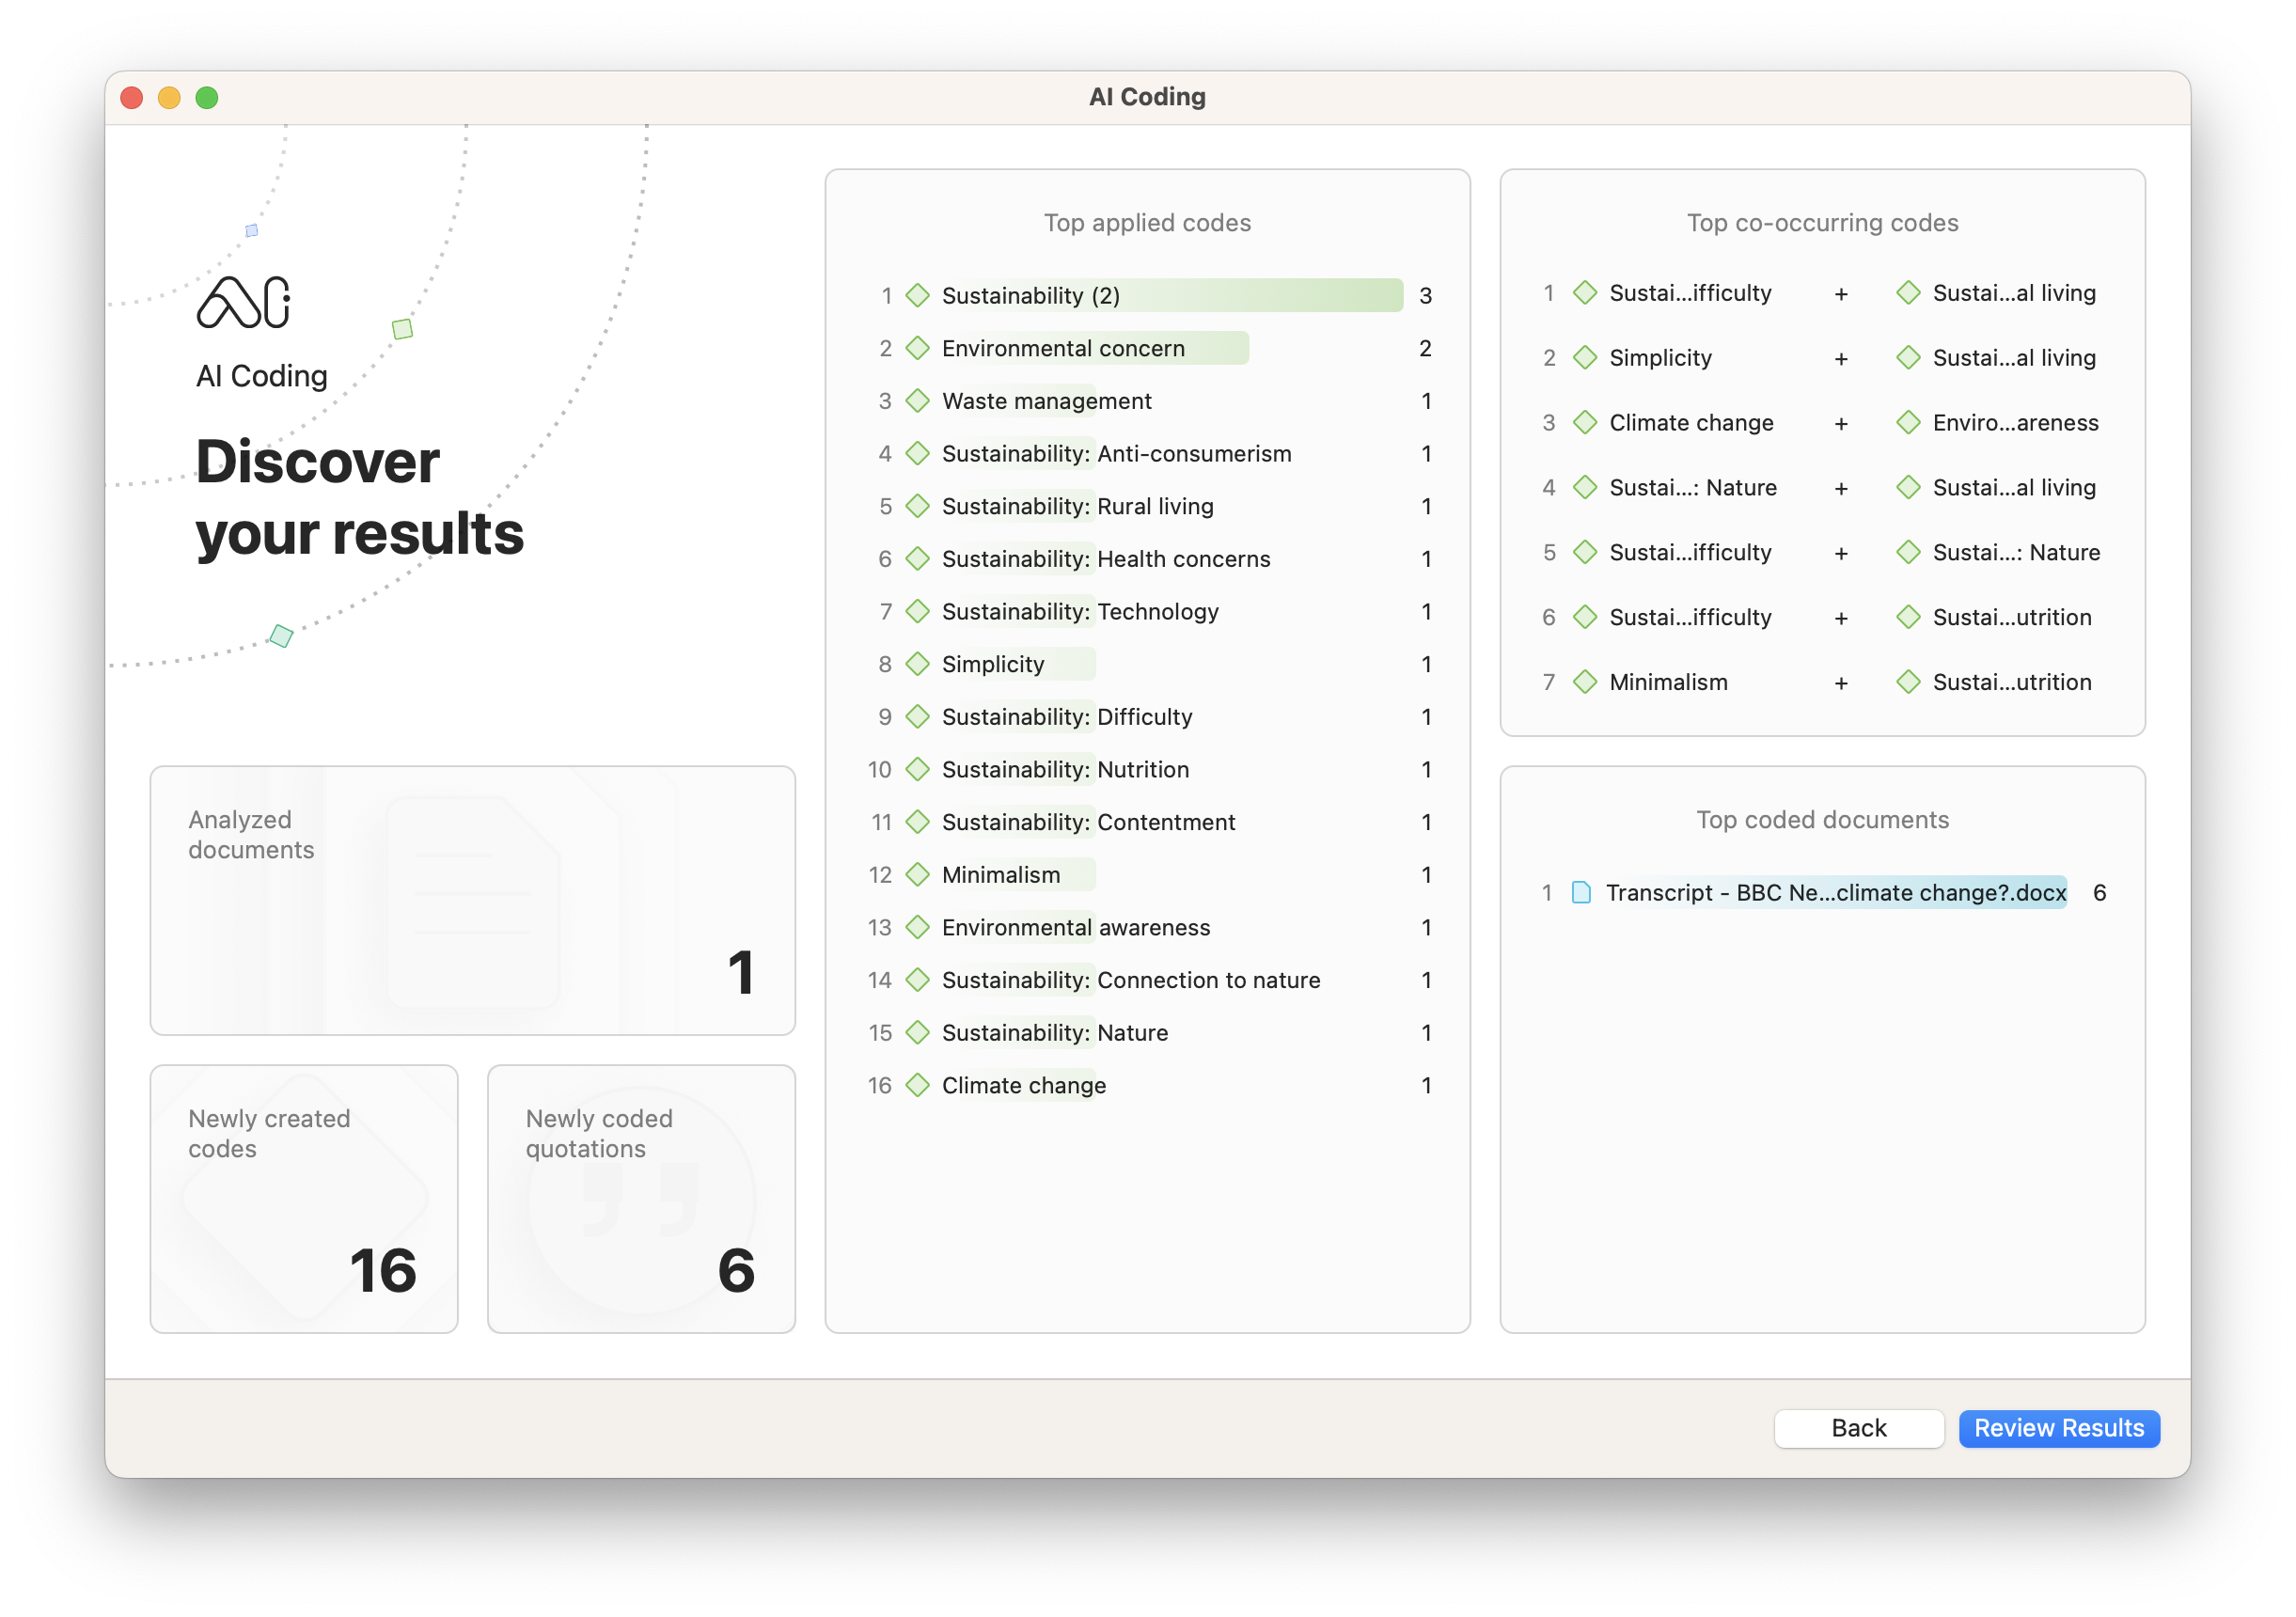
AI Coding, available in both the Desktop platforms and Web version of ATLAS.ti, performs comprehensive descriptive coding on your qualitative data. It processes data through OpenAI's language models to suggest and apply codes to your project in a fraction of the time that it would take to do manually.
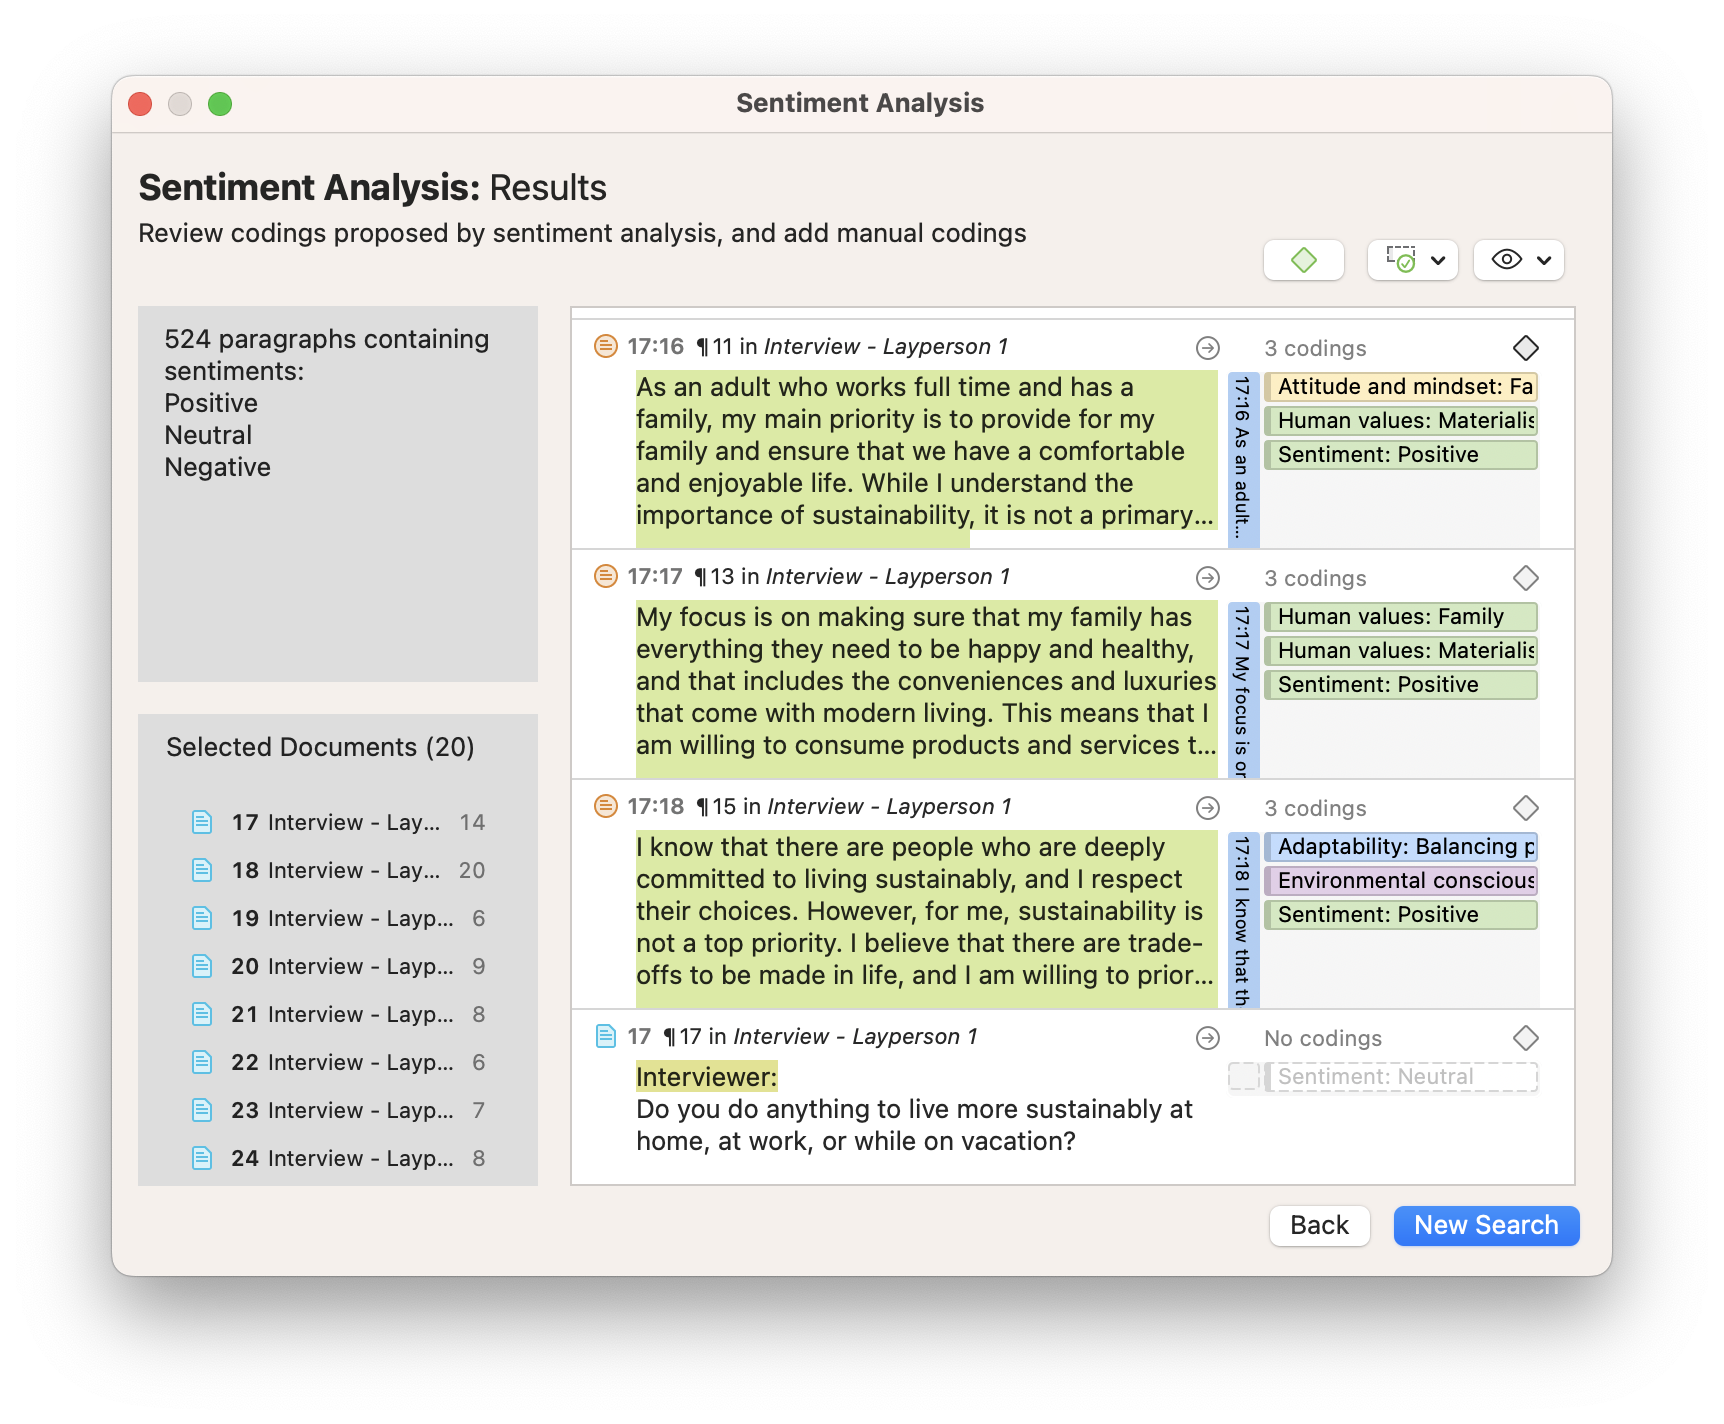
Sentiment Analysis
Participants may often express sentiments that are positive or negative in nature. If you are interested in analyzing the feelings expressed in your data, you can analyze these sentiments. To conduct automated coding for these sentiments, ATLAS.ti employs machine learning to process your data quickly and suggest codes to be applied to relevant data segments.
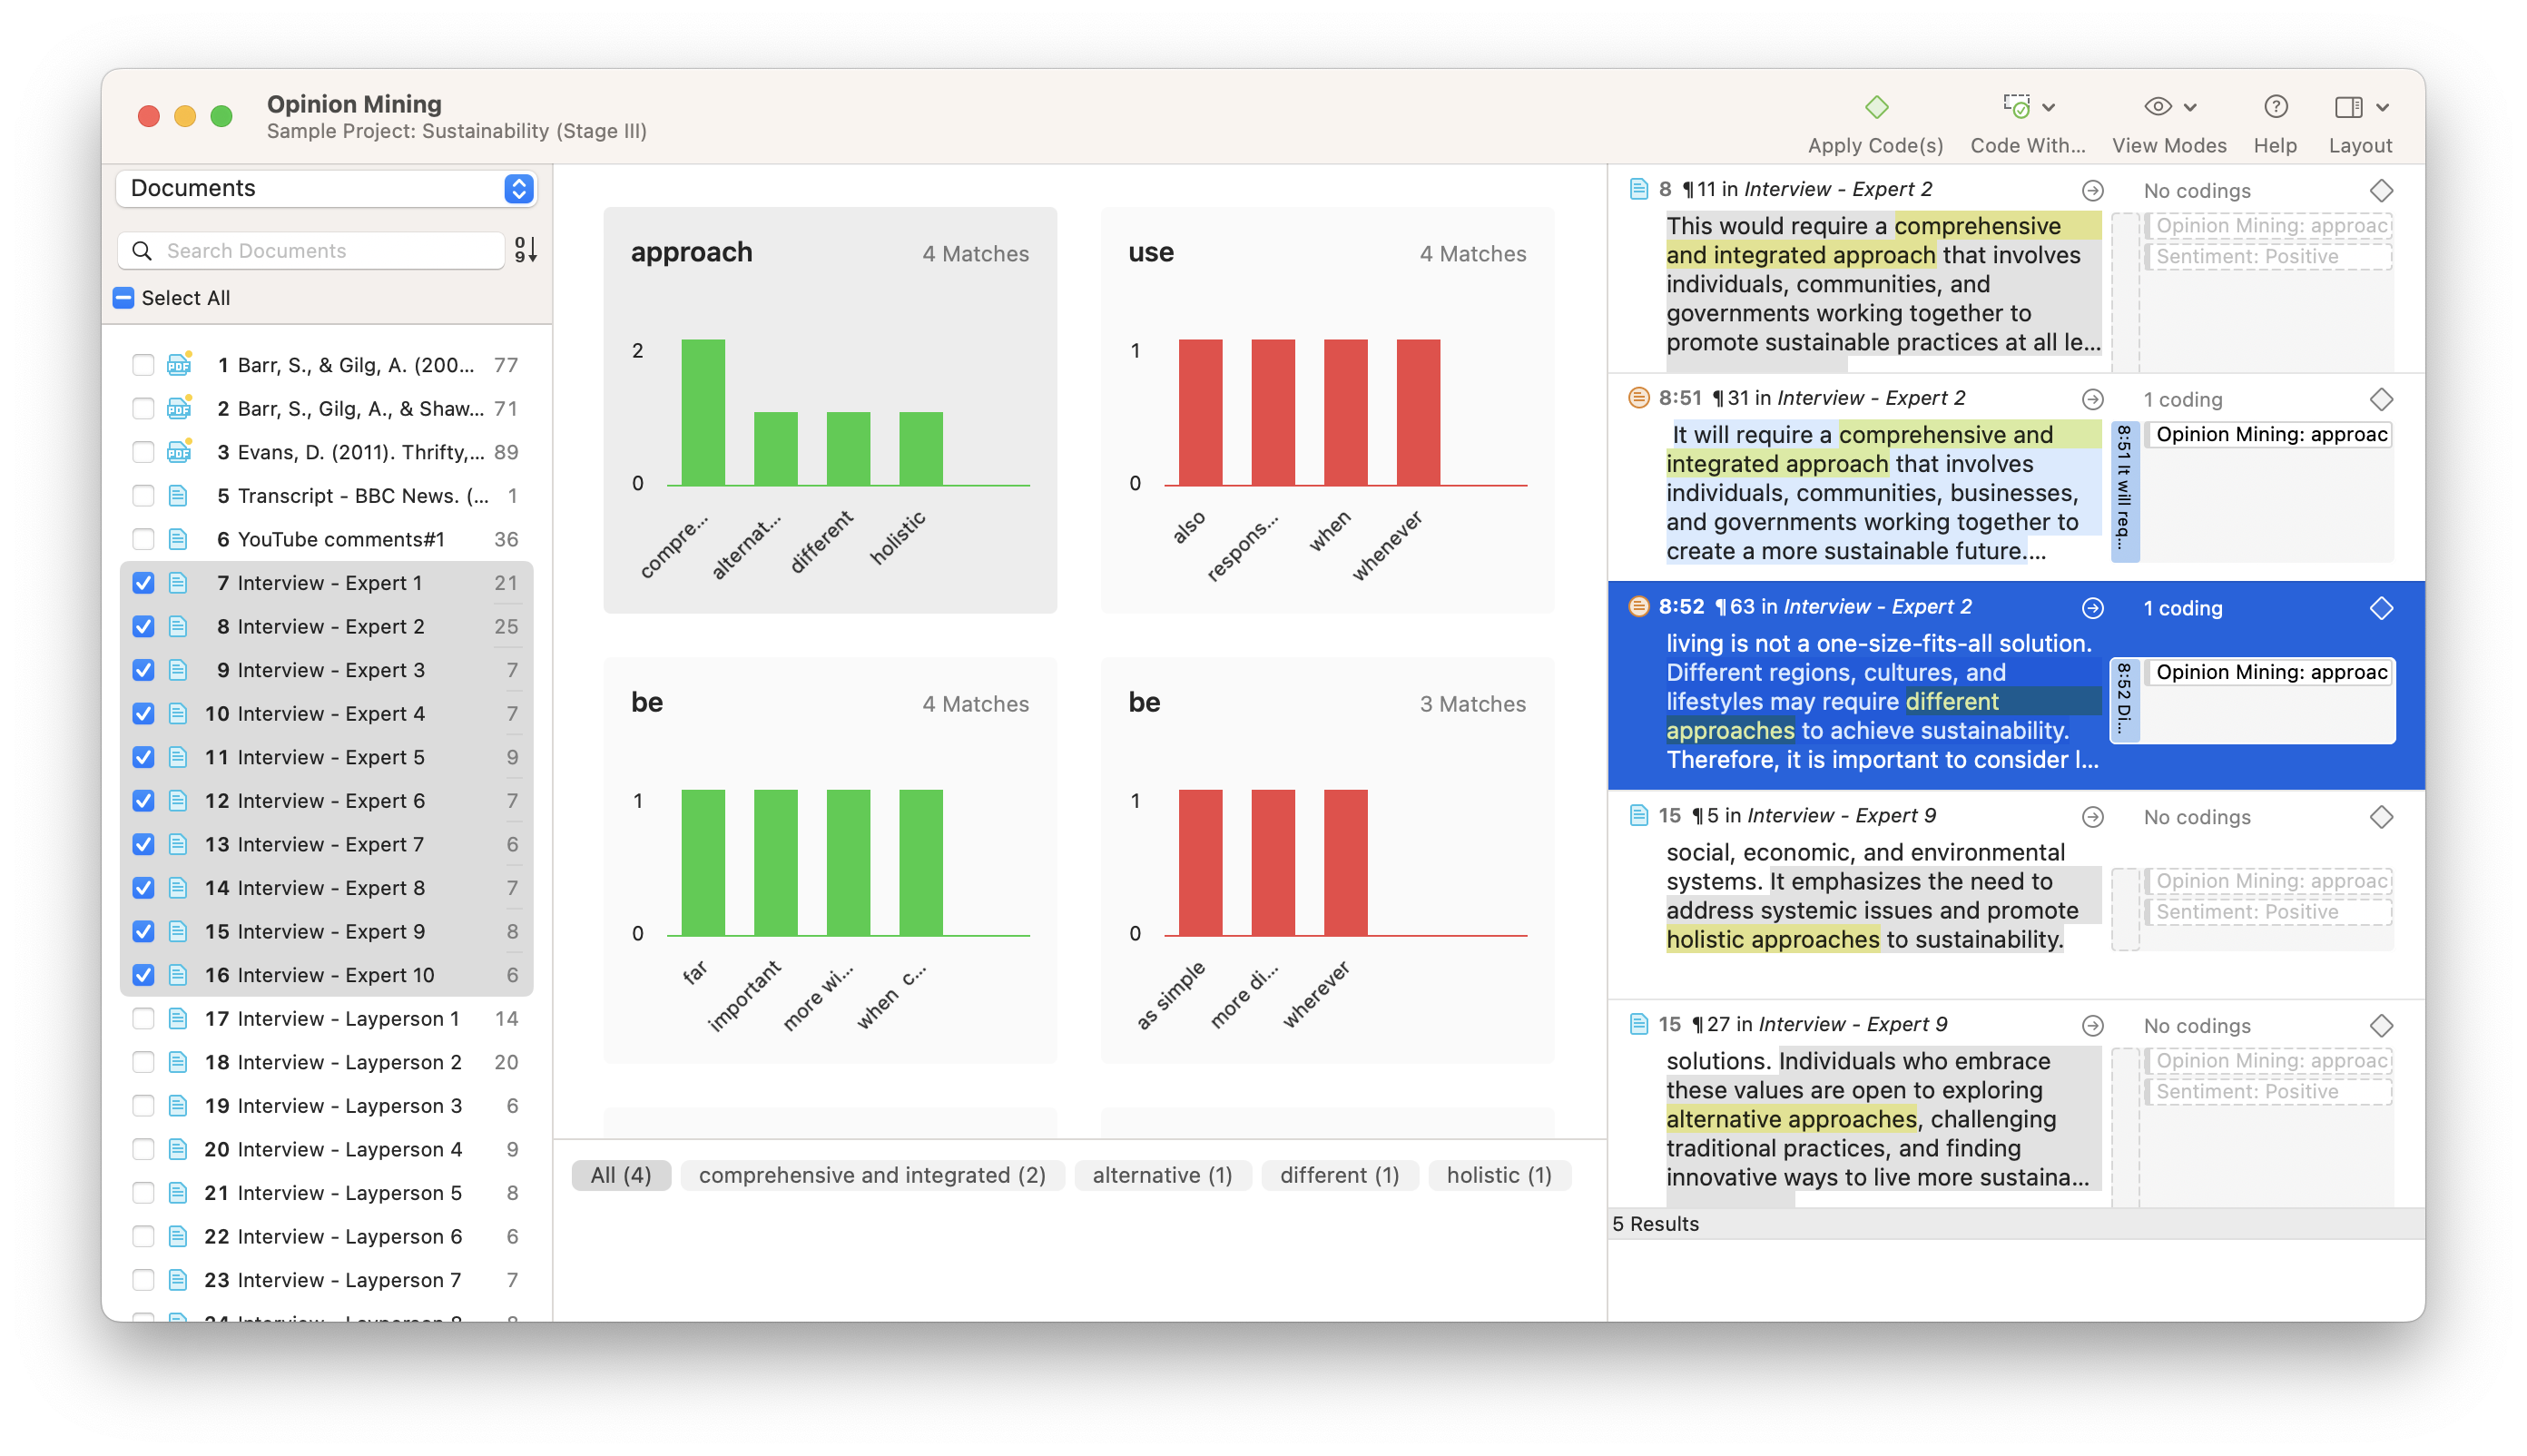
Opinion Mining
If you want to understand both what participants talked about and how they felt about it, you can conduct Opinion Mining. This tool synthesizes key phrases in your textual data according to whether they are being talked about in a positive or negative manner. The codes generated from Opinion Mining can provide a useful illustration of how language in interviews, focus groups, and surveys is used when discussing certain topics or phenomena.