
- Handling qualitative data
- Transcripts
- Field notes
- Memos
- Survey data and responses
- Visual and audio data
- Data organization
- Data coding
- Coding frame
- Auto and smart coding
- Organizing codes
- Qualitative data analysis
- Content analysis
- Thematic analysis
- Narrative research
- Phenomenological research
- Discourse analysis
- Grounded theory
- Deductive reasoning
- Inductive reasoning
- Inductive vs. deductive reasoning
- Qualitative data interpretation
- Qualitative data analysis software
- How to cite "The Ultimate Guide to Qualitative Research - Part 2"
- Thematic analysis vs. content analysis
Qualitative data analysis
Analyzing qualitative data is the next step after you have completed the use of qualitative data collection methods. The qualitative analysis process aims to identify themes and patterns that emerge across the data.

What is qualitative data analysis?
In simplified terms, qualitative research methods involve non-numerical data collection followed by an explanation based on the attributes of the data. For example, if you are asked to explain in qualitative terms a thermal image displayed in multiple colors, then you would explain the color differences rather than the heat's numerical value. If you have a large amount of data (e.g., of group discussions or observations of real-life situations), the next step is to transcribe and prepare the raw data for subsequent analysis.
Researchers can conduct studies fully based on qualitative methodology, or researchers can preface a quantitative research study with a qualitative study to identify issues that were not originally envisioned but are important to the study. Quantitative researchers may also collect and analyze qualitative data following their quantitative analyses to better understand the meanings behind their statistical results.
Conducting qualitative research can especially help build an understanding of how and why certain outcomes were achieved (in addition to what was achieved). For example, qualitative data analysis is often used for policy and program evaluation research since it can answer certain important questions more efficiently and effectively than quantitative approaches.

Qualitative data analysis can also answer important questions about the relevance, unintended effects, and impact of programs, such as:
- Were expectations reasonable?
- Did processes operate as expected?
- Were key players able to carry out their duties?
- Were there any unintended effects of the program?
The importance of qualitative data analysis
Qualitative approaches have the advantage of allowing for more diversity in responses and the capacity to adapt to new developments or issues during the research process itself. While qualitative data analysis can be demanding and time-consuming to conduct, many fields of research utilize qualitative software tools that have been specifically developed to provide more succinct, cost-efficient, and timely results.
Qualitative data analysis is an important part of research and building greater understanding across fields for a number of reasons. First, cases for qualitative data analysis can be selected purposefully according to whether they typify certain characteristics or contextual locations. In other words, qualitative data permits deep immersion into a topic, phenomenon, or area of interest. Rather than seeking generalizability to the population the sample of participants represent, qualitative research aims to construct an in-depth and nuanced understanding of the research topic.
Secondly, the role or position of the researcher in qualitative data analysis is given greater critical attention. This is because, in qualitative data analysis, the possibility of the researcher taking a ‘neutral' or transcendent position is seen as more problematic in practical and/or philosophical terms. Hence, qualitative researchers are often exhorted to reflect on their role in the research process and make this clear in the analysis.

Thirdly, while qualitative data analysis can take a wide variety of forms, it largely differs from quantitative research in the focus on language, signs, experiences, and meaning. In addition, qualitative approaches to analysis are often holistic and contextual rather than analyzing the data in a piecemeal fashion or removing the data from its context. Qualitative approaches thus allow researchers to explore inquiries from directions that could not be accessed with only numerical quantitative data.
Establishing research rigor
Systematic and transparent approaches to the analysis of qualitative data are essential for rigor. For example, many qualitative research methods require researchers to carefully code data and discern and document themes in a consistent and credible way.
Perhaps the most traditional division in the way qualitative and quantitative research have been used in the social sciences is for qualitative methods to be used for exploratory purposes (e.g., to generate new theory or propositions) or to explain puzzling quantitative results, while quantitative methods are used to test hypotheses.

Qualitative data analysis methods
After you’ve collected relevant data, what is the best way to look at your data? As always, it will depend on your research question. For instance, if you employed an observational research method to learn about a group’s shared practices, an ethnographic approach could be appropriate to explain the various dimensions of culture. If you collected textual data to understand how people talk about something, then a discourse analysis approach might help you generate key insights about language and communication.

The qualitative data coding process involves iterative categorization and recategorization, ensuring the evolution of the analysis to best represent the data. The procedure typically concludes with the interpretation of patterns and trends identified through the coding process.
To start off, let’s look at two broad approaches to data analysis.
Deductive analysis
Deductive analysis is guided by pre-existing theories or ideas. It starts with a theoretical framework, which is then used to code the data. The researcher can thus use this theoretical framework to interpret their data and answer their research question.
The key steps include coding the data based on the predetermined concepts or categories and using the theory to guide the interpretation of patterns among the codings. Deductive analysis is particularly useful when researchers aim to verify or extend an existing theory within a new context.
Inductive analysis
Inductive analysis involves the generation of new theories or ideas based on the data. The process starts without any preconceived theories or codes, and patterns, themes, and categories emerge out of the data.

The researcher codes the data to capture any concepts or patterns that seem interesting or important to the research question. These codes are then compared and linked, leading to the formation of broader categories or themes. The main goal of inductive analysis is to allow the data to 'speak for itself' rather than imposing pre-existing expectations or ideas onto the data.
Deductive and inductive approaches can be seen as sitting on opposite poles, and all research falls somewhere within that spectrum. Most often, qualitative data analysis approaches blend both deductive and inductive elements to contribute to the existing conversation around a topic while remaining open to potential unexpected findings. To help you make informed decisions about which qualitative data analysis approach fits with your research objectives, let's look at some of the common approaches for qualitative data analysis.
Content analysis
Content analysis is a research method used to identify patterns and themes within qualitative data. This approach involves systematically coding and categorizing specific aspects of the content in the data to uncover trends and patterns. An often important part of content analysis is quantifying frequencies and patterns of words or characteristics present in the data.
It is a highly flexible technique that can be adapted to various data types, including text, images, and audiovisual content. While content analysis can be exploratory in nature, it is also common to use pre-established theories and follow a more deductive approach to categorizing and quantifying the qualitative data.
Thematic analysis
Thematic analysis is a method used to identify, analyze, and report patterns or themes within the data. This approach moves beyond counting explicit words or phrases and focuses on also identifying implicit concepts and themes within the data.

Researchers conduct detailed coding of the data to ascertain repeated themes or patterns of meaning. Codes can be categorized into themes, and the researcher can analyze how the themes relate to one another. Thematic analysis is flexible in terms of the research framework, allowing for both inductive (data-driven) and deductive (theory-driven) approaches. The outcome is a rich, detailed, and complex account of the data.
Grounded theory
Grounded theory is a systematic qualitative research methodology that is used to inductively generate theory that is 'grounded' in the data itself. Analysis takes place simultaneously with data collection, and researchers iterate between data collection and analysis until a comprehensive theory is developed.
Grounded theory is characterized by simultaneous data collection and analysis, the development of theoretical codes from the data, purposeful sampling of participants, and the constant comparison of data with emerging categories and concepts. The ultimate goal is to create a theoretical explanation that fits the data and answers the research question.
Discourse analysis
Discourse analysis is a qualitative research approach that emphasizes the role of language in social contexts. It involves examining communication and language use beyond the level of the sentence, considering larger units of language such as texts or conversations.

Discourse analysts typically investigate how social meanings and understandings are constructed in different contexts, emphasizing the connection between language and power. It can be applied to texts of all kinds, including interviews, documents, case studies, and social media posts.
Phenomenological research
Phenomenological research focuses on exploring how human beings make sense of an experience and examines the essence of this experience. It strives to understand people's perceptions, perspectives, and understandings of a particular situation or phenomenon.

It involves in-depth engagement with participants, often through interviews or conversations, to explore their lived experiences. The goal is to derive detailed descriptions of the essence of the experience and to interpret what insights or implications this may bear on our understanding of this phenomenon.

How do you analyze qualitative data?
Now that we've summarized the major approaches to data analysis, let's look at the broader process of research and data analysis. Suppose you need to do some research to find answers to any kind of research question, be it an academic inquiry, business problem, or policy decision. In that case, you need to collect some data. There are many methods of collecting data: you can collect primary data yourself by conducting interviews, focus groups, or a survey, for instance. Another option is to use secondary data sources. These are data previously collected for other projects, historical records, reports, statistics – basically everything that exists already and can be relevant to your research.

The data you collect should always be a good fit for your research question. For example, if you are interested in how many people in your target population like your brand compared to others, it is no use to conduct interviews or a few focus groups. The sample will be too small to get a representative picture of the population. If your questions are about "how many….", "what is the spread…" etc., you need to conduct quantitative research. If you are interested in why people like different brands, their motives, and their experiences, then conducting qualitative research can provide you with the answers you are looking for.
Let's describe the important steps involved in conducting research.
Step 1: Planning the research
As the saying goes: "Garbage in, garbage out." Suppose you find out after you have collected data that
- you talked to the wrong people
- asked the wrong questions
- a couple of focus groups sessions would have yielded better results because of the group interaction, or
- a survey including a few open-ended questions sent to a larger group of people would have been sufficient and required less effort.
Think thoroughly about sampling, the questions you will be asking, and in which form. If you conduct a focus group or an interview, you are the research instrument, and your data collection will only be as good as you are. If you have never done it before, seek some training and practice. If you have other people do it, make sure they have the skills.
Step 2: Preparing the data
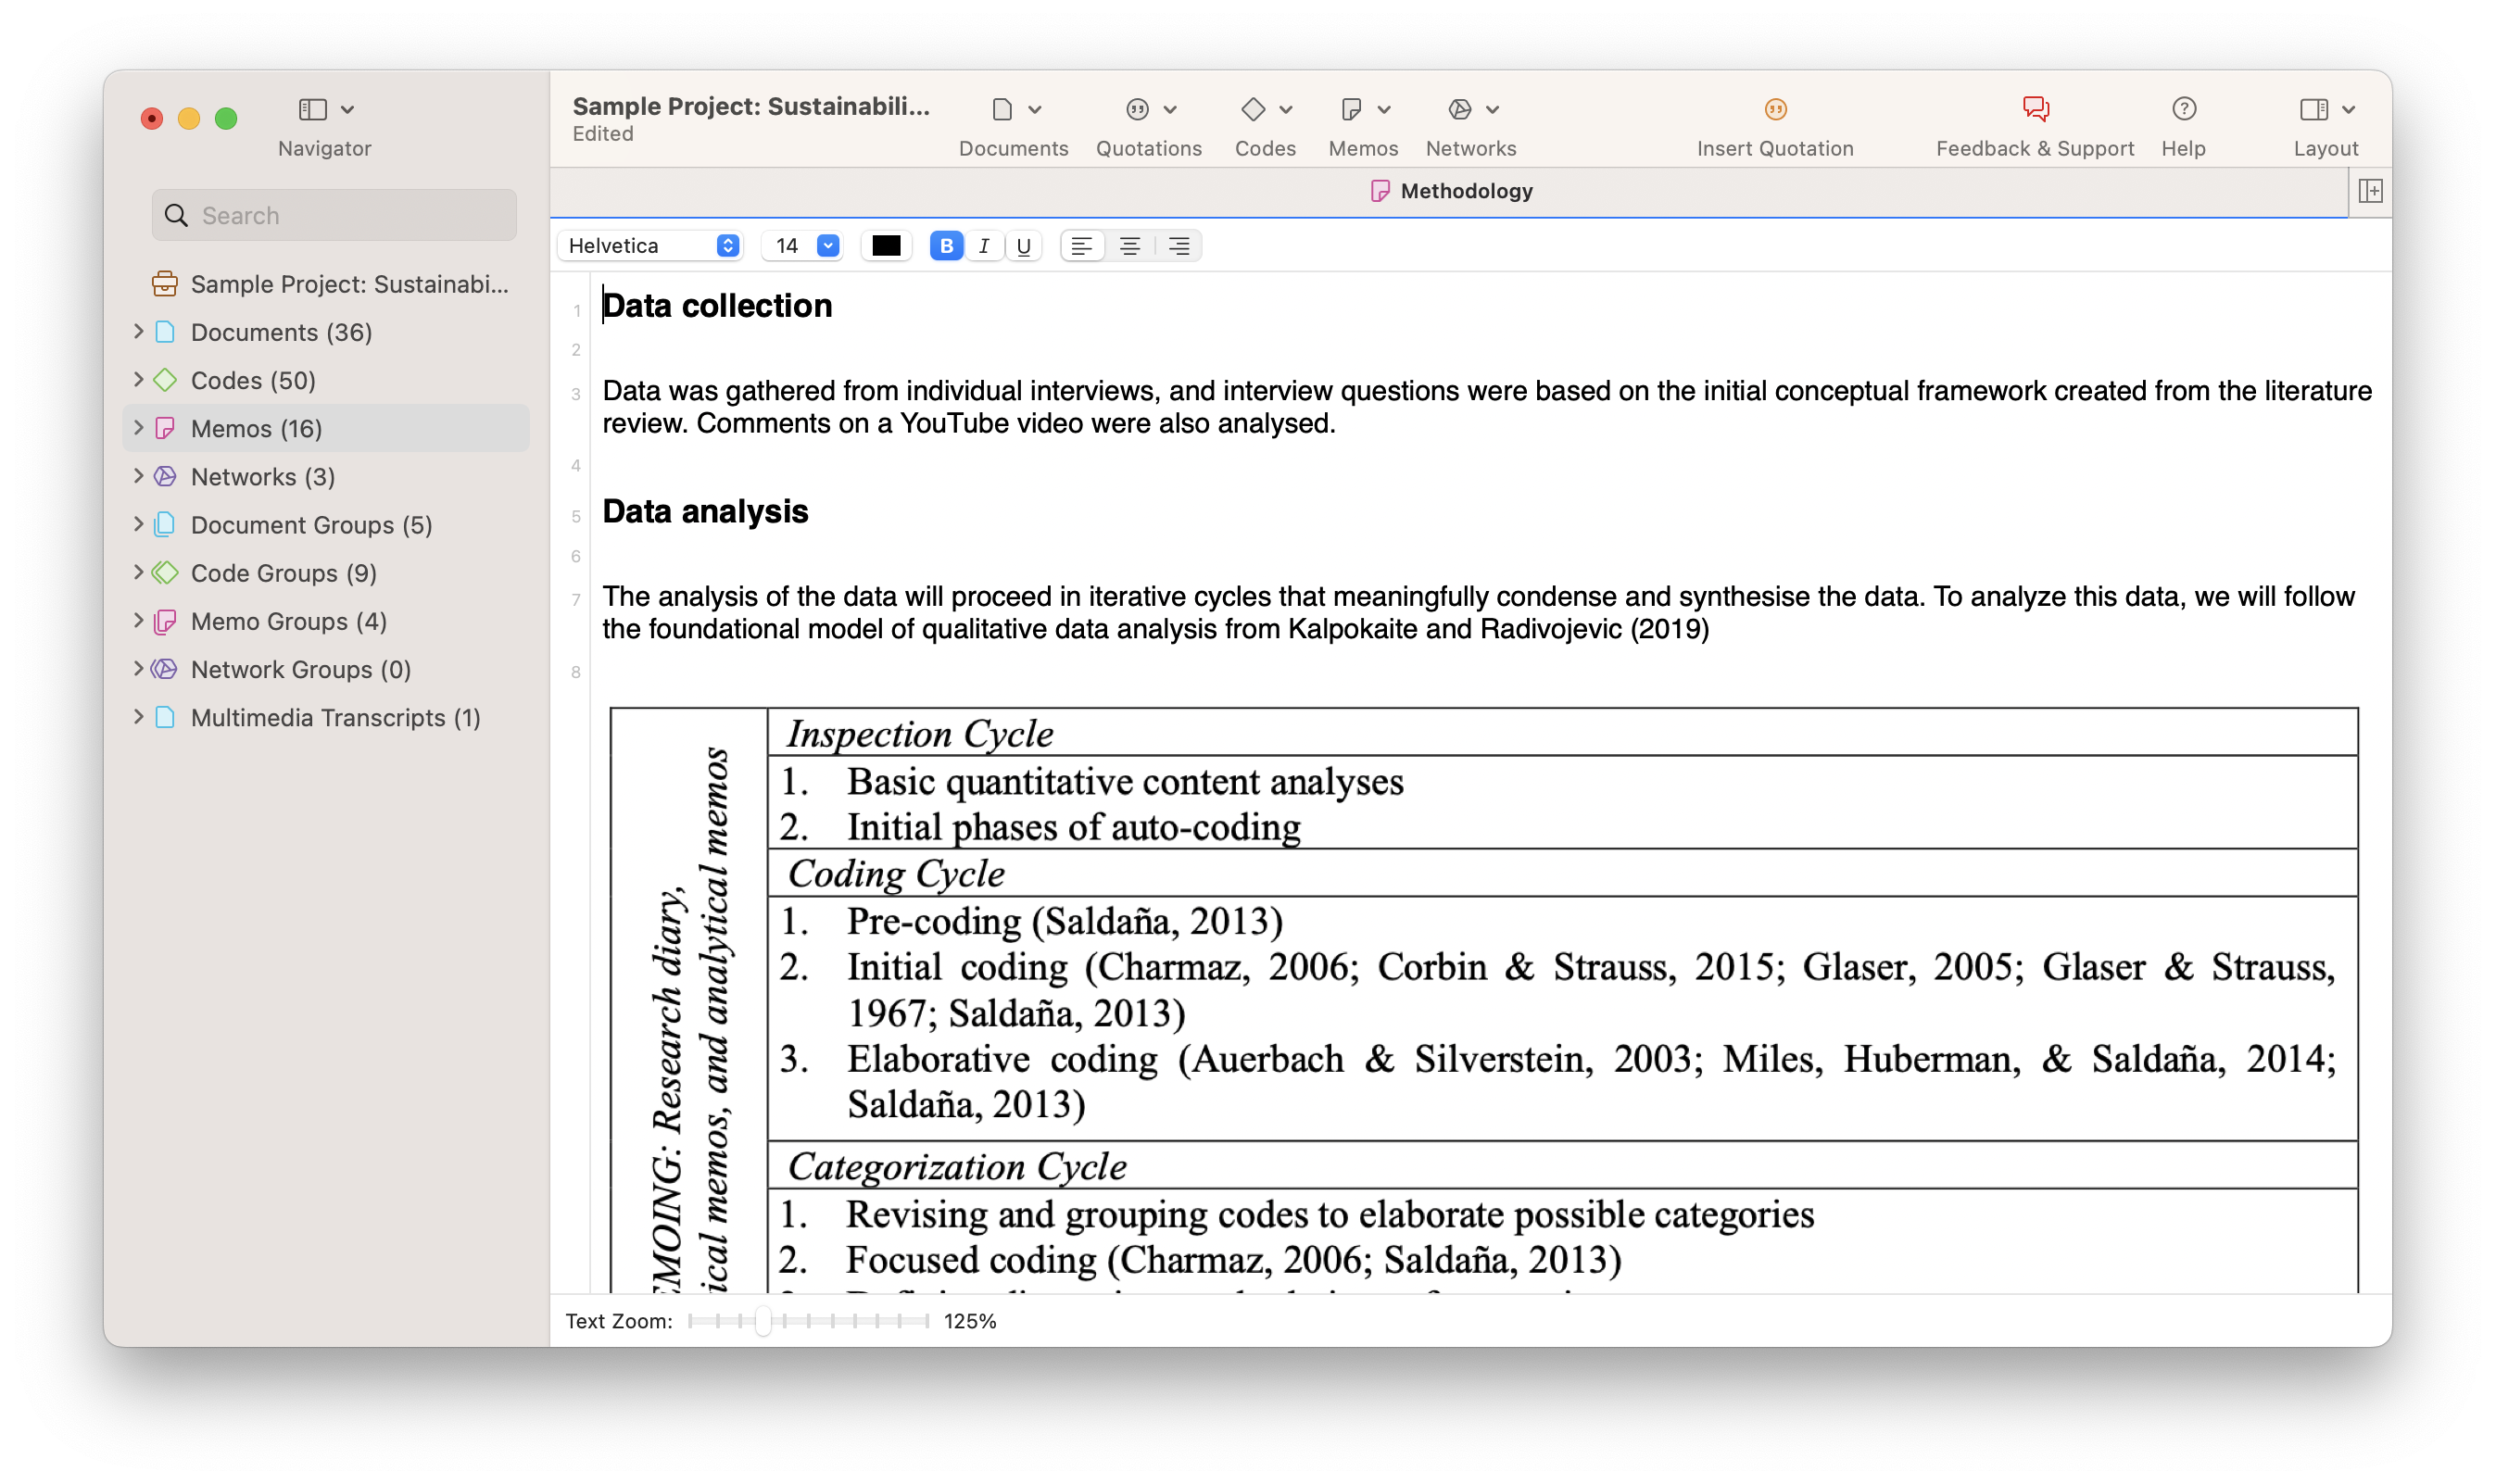
When you conduct focus groups or interviews, think about how to transcribe them. Do you want to run them online or offline? If online, check out which tools can serve your needs, both in terms of functionality and cost. For any audio or video recordings, you can consider using automatic transcription software or services. Automatically generated transcripts can save you time and money, but they still need to be checked. If you don't do this yourself, make sure that you instruct the person doing it on how to prepare the data.
- How should the final transcript be formatted for later analysis?
- Which names and locations should be anonymized?
- What kind of speaker IDs to use?
What about survey data? Some survey data programs will immediately provide basic descriptive-level analysis of the responses. ATLAS.ti will support you with the analysis of the open-ended questions. For this, you need to export your data as an Excel file. ATLAS.ti's survey import wizard will guide you through the process.
Other kinds of data such as images, videos, audio recordings, text, and more can be imported to ATLAS.ti. You can organize all your data into groups and write comments on each source of data to maintain a systematic organization and documentation of your data.

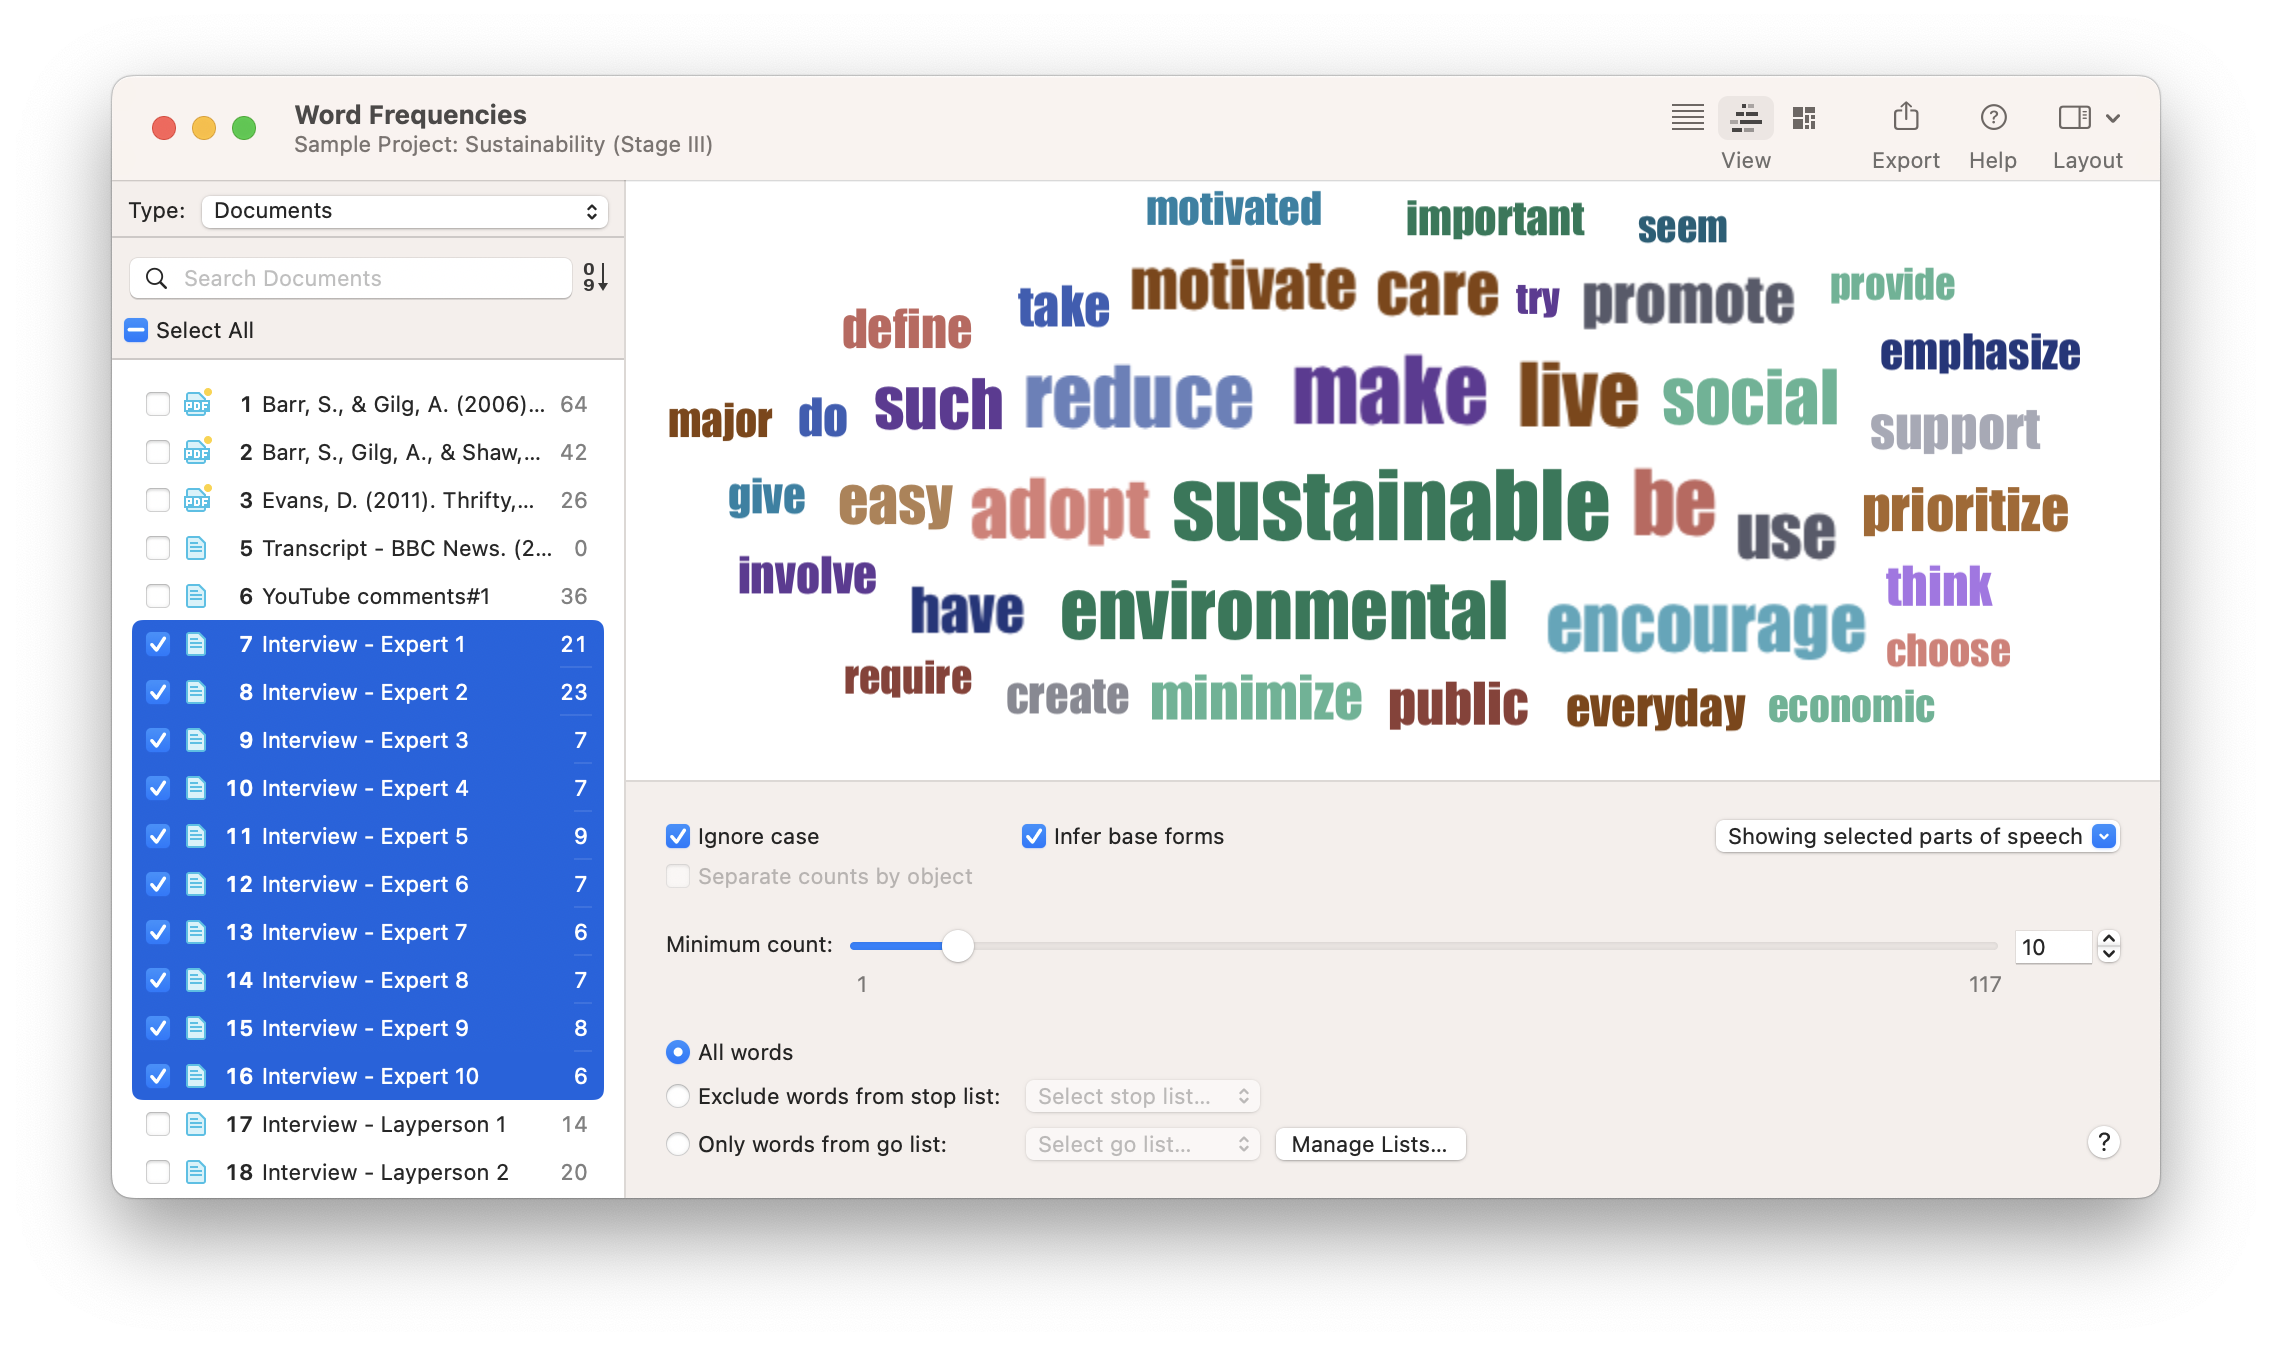
Step 3: Exploratory data analysis
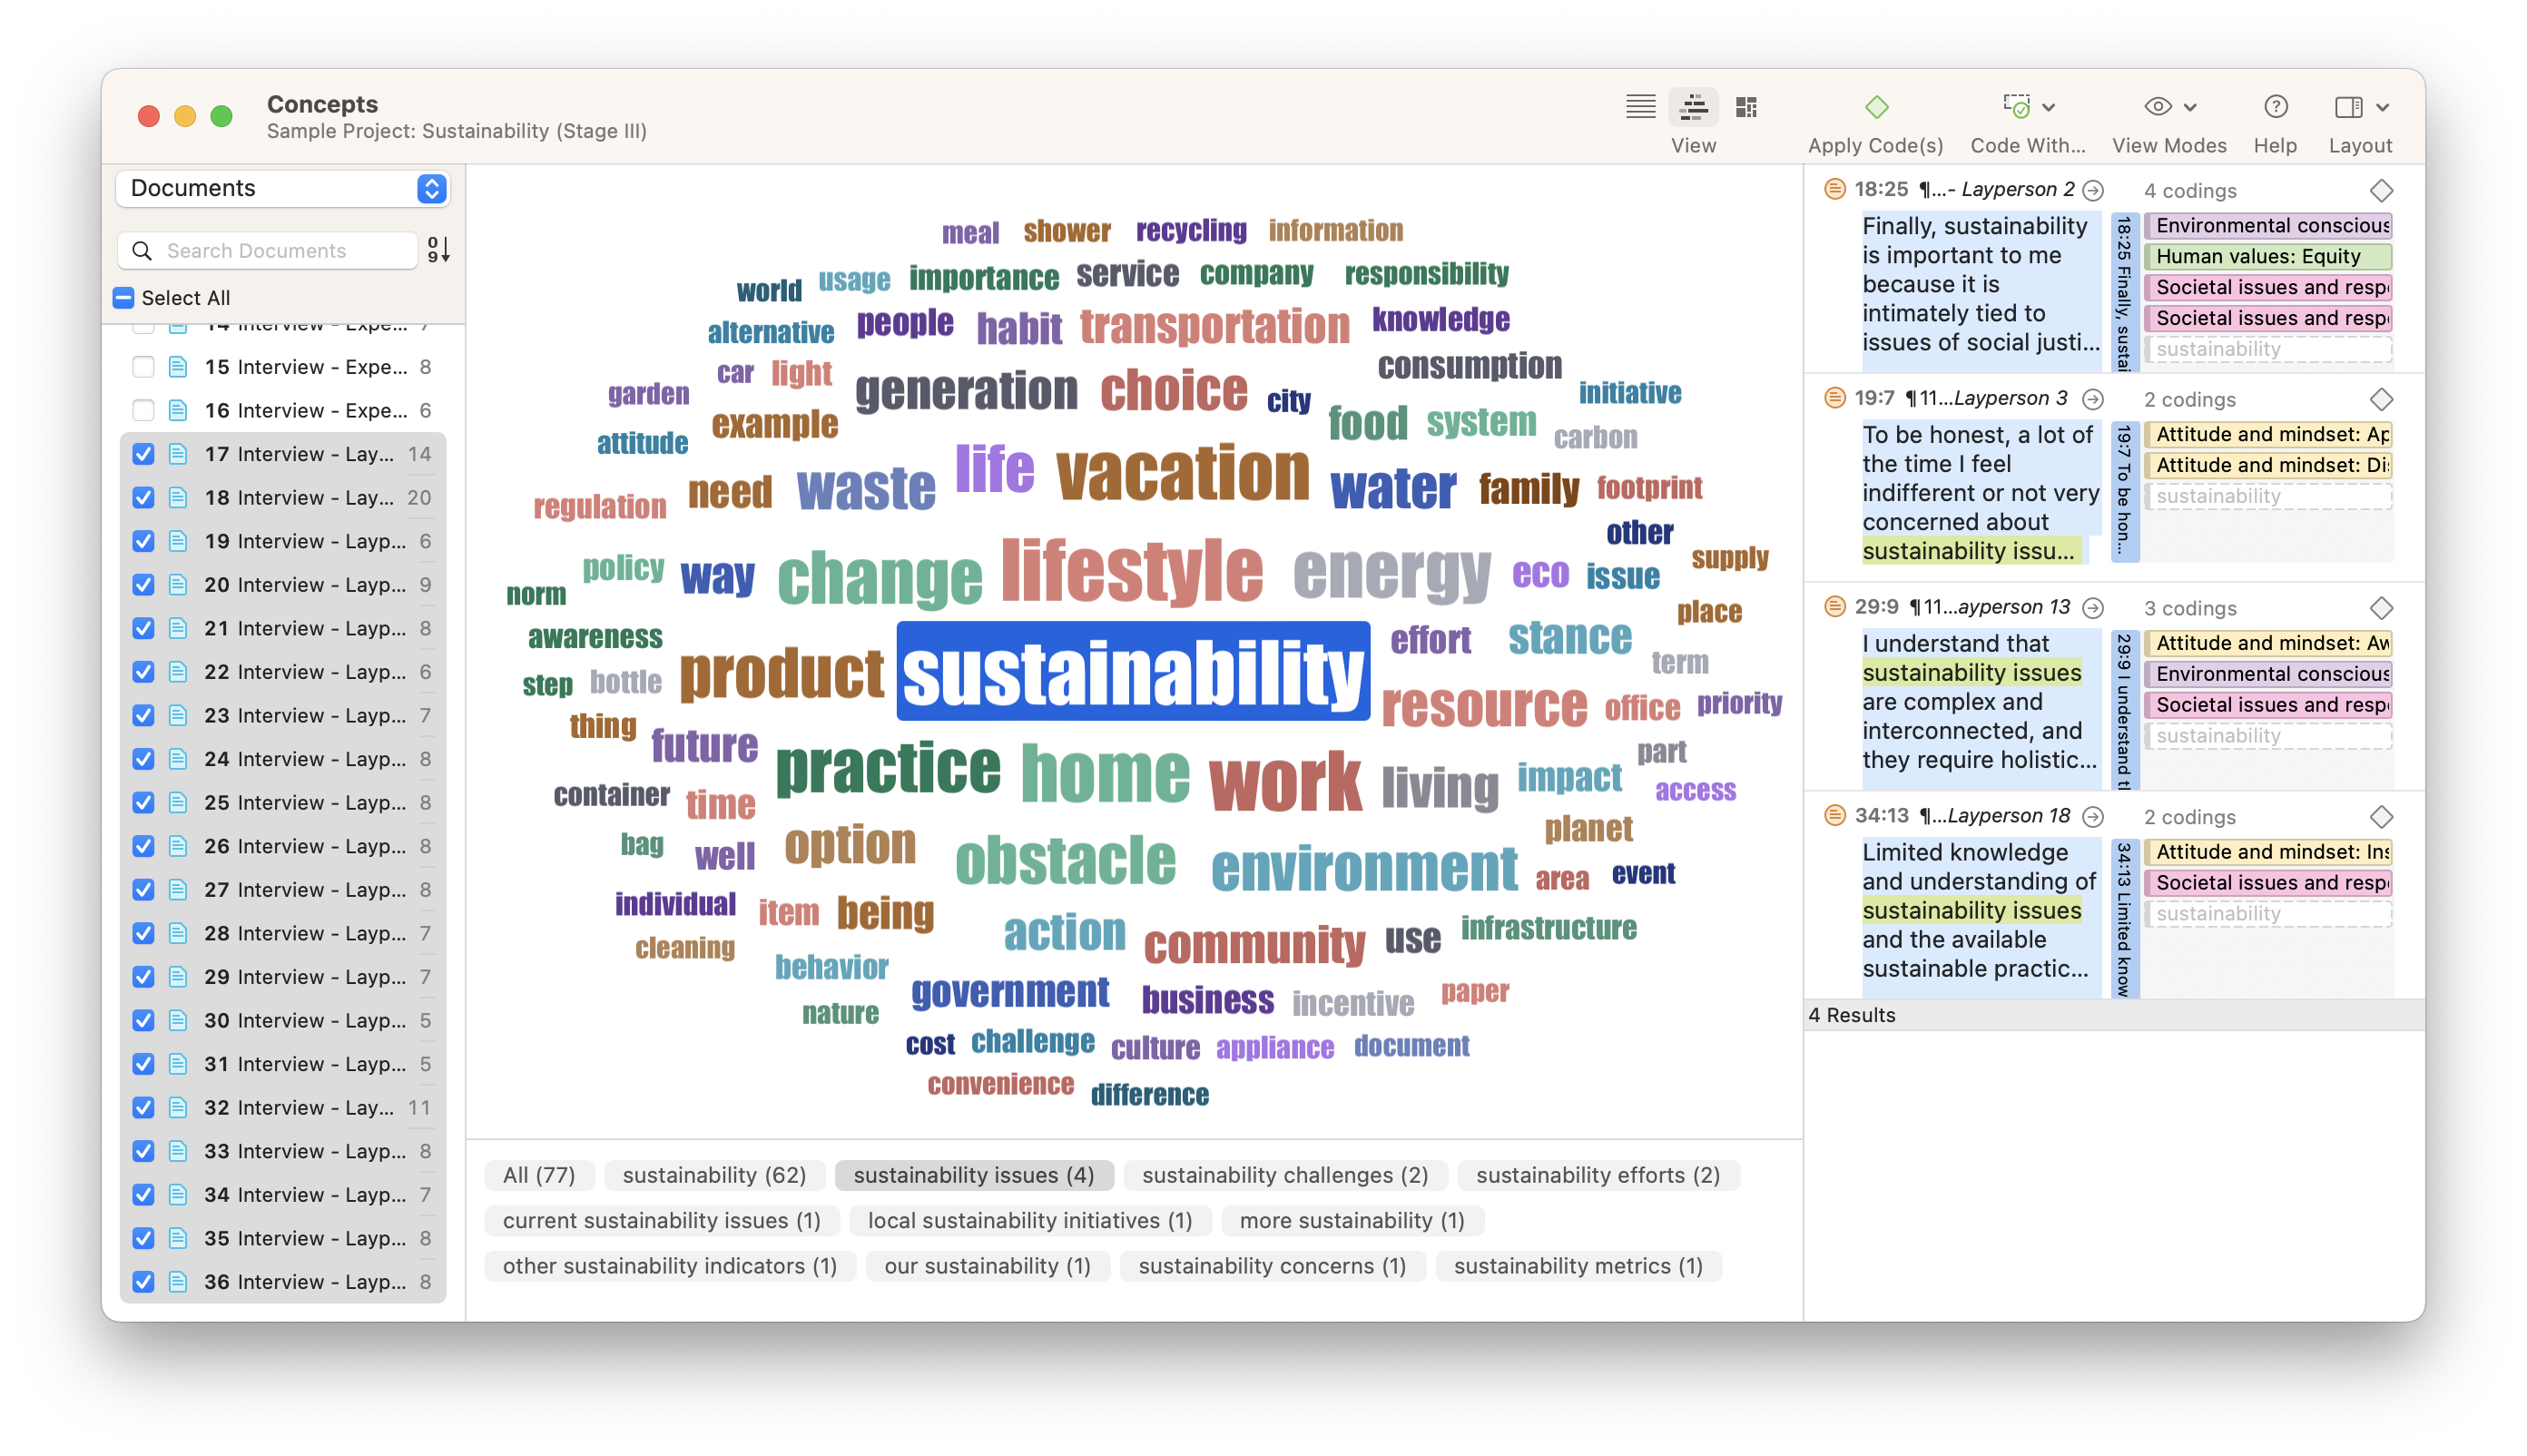
You can run a few simple exploratory analyses to get to know your data. For instance, you can create a word list or word cloud of all your text data or compare and contrast the words in different documents. You can also let ATLAS.ti find relevant concepts for you. There are many tools available that can automatically code your text data, so you can also use these codings to explore your data and refine your coding.
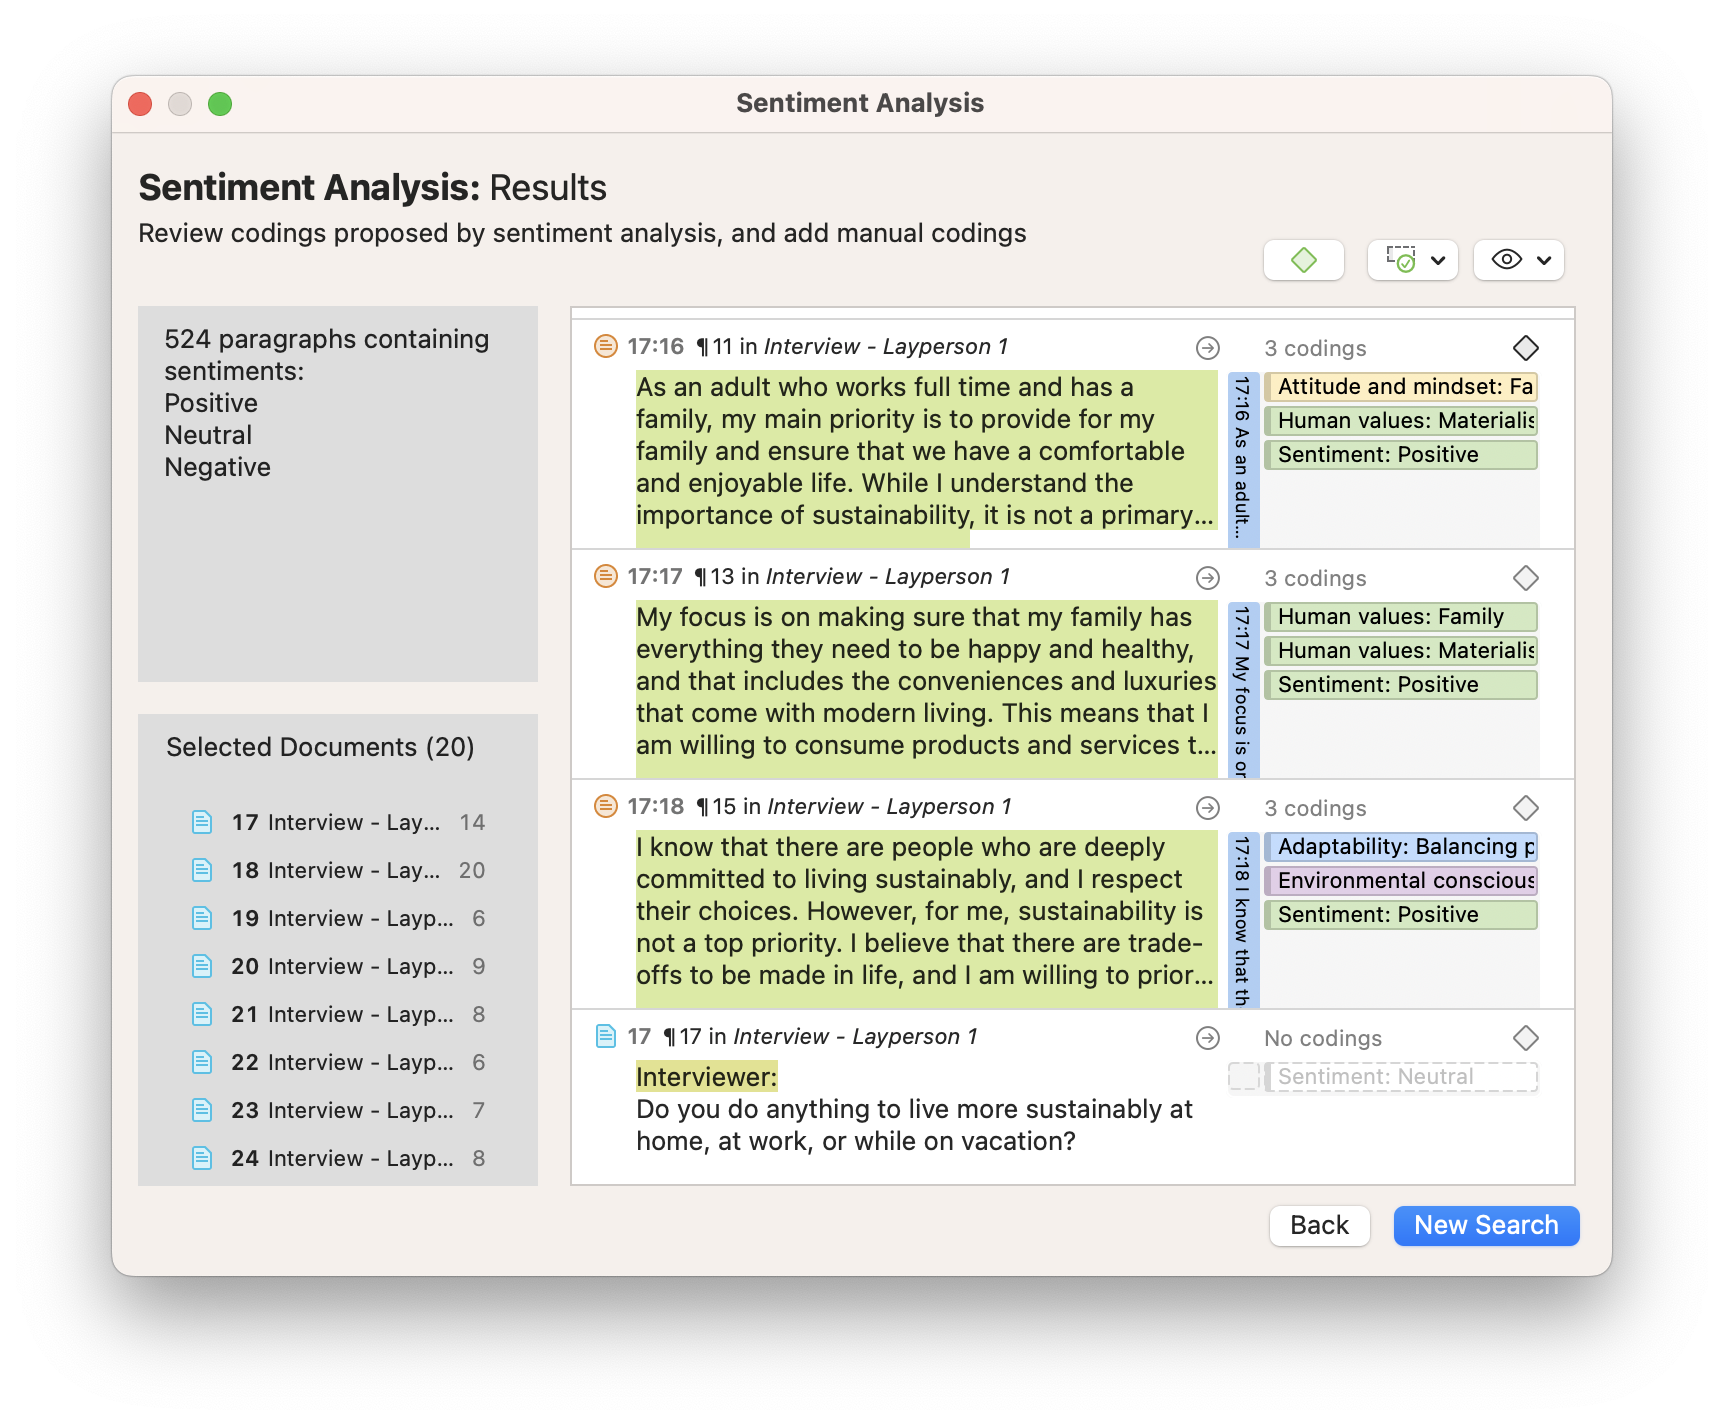
For instance, you can get a feeling for the sentiments expressed in the data. Who is more optimistic, pessimistic, or neutral in their responses? ATLAS.ti can auto-code the positive, negative, and neutral sentiments in your data. Naturally, you can also simply browse through your data and highlight relevant segments that catch your attention or attach codes to begin condensing the data.
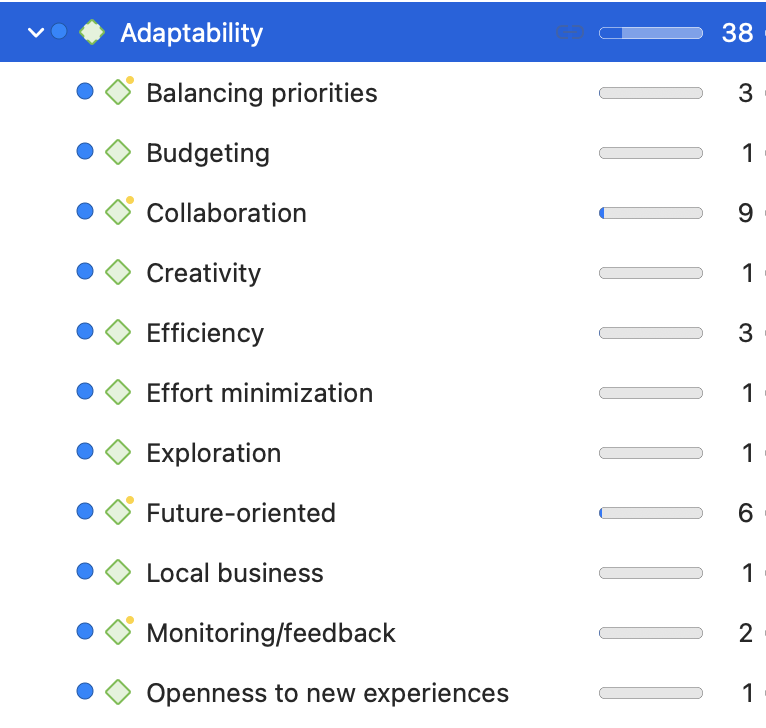
Step 4: Build a code system
Whether you start with auto-coding or manual coding, after having generated some first codes, you need to get some order in your code system to develop a cohesive understanding. You can build your code system by sorting codes into groups and creating categories and subcodes. As this process requires reading and re-reading your data, you will become very familiar with your data. Counting on a tool like ATLAS.ti qualitative data analysis software will support you in the process and make it easier to review your data, modify codings if necessary, change code labels, and write operational definitions to explain what each code means.
Step 5: Query your coded data and write up the analysis
Once you have coded your data, it is time to take the analysis a step further. When using software for qualitative data analysis, it is easy to compare and contrast subsets in your data, such as groups of participants or sets of themes.
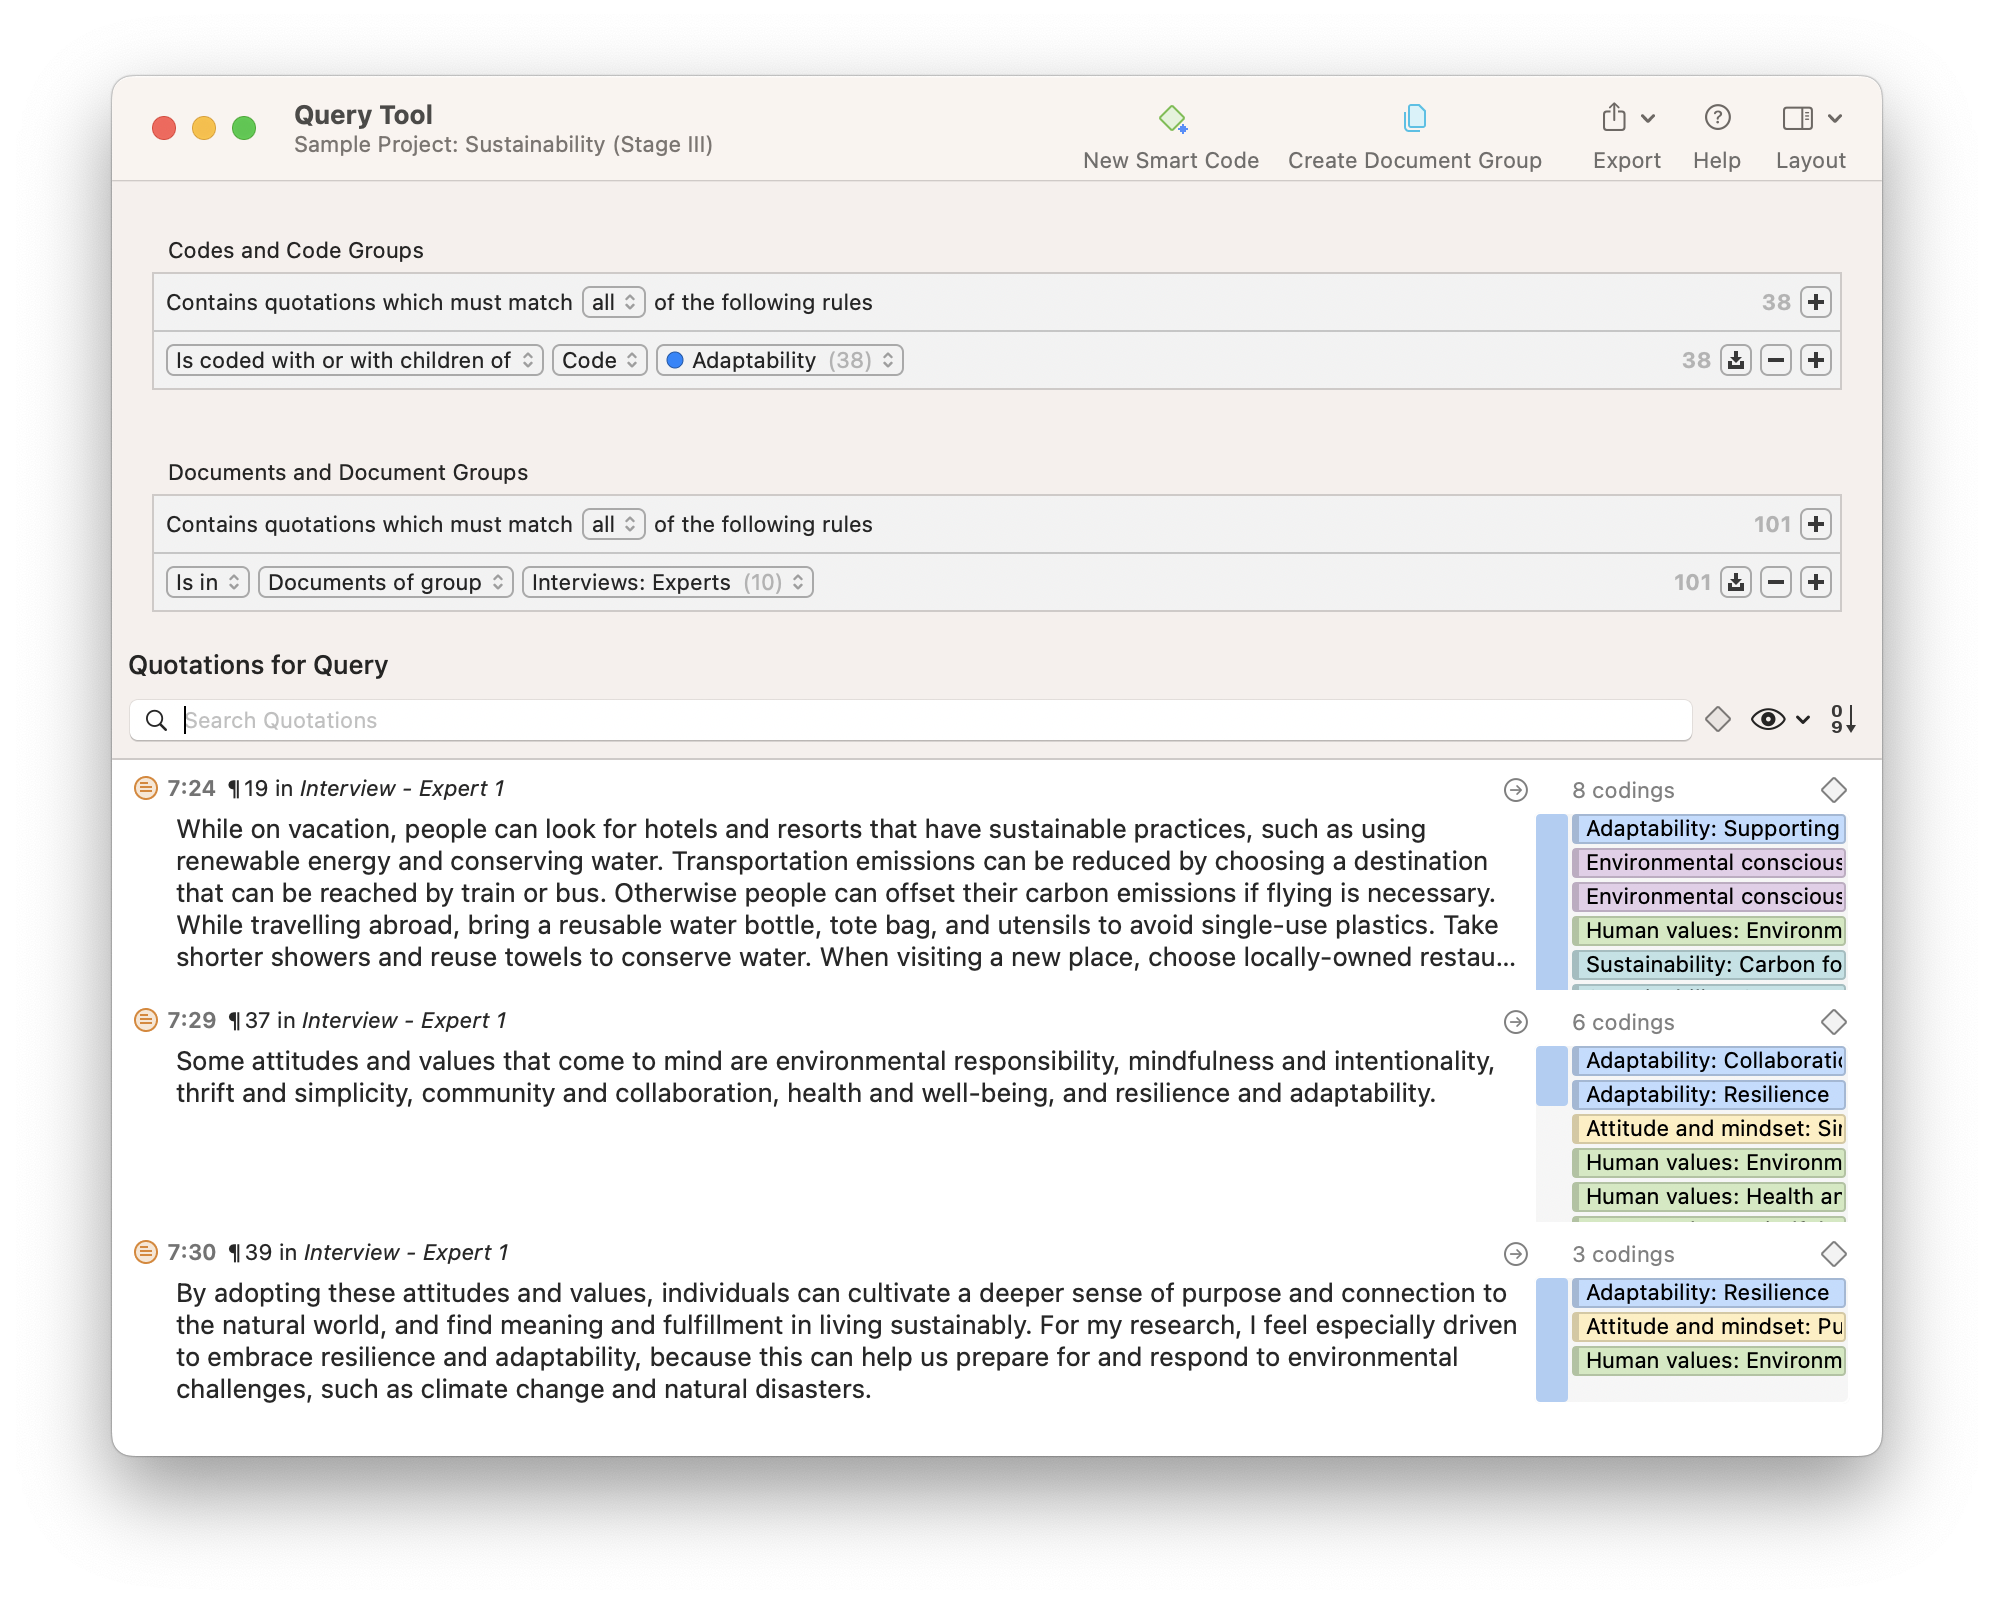
For instance, you can query the various opinions of female vs. male respondents. Is there a difference between consumers from rural or urban areas or among different age groups or educational levels? Which codes occur together throughout the data set? Are there relationships between various concepts, and if so, why?
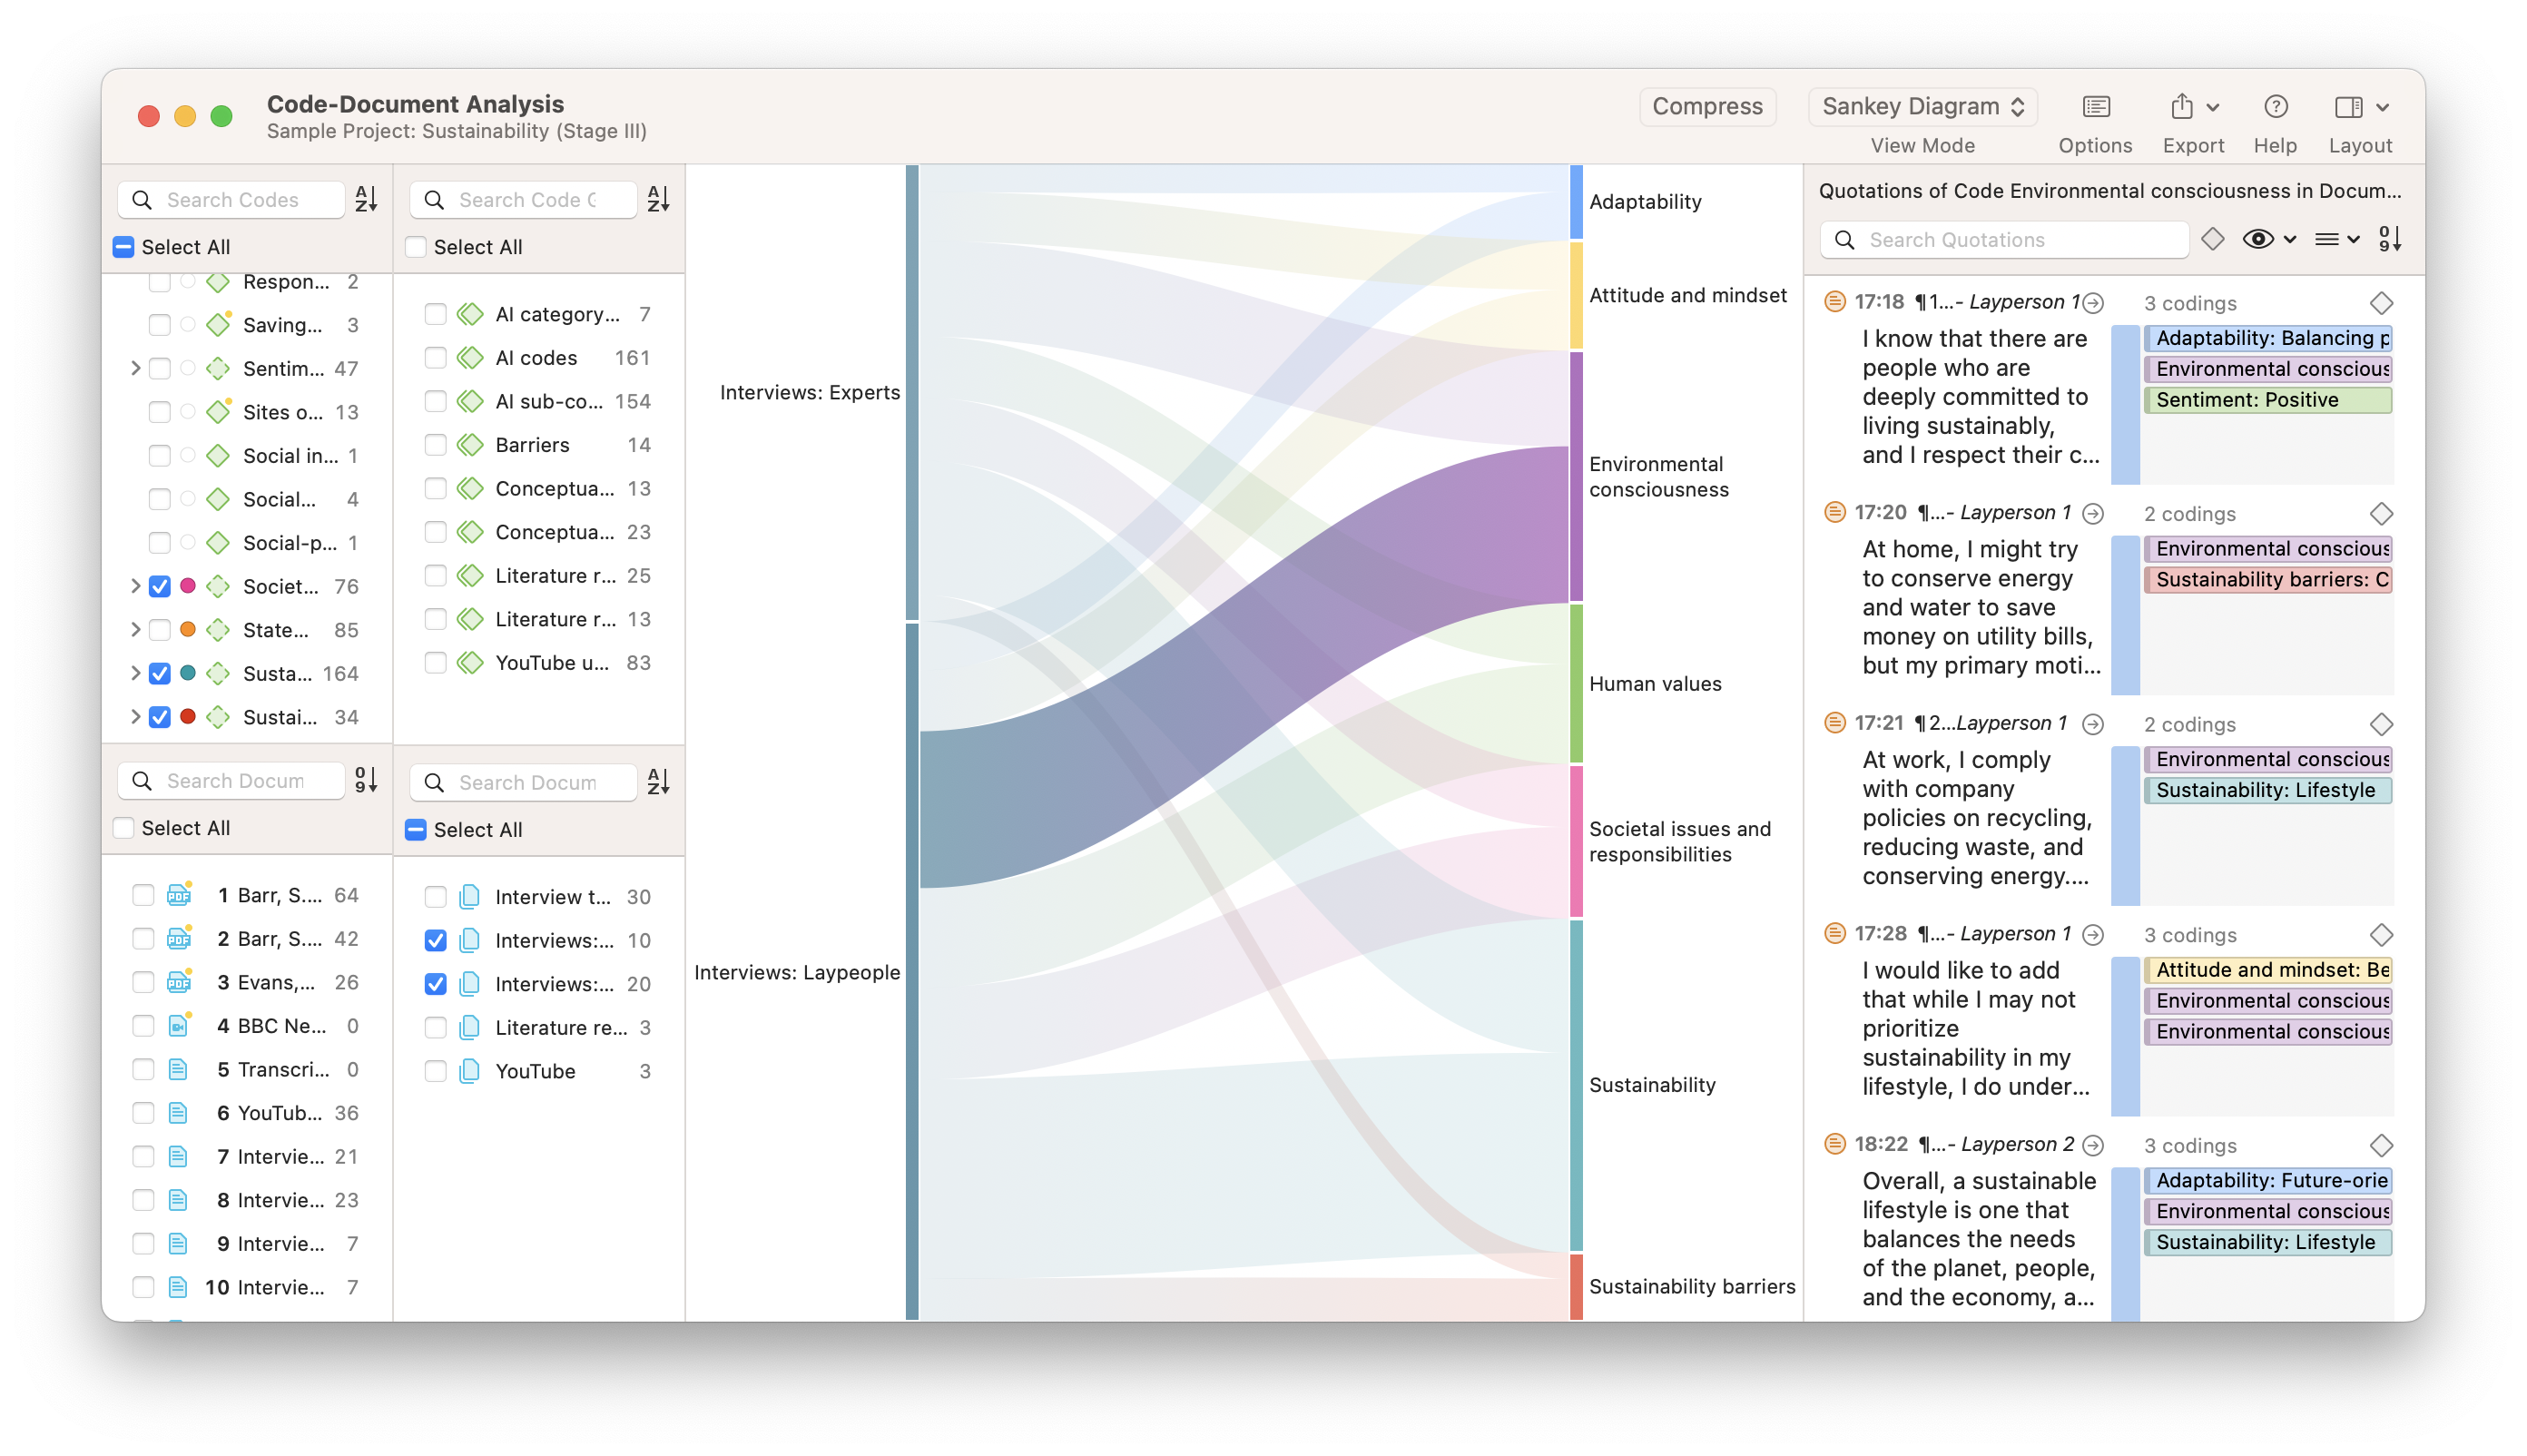
Step 6: Data visualization
Data visualization brings your data to life. It is a powerful way of seeing patterns and relationships in your data. For instance, diagrams allow you to see how your codes are distributed across documents or specific subpopulations in your data.
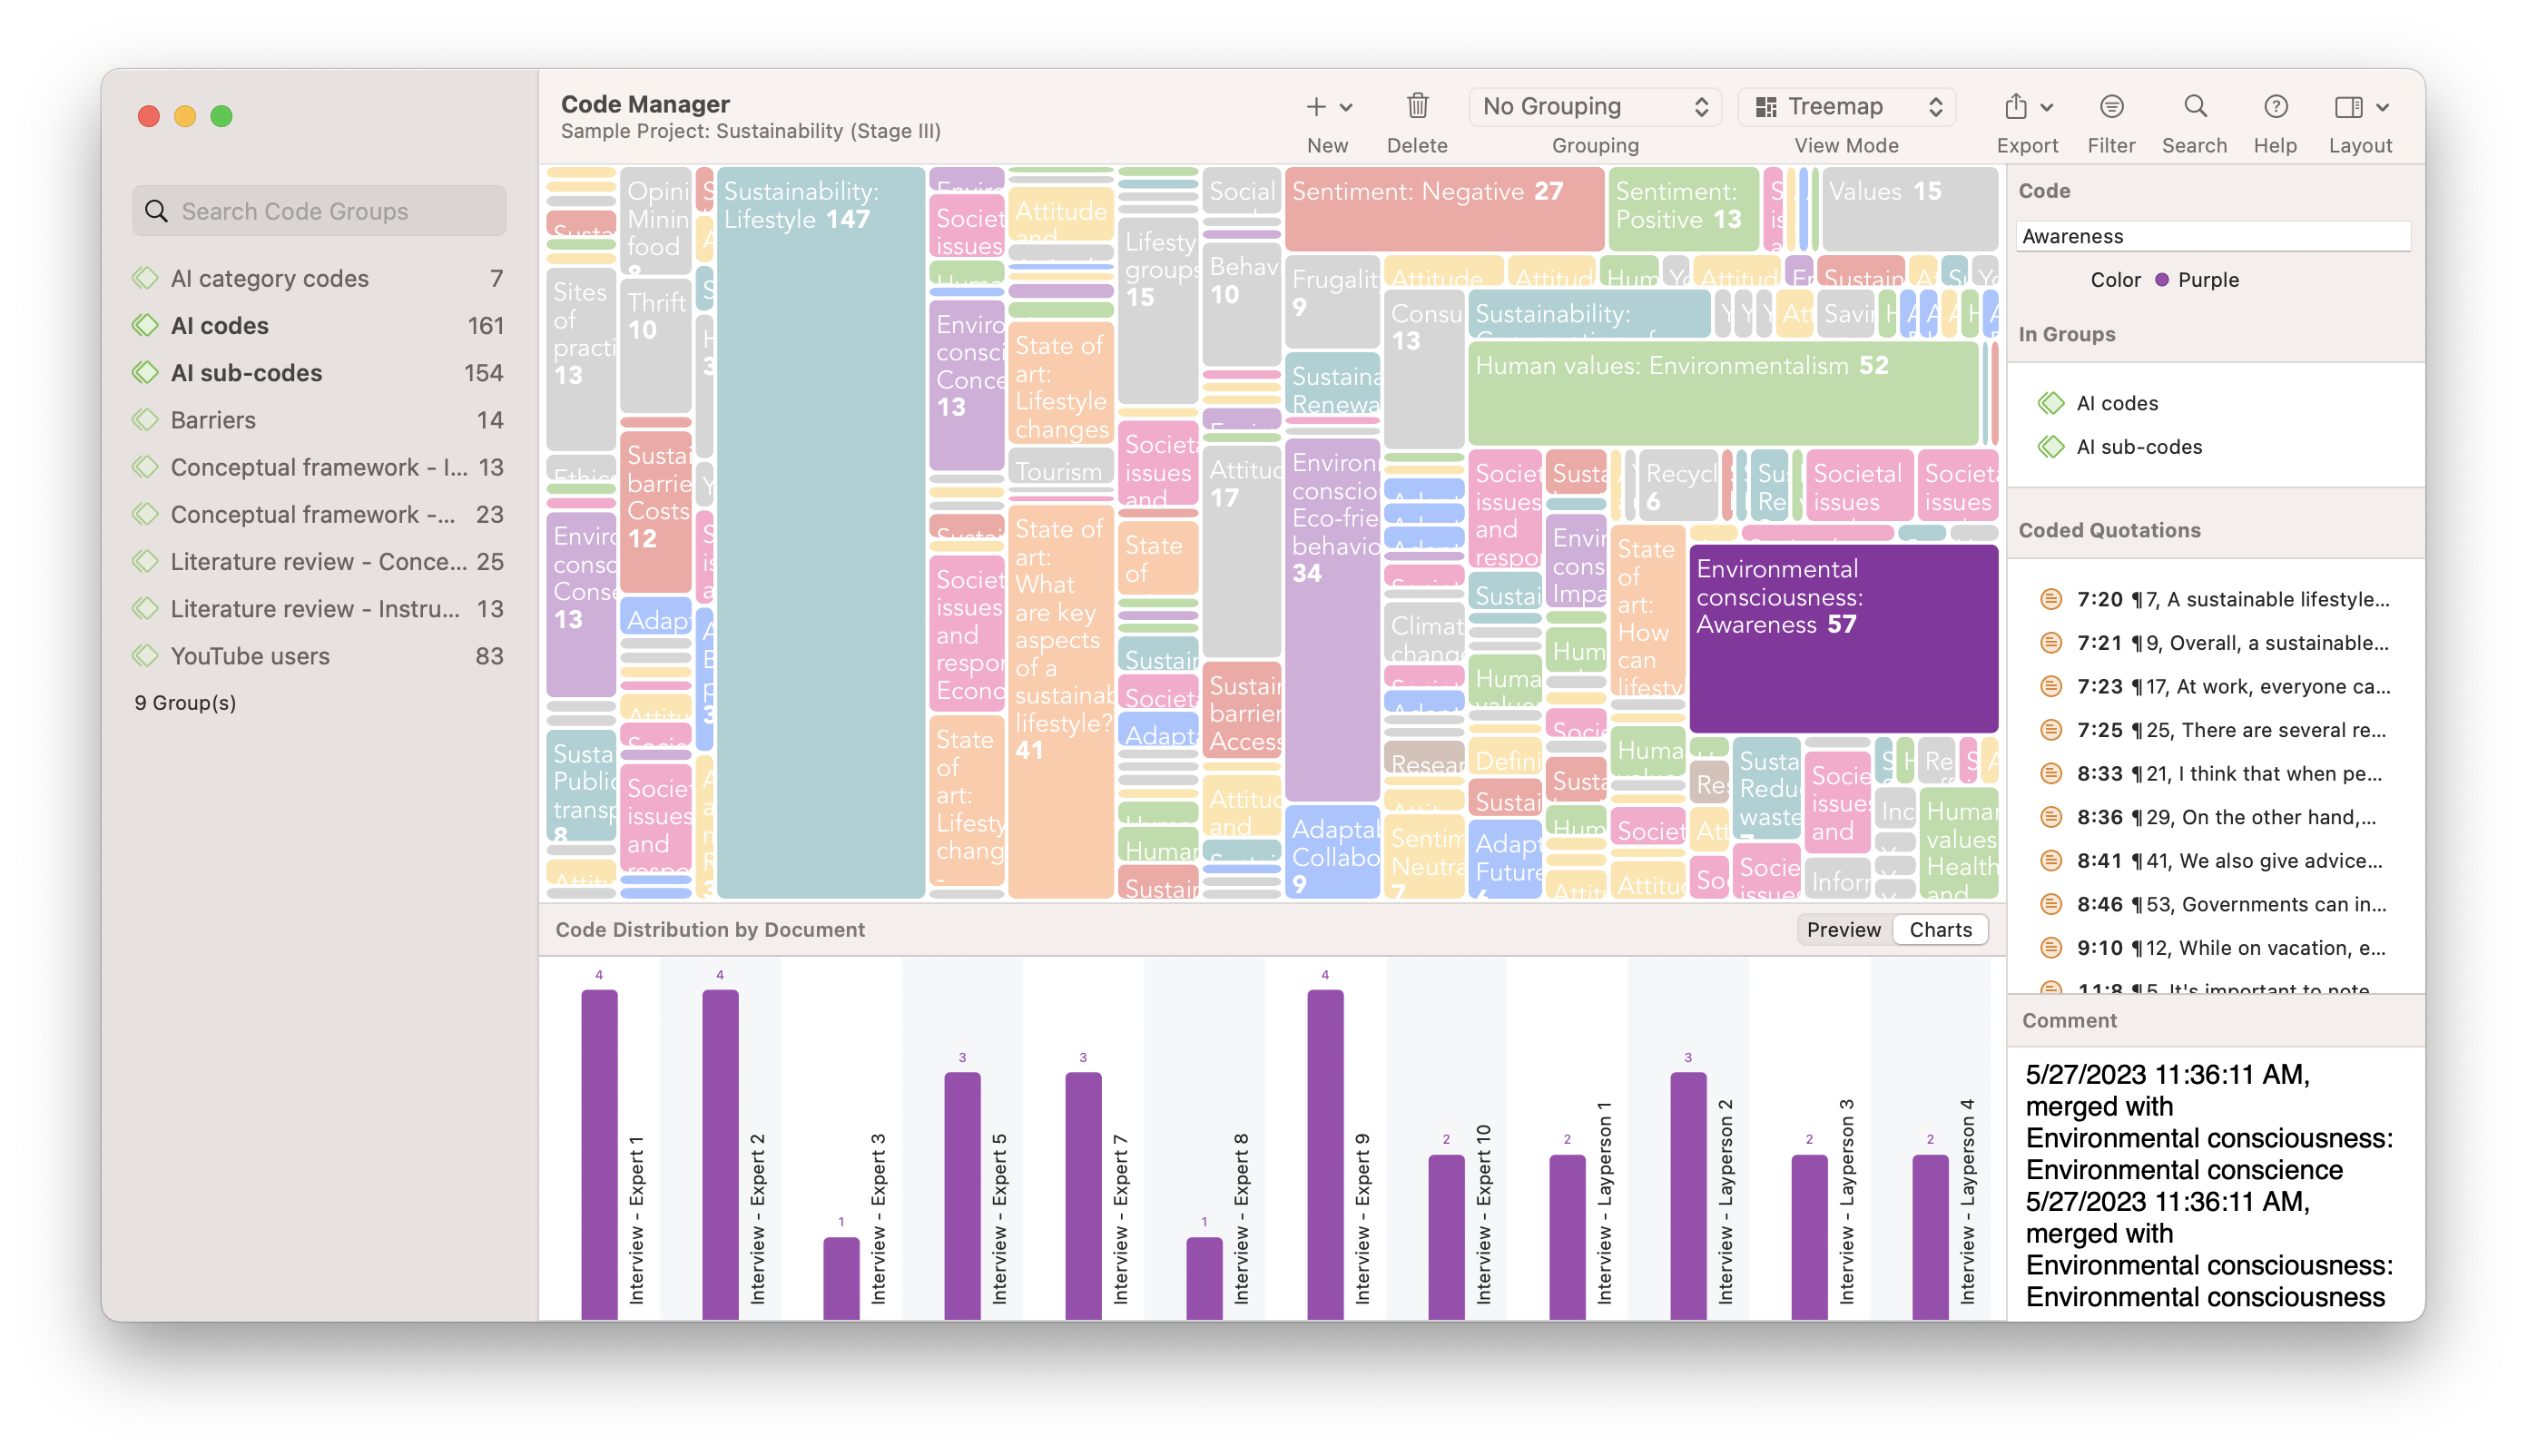
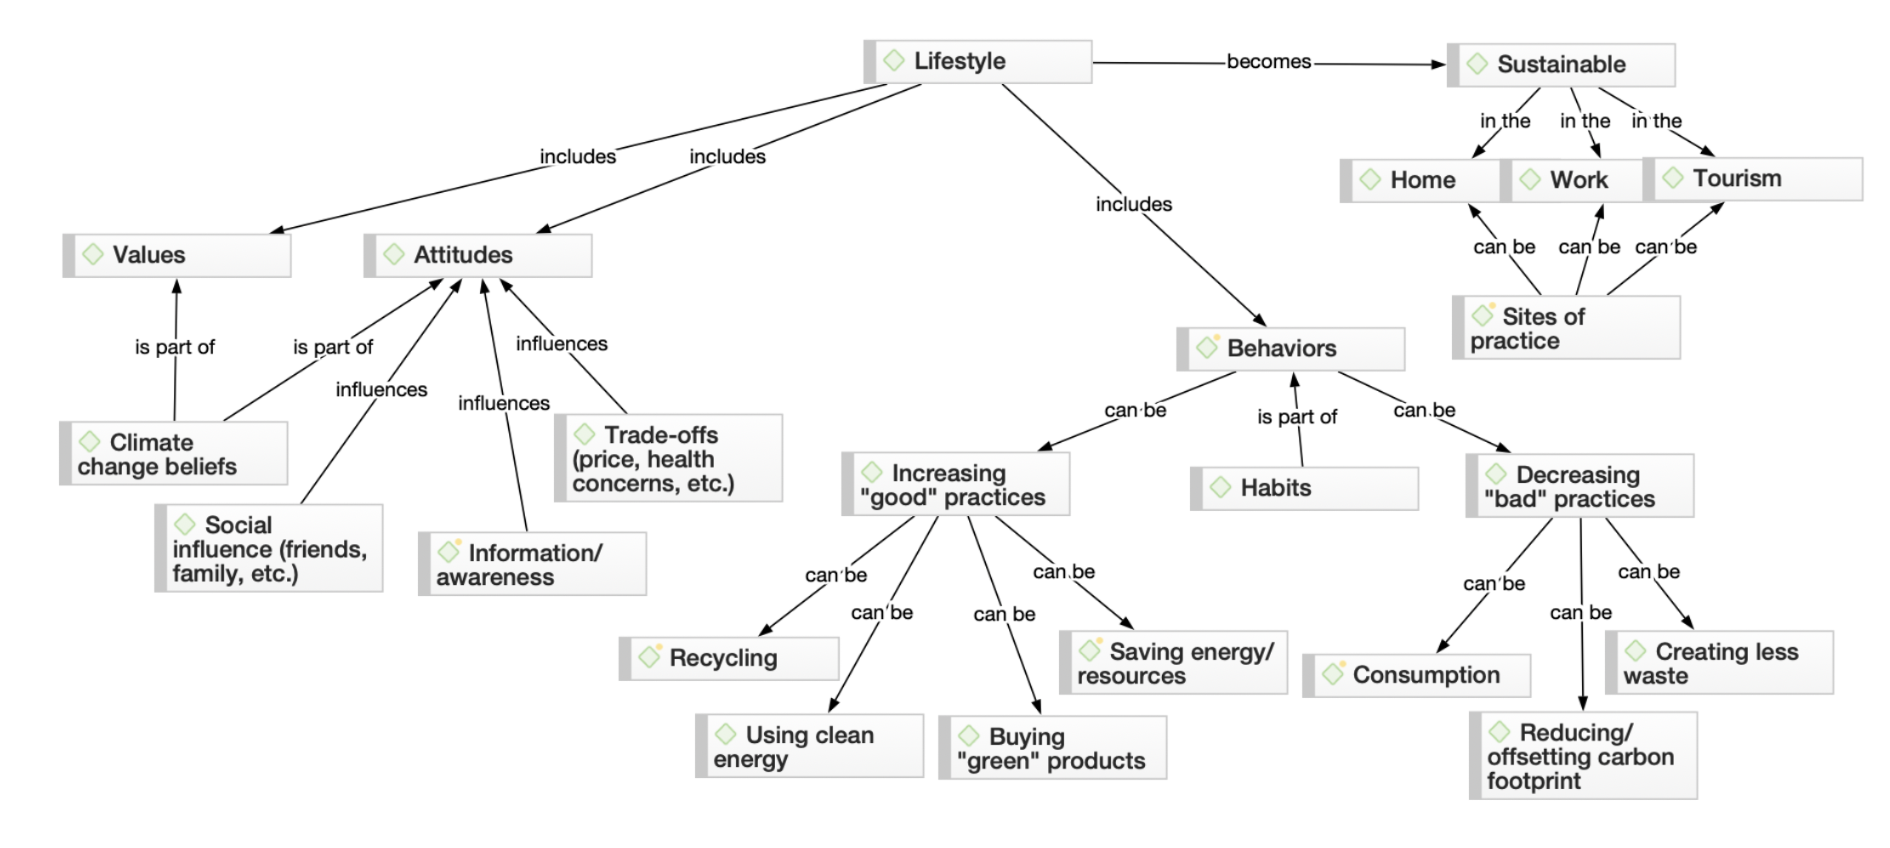
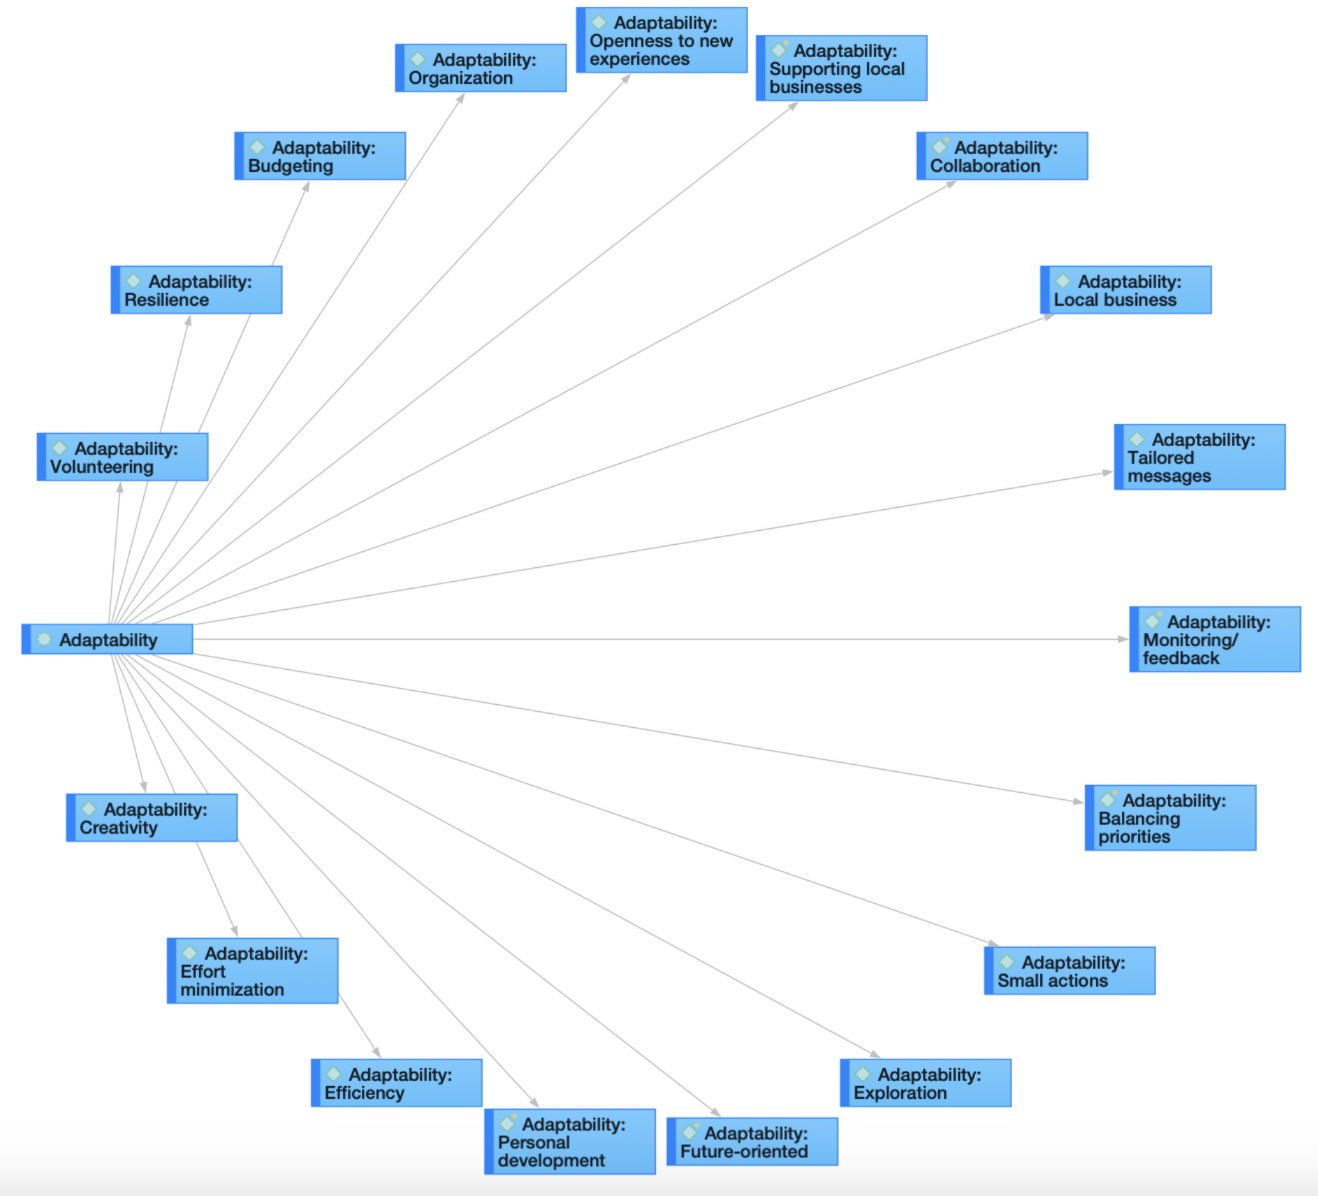
Exploring coded data on a canvas, moving around code labels in a virtual space, linking codes and other elements of your data set, and thinking about how they are related and why – all of these will advance your analysis and spur further insights. Visuals are also great for communicating results to others.
Step 7: Data presentation
The final step is to summarize the analysis in a written report. You can now put together the memos you have written about the various topics, select some salient quotes that illustrate your writing, and add visuals such as tables and diagrams. If you follow the steps above, you will already have all the building blocks, and you just have to put them together in a report or presentation.
When preparing a report or a presentation, keep your audience in mind. Does your audience better understand numbers than long sections of detailed interpretations? If so, add more tables, charts, and short supportive data quotes to your report or presentation. If your audience loves a good interpretation, add your full-length memos and walk your audience through your conceptual networks and illustrative data quotes.