
- What is Mixed Methods Research?
- Advantages of Mixed Methods Research
- Challenges in Mixed Methods Research
- Common Mistakes in Mixed Methods Research
- Mixed Methods Research Paradigms
- Validity & Reliability in Mixed Methods Research
- Ethical Considerations in Mixed Methods Research
- Mixed Methods vs. Multiple Methods Research
- Mixed Methods Research Designs
- How to Choose the Right Mixed Methods Design
- Convergent Parallel Design
- Explanatory Sequential Design
- Exploratory Sequential Design
- Embedded Mixed Methods Research Design
- Transformative Mixed Methods Design
- Multiphase Mixed Methods Research Design
- How to Conduct Mixed Methods Research
- Sampling Strategies in Mixed Methods Research
- Data Collection in Mixed Methods Research
- Triangulation in Mixed Methods Research
- Data Analysis in Mixed Methods Research
- How to Integrate Quantitative & Qualitative Data?
- How to Interpret Mixed Methods Research Findings?
- Software Tools for Mixed Methods Data Analysis
- How to Write a Mixed Methods Research Proposal
- How to Write a Mixed Methods Research Paper?
- Reporting Results in Mixed Methods Research
- Mixed Methods Research Examples
- How to cite "The Guide to Mixed Methods Research"
Software Tools for Mixed Methods Data Analysis
Mixed methods research, which integrates quantitative and qualitative data, has become increasingly popular across various disciplines, including health, social sciences, and education. Mixed methods offers the advantage of capturing comprehensive qualitative and quantitative data, providing richer insights into complex phenomena. As mixed methods research evolves, so too does the need for robust mixed methods software that can manage the intricacies of qualitative and quantitative data collection, analysis, and integration.

Introduction
The complexity of mixed methods research arises from the necessity to handle diverse datasets—ranging from numerical data to textual narratives—and to synthesize findings in a coherent manner. Software can streamline this process, offering functionalities that support both qualitative coding and quantitative statistical analysis. Additionally, these tools often provide features for data visualization, aiding researchers in presenting their mixed methods findings effectively.
Choosing the right software can significantly enhance the efficiency and rigor of a mixed methods study. Factors such as the type of quantitative and qualitative data, research design, and the level of integration required should guide the selection process.
Choosing the right tool for your mixed methods research
Selecting the best software for mixed methods research is a critical decision that can significantly impact the efficiency, quality, and outcomes of your study. The ideal tool depends on several factors, including your research goals, budget, technical expertise, and collaboration requirements. Below is a detailed explanation of these considerations to help you make an informed choice.
Research needs
The goal of your research question and project will heavily influence which tools are most suitable. Consider if your mixed methods research leans heavily toward qualitative data or quantitative data as well as the type of data you will be analyzing. For instance, if working with interviews, focus groups, or textual analysis, qualitative software like NVivo or ATLAS.ti are excellent choices. These tools specialize in coding, identifying themes, and visualizing qualitative data. They also feature artificial intelligence and automatic transcription, which will assist with time-consuming tasks such as transcription.
If your study is more based around quantitative methods (e.g., surveys, experiments, or statistical modelling), tools like SPSS, Stata, or R are better suited for advanced statistical analysis and data management. On the other hand, as mixed methods research often depends on both qualitative and quantitative data, you may prefer to count on both qualitative and quantitative software so that you can harness advanced features of each to develop robust conclusions and actionable insights.
Budget
The cost of research software can vary widely, so it’s important to consider your budget when selecting a tool. If you have limited funding, open-source tools like RQDA (for qualitative analysis in R), Weft QDA, or Google Sheets can provide basic functionality without financial investment. Most professional tools operate on a subscription model and often offer free trials, so you can also test them before committing.
Technical skills
of software. If you prefer intuitive, point-and-click interfaces, some tools like ATLAS.ti and NVivo are designed to be accessible to researchers without advanced technical skills.
If you have computer coding experience or are willing to learn, tools like R (with packages like RQDA) or Python (with libraries like Pandas or NLTK) offer unparalleled flexibility and customization for both qualitative and quantitative data analysis.
Consider the time and effort required to learn a new tool. Some platforms, like Tableau for visualization or Miro for collaborative analysis, have a relatively low learning curve, while others, like Stata or R, may require more training and some computer coding skills.
Collaboration needs
If you’re working as part of a team, collaboration features become a key consideration when selecting a tool for mixed methods research. Cloud-based platforms like ATLAS.ti Web and Miro allow multiple users to work on the same project simultaneously, making them ideal for team-based research. Tools such as Google Sheets or GitHub (for R or Python scripts) enable version control, ensuring that team members can track changes, avoid conflicts, and maintain a clear record of the research process.
ATLAS.ti and NVivo also offer strong collaboration options, allowing teams to share projects, work collaboratively, and leave comments for one another, streamlining the analysis process and enhancing team coordination. These features are particularly valuable for large or complex projects where multiple researchers are involved.
Security, scalability and support
Ensure the tool you choose complies with ethical and institutional requirements for data security, especially when working with sensitive or confidential information. Consider whether the tool can handle the size and complexity of your dataset. Pay attention to whether a software has any restrictions on the amount of data that can be analyzed, and make sure to choose a tool that suits the needs of your project. Check if the software provider offers tutorials, customer support, or training resources to help you get started and troubleshoot issues.
Qualitative data analysis software
Qualitative analysis software, also known as Computer-Assisted Qualitative Data Analysis Software (CAQDAS), is designed to help researchers organize, code, analyze, and interpret non-numerical data such as text, audio, video, and images.
ATLAS.ti
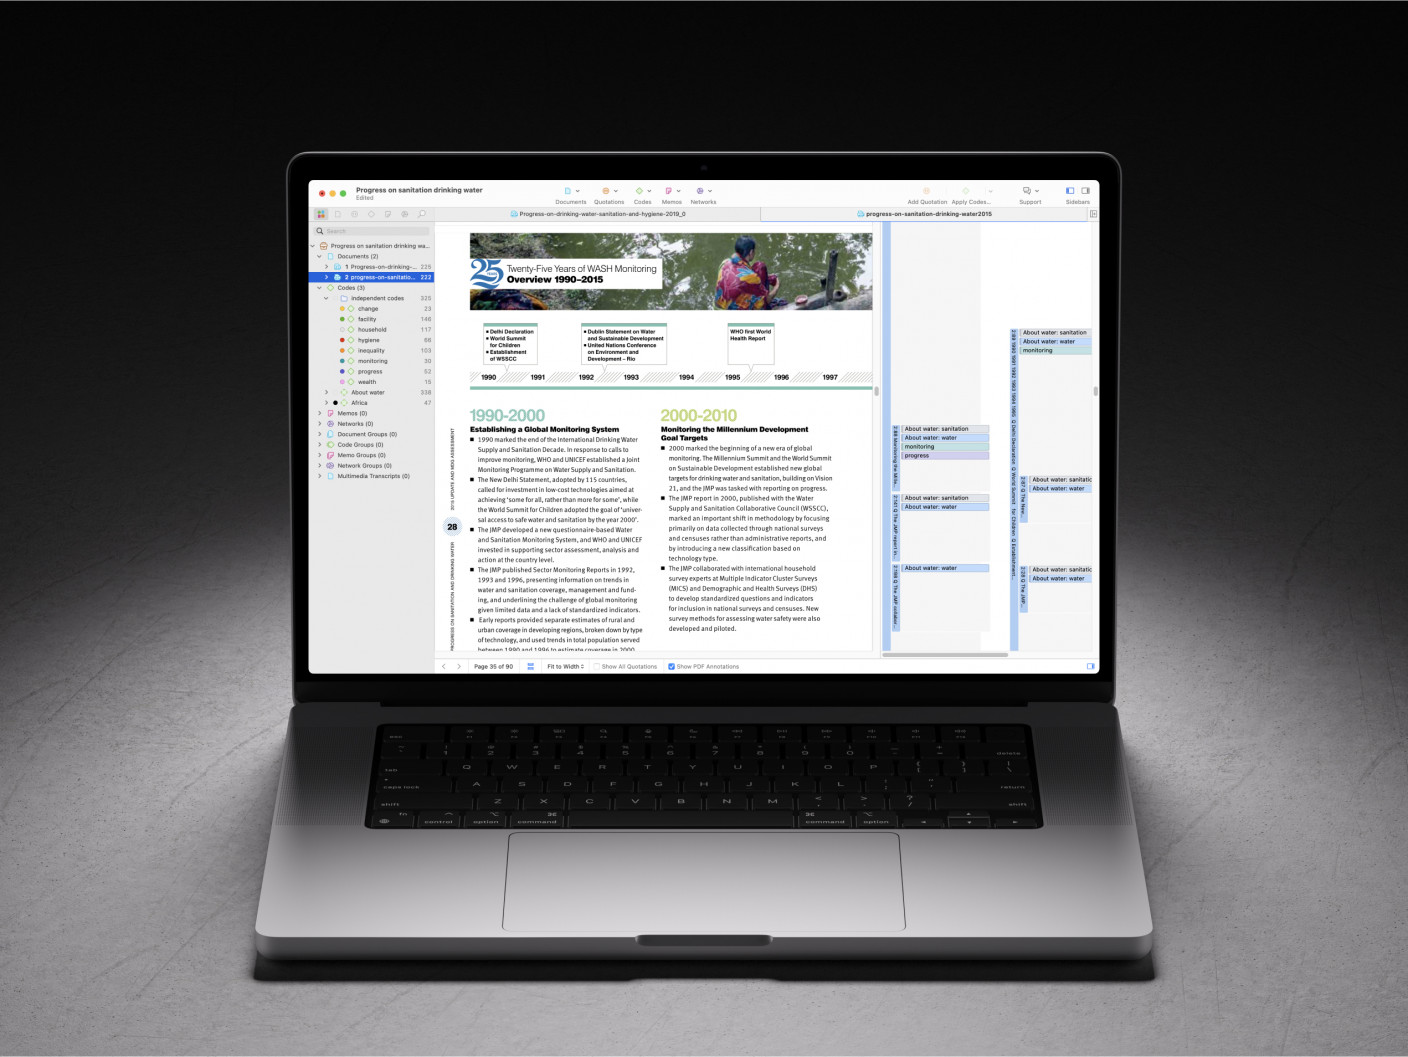
ATLAS.ti is a leading software for mixed methods research, seamlessly integrating qualitative and quantitative analysis. It supports diverse data formats, including text, audio, video, images, and structured survey data, allowing researchers to analyze complex datasets holistically. Its AI-powered automatic transcription converts audio and video into text, enabling more efficient analysis of interviews and focus groups. Auto-coding features can also facilitate qualitative coding by searching data, identifying patterns, and gauging sentiments.
For data exploration, word frequency analysis and entity recognition can conduct a content analysis and systematic review of all the data. Co-occurrence analysis uncovers links between codes, while code co-occurrence maps and network diagrams provide visual representations of data patterns. ATLAS.ti also bridges qualitative and quantitative data analysis by offering descriptive statistics for coded qualitative data and export options to SPSS, Excel, and R for further statistical analysis.
Collaboration is enhanced through ATLAS.ti Web, which enables real-time teamwork, while the Desktop version supports in-depth offline analysis. With its powerful coding, AI-driven transcription, visualization tools, and mixed methods integration, ATLAS.ti is an essential tool for researchers seeking structured and efficient data analysis.
NVivo
NVivo supports mixed methods research by enabling qualitative analysis of data while complementing statistical tools used for quantitative analysis. NVivo allows researchers to import survey data from sources like Excel, text files, Qualtrics, and SurveyMonkey, automatically classifying cases and coding open-ended responses. Researchers can sort, filter, and code datasets, facilitating thematic analysis of qualitative data while maintaining structured case attributes. Through queries and visualization tools, NVivo helps integrate qualitative insights with quantitative findings, strengthening the depth and breadth of mixed methods research. By linking coded qualitative responses with statistical analyses, NVivo enhances the interpretation of complex datasets, making it a valuable tool for researchers working across methodological boundaries.
Quantitative data analysis software
Excel
Microsoft Excel is a spreadsheet software developed by Microsoft, widely used for data organization, analysis, and visualization. It allows users to create and manipulate spreadsheets containing numerical data, text, and formulas across a grid of rows and columns. Excel provides powerful tools for performing calculations, statistical analysis, and data modeling through built-in functions, pivot tables, and charting features. It is commonly used in various fields such as finance, research, business, and academia for tasks like budgeting, data tracking, and project management. Additionally, Excel supports automation through macros and Visual Basic for Applications (VBA), enabling users to streamline repetitive tasks and enhance productivity. The software is available as part of the Microsoft Office suite and Microsoft 365, with both desktop and cloud-based versions for accessibility across devices.
XLSTAT
XLSTAT by Lumivero is a statistical software add-on for Microsoft Excel that supports quantitative research through data analysis, visualization, and reporting. Its seamless integration with Excel makes it accessible to researchers, analysts, and professionals who require advanced statistical tools within a familiar interface.
The software offers robust data analysis features, including regression analysis, classification, and hypothesis testing. Users can visualize data through charts and tables, making complex findings easier to interpret. XLSTAT also streamlines data preparation, which allows for efficient cleaning and processing before analysis. Its reporting capabilities help create detailed summaries, ensuring clarity in presenting key insights.
XLSTAT supports data segmentation using clustering techniques, which is valuable for marketing and consumer research. Forecasting tools enable users to predict trends across industries, aiding strategic planning. The software also facilitates text data analysis by detecting and coding themes in survey responses, making qualitative research more efficient.
Applications include marketing, research tracking, and hypothesis testing. Marketers can use tools like conjoint analysis and churn analysis to understand customer preferences, while researchers can track trends over time. XLSTAT provides a user-friendly yet powerful solution for statistical analysis in business, academia, and market research.
SPSS
IBM SPSS Statistics is a comprehensive statistical software platform designed to handle complex data analysis, data management, and advanced statistical modelling. It offers a wide range of tools for descriptive statistics, regression analysis, hypothesis testing, and predictive analytics, making it suitable for researchers, businesses, and analysts. The software supports advanced techniques such as factor analysis, cluster analysis, and ANOVA, enabling users to uncover patterns and relationships in their data.
Additionally, SPSS provides robust data management capabilities, including data preparation, cleaning, and transformation, as well as tools for handling missing data and creating derived variables. Its predictive analytics features include machine learning algorithms like decision trees, neural networks, and support vector machines, allowing users to build and validate models for forecasting and decision-making. SPSS also excels in data visualization, offering customizable charts and graphs to present data clearly and effectively.
The platform is highly versatile, integrating seamlessly with other IBM products like Watson Studio and Cognos Analytics, and supports data import/export from various formats, including Excel and CSV. Automation and scripting capabilities, including support for Python and R extensions, enable users to streamline repetitive tasks and customize analyses.
Stata
Stata is a powerful statistical software package widely used in fields such as economics, biomedicine, epidemiology, and sociology for data management, statistical analysis, and visualization. It offers robust tools for handling large datasets, performing advanced statistical modeling, and generating publication-quality graphics. Stata stands out for its user-friendly interface, extensive documentation, and strong community support, making it accessible for both beginners and experienced researchers. Compared to other statistical software, it provides high efficiency, reproducible research capabilities, and seamless version control, ensuring consistency across analyses.
R (with RStudio)
R, along with RStudio, is a powerful tool for mixed methods research, allowing researchers to analyze both quantitative and qualitative data within a single environment. For qualitative analysis, R provides tools for text mining, sentiment analysis, and natural language processing through packages like tidytext and quanteda, enabling the coding and structuring of textual data. It also supports computer-assisted qualitative data analysis (CAQDAS), though some packages like RQDA have faced maintenance challenges, limiting their usability. On the quantitative side, R excels in statistical modelling, data visualization, and machine learning, making it an ideal choice for researchers integrating qualitative insights with numerical data. Its open-source and customizable nature makes it accessible to researchers with budget constraints, and its ability to integrate with Python, SQL, ATLAS.ti, and NVivo enhances its versatility. However, its steep learning curve and reliance on computer coding can be a drawback for researchers unfamiliar with programming. Despite this, R remains a valuable tool for automated, reproducible, and scalable mixed methods research.
Reference management tools
Citavi
Citavi by Lumivero is widely used in academic settings and supports multiple languages, including English, French, German, Italian, Polish, Portuguese, and Spanish. It combines reference management with task planning, allowing researchers to organize their sources, manage quotations, and plan tasks within a single application. This integration is particularly useful in mixed methods research, where managing diverse sources of information, such as literature and secondary sources of data, is crucial.
Mendeley
Mendeley is a reference management software designed to assist researchers in organizing and managing their references efficiently. It allows users to build a personal library to organize, search, and read all their references. Additionally, Mendeley offers tools like Mendeley Notebook, which helps users collate all their highlights and notes from multiple PDFs, and Mendeley Cite, a citation add-in for Microsoft Word that simplifies the referencing process. The platform also provides a Web Importer, enabling users to import papers, web pages, and other documents directly into their reference library from search engines and academic databases. Mendeley is available for Windows, macOS, and Linux operating systems.
Zotero
Zotero is a free, open-source reference management tool that helps researchers collect, organize, cite, and share their research materials. It allows users to save references directly from web browsers, organize them into collections, and tag them with keywords for easy retrieval. Zotero supports integration with word processors like Microsoft Word, LibreOffice, and Google Docs, enabling seamless citation and bibliography creation in over 9,000 citation styles. Its open-source nature and active development community ensure continuous improvements and support.
Conclusion
Mixed methods researchers have the advantage of choosing from a diverse range of software tools tailored to analyze qualitative data, quantitative data, or secondary sources. However, it is important to recognize that no single tool fully supports the entire spectrum of mixed methods research. Often, researchers will need to combine multiple software solutions to address the unique demands of each data type. While this approach allows for deeper, more precise analysis of both qualitative and quantitative datasets, it also introduces challenges such as ensuring data compatibility, managing different interfaces, and maintaining consistency throughout the research process.
When selecting your tools, consider the specific needs of your mixed methods design. If your qualitative and quantitative data are collected and analyzed independently, you have the flexibility to use specialized tools for each without concern for integration. For example, you might use NVivo for in-depth qualitative coding and SPSS for advanced statistical analysis. On the other hand, if your study requires integrated analysis—where insights from qualitative data inform quantitative results or vice versa—choosing software that allows for data transferability becomes crucial. Certain tools, like ATLAS.ti and SPSS, offer features that support this integration, facilitating seamless data exchange and enabling comprehensive mixed methods analysis.
Ultimately, the key to successful mixed methods research lies in selecting a combination of software that aligns with your study's goals, complexity, and required level of data integration. Although navigating multiple platforms can add complexity, it also empowers you to leverage the strengths of each tool, resulting in richer, more nuanced research outcomes. By thoughtfully planning your software strategy, you can overcome potential challenges and make the most of your mixed methods research.
References
- Mortelmans, D. (2025). NVivo in mixed methods studies. In Doing qualitative data analysis with NVivo (pp. 217–227). Springer