

- What is Mixed Methods Research?
- Advantages of Mixed Methods Research
- Challenges in Mixed Methods Research
- Common Mistakes in Mixed Methods Research
- Mixed Methods Research Paradigms
- Validity & Reliability in Mixed Methods Research
- Ethical Considerations in Mixed Methods Research
- Mixed Methods vs. Multiple Methods Research
- Mixed Methods Research Designs
- How to Choose the Right Mixed Methods Design
- Convergent Parallel Design
- Explanatory Sequential Design
- Exploratory Sequential Design
- Embedded Mixed Methods Research Design
- Transformative Mixed Methods Design
- Multiphase Mixed Methods Research Design
- How to Conduct Mixed Methods Research
- Sampling Strategies in Mixed Methods Research
- Data Collection in Mixed Methods Research
- Triangulation in Mixed Methods Research
- Data Analysis in Mixed Methods Research
- How to Integrate Quantitative & Qualitative Data?
- How to Interpret Mixed Methods Research Findings?
- Software Tools for Mixed Methods Data Analysis
- How to Write a Mixed Methods Research Proposal
- How to Write a Mixed Methods Research Paper?
- Reporting Results in Mixed Methods Research
- Mixed Methods Research Examples
- How to cite "The Guide to Mixed Methods Research"
Data Analysis in Mixed Methods Research
Analyzing data in mixed methods research designs involves analyzing quantitative data and qualitative data separately and then integrating or mixing them. The analysis depends on the type of research questions or hypotheses in a study. In this article, we will go through the methodology described by Creswell and Plano Clark (2016) on how to conduct mixed methods analysis of both quantitative and qualitative data.

Introduction
Creswell and Plano Clark (2016) emphasize that the best approach in mixed methods research is to focus on the types of analyses (quantitative or qualitative) used to address mixed methods questions. Researchers analyze data to answer these questions through distinct steps and key decisions, which depend on the chosen mixed methods research design. By applying these analysis procedures, researchers represent, interpret, and validate data and results.
In quantitative and qualitative data analysis, researchers typically follow five linear steps from established research paradigms: preparing, exploring, analyzing, representing the data, and interpreting the analysis. They also validate and interpret the results. Each step follows a different procedure depending on whether the data is quantitative or qualitative.
Preparing data for analysis
A mixed methods study may involve both qualitative data collection and quantitative data collection, which can occur at the same time (such as in a convergent parallel design) or in separate phases (such as when following an explanatory sequential or exploratory sequential design). After collecting data, a crucial first step is to prepare the qualitative and quantitative components.
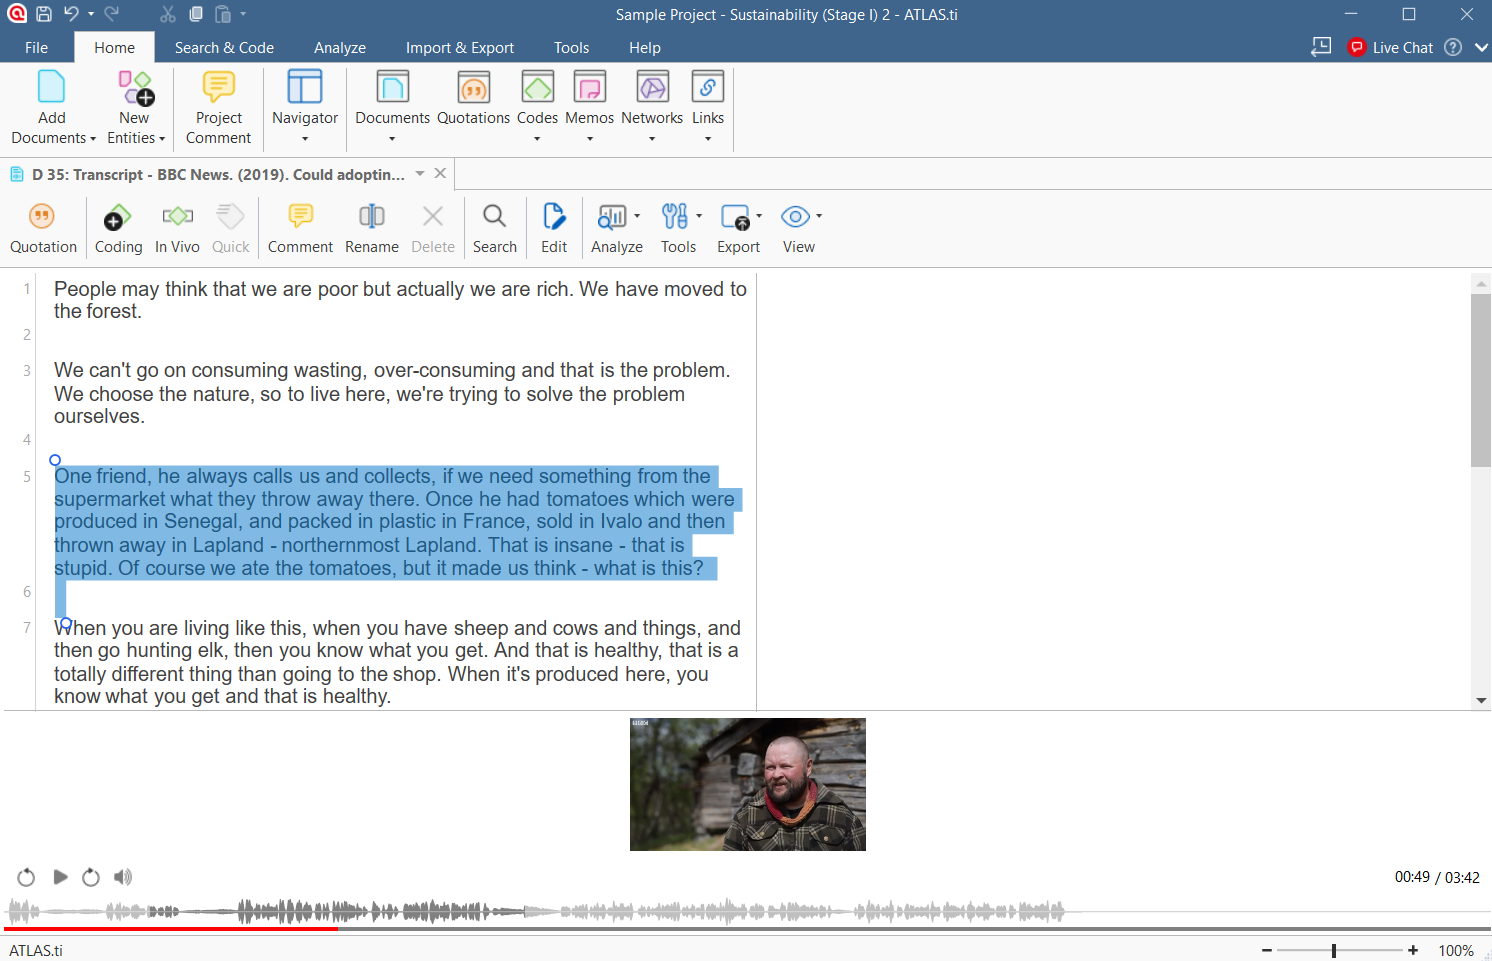
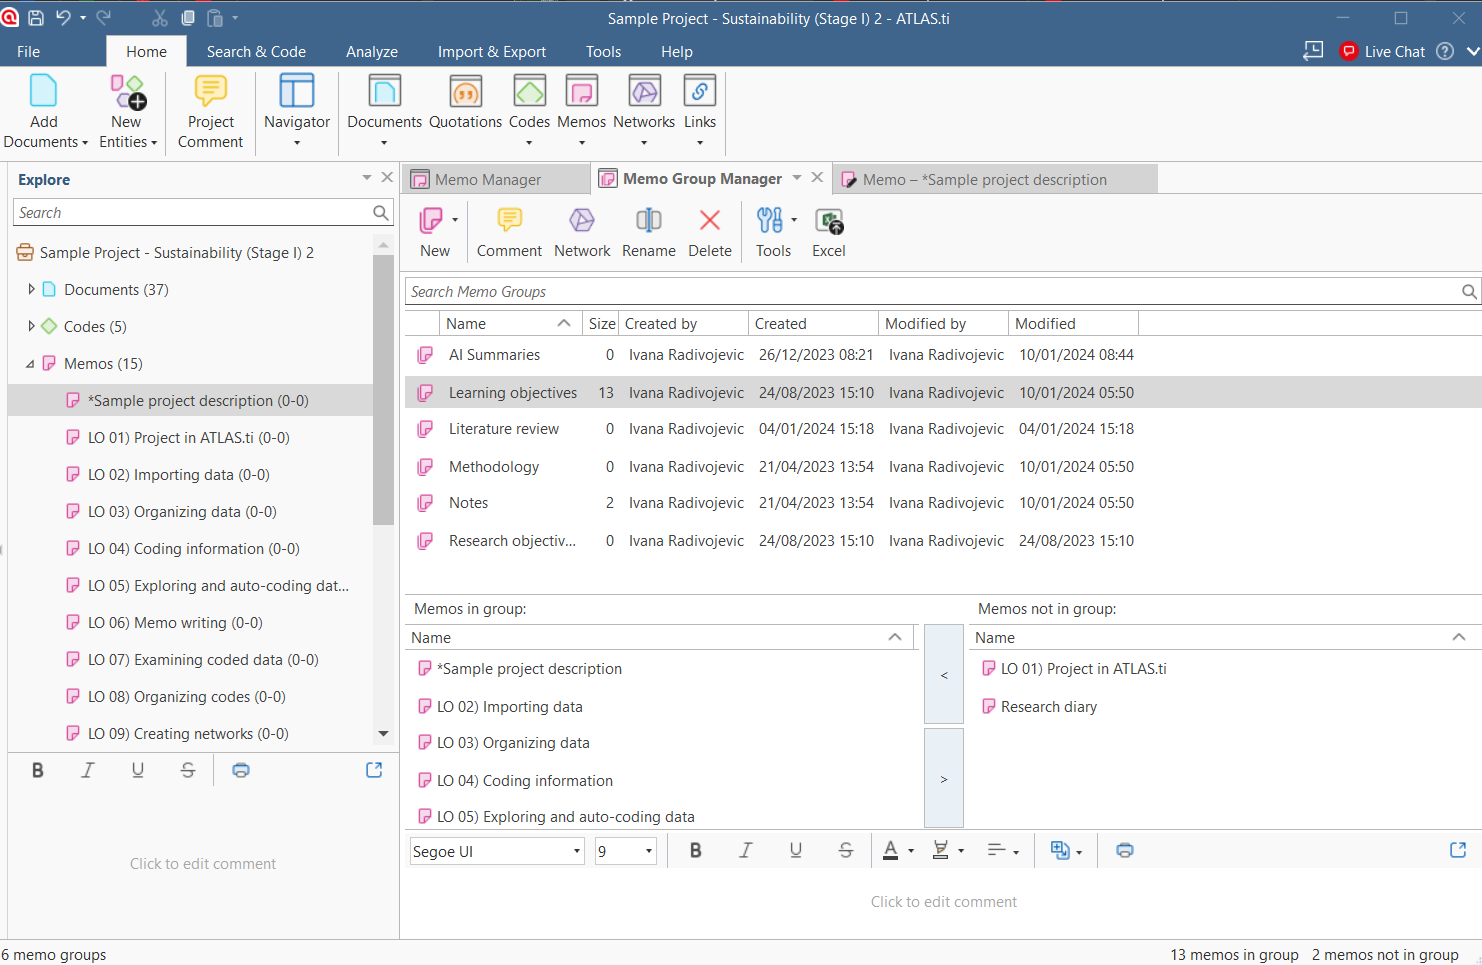
To prepare qualitative data for analysis, start by transcribing recordings from interviews, focus groups, or observations into a word processing file. Next, review the transcripts to ensure accuracy, then format and organize them for further analysis. Arrange the data by type, participant, or case to maintain a clear structure. Finally, format the files to work efficiently with qualitative analysis software like ATLAS.ti or NVivo.
To prepare quantitative data for analysis, assign a value to each response in a database using software like Excel, SPSS, or other quantitative tools. This process converts raw data into a usable format for analysis. Next, clean the database by checking for errors in data entry. If needed, recode items and compute new variables, such as summed scores or adjustments for inverted scales, using software like Statistical Program for the Social Sciences (SPSS), the Statistical Analysis System (SAS), R, and JMP software. Finally, create a codebook that lists each variable along with its name and definition for reference during analysis.
Exploring data
In this stage, you can examine the broad trends and preliminary database. Regardless of the mixed methods approach, it is often helpful to engage simultaneously in data collection and analysis, as initial explorations of numerical data and non-numerical data can provide helpful insights into the research study.
You could start by reading through all collected qualitative data, including field notes, journals, meeting minutes, pictures, and transcripts, to gain a general understanding. As you review, write memos to capture initial thoughts, which will help in forming categories like codes or themes. Then, develop initial codes and, if needed, create a qualitative codebook. This codebook can be based on previous literature or theories and helps organize the data while ensuring consistency among coders.
For quantitative data, begin by identifying trends in the dataset. Perform descriptive analyses for key variables, independent and dependent, and check whether the data follows a normal or non-normal distribution to determine appropriate statistical methods. Next, assess the reliability and validity of the measures to ensure accuracy. Finally, address any missing data using techniques like data imputation.
Analyzing data
Now it is time to examine the database to address the research questions or hypotheses. Choose an analysis approach that aligns with the research question(s) guiding the mixed methods study, which could involve each research approach being analyzed separately or applying some qualitative methods or quantitative methods across both data types.
Researchers can manually code qualitative data using software like ATLAS.ti or NVivo, which helps manage qualitative data by storing text and visual files, tagging segments with codes, generating visual representations, and identifying relationships between codes.
Begin coding by assigning labels to phrases, sentences, or paragraphs, then group similar codes together. These codes may come from participants’ own words (in vivo coding), researcher-generated labels, or established concepts in social sciences. As coding progresses, researchers identify broader themes and organize them into abstract categories or a theoretical model. Different approaches use these themes differently—for example, grounded theory develops categories for a theoretical framework, while narrative research sequences themes to build a personal story.
For quantitative data, select the appropriate inferential statistical tests based on the research questions, scale type, number of variables, and data distribution. The choice depends on whether the study aims to identify trends, compare groups, or examine relationships between variables, as well as whether the data follows a normal or non-normal distribution.
Use statistical software such as SPSS, R, SAS, or JMP to analyze data, starting with descriptive statistics before proceeding to inferential analysis. This may include testing for interaction effects, main effects, and conducting post hoc comparisons. Finally, perform inferential tests and calculate effect sizes and confidence intervals to interpret the significance and impact of the quantitative findings.
Representing data
The next stage of qualitative and quantitative data analysis in a mixed methods study involves summarizing and presenting the findings using statements, tables, or figures. Displaying the quantitative and qualitative results in different ways is an essential part of combining nuanced insights in mixed methods designs.
Presenting qualitative findings involves describing themes or categories and supporting them with evidence. Researchers can highlight key themes by including participant quotes, presenting multiple perspectives, and providing rich descriptions to ensure clarity and credibility. Visual elements such as figures, tables, and models can illustrate relationships between themes or depict conceptual frameworks.
Depending on the approach, researchers may use diagrams to display theoretical models in grounded theory, chronological sequences in narrative research, or comparative tables in ethnography. Maps may also represent the study setting to give context. To ensure consistency, findings should follow established style guidelines, such as APA formatting.

Quantitative results are typically presented through statistical summaries, tables, and graphs that display numerical patterns, relationships, or comparisons. Descriptive statistics provide an overview of trends, while inferential statistics help draw conclusions from the data.
Charts and figures, such as bar graphs, scatterplots, or histograms, visually represent data distributions and relationships. Tables organize numerical findings clearly, making it easier to compare variables. Adhering to style guidelines, such as APA, ensures proper formatting and clarity in reporting results.
Data interpretation
After presenting the findings, the researcher explains their significance, usually in the discussion section of a report. Interpreting results requires stepping back from the details and considering their broader implications in relation to the research problem, study questions or hypotheses, previous research, and the researcher’s own experiences.
InterpretiInterpreting qualitative findings begins with summarizing the key results and explaining how they address the research questions. For quantitative data, interpretation involves summarizing the main results and comparing them to the study’s hypotheses or research questions. In a mixed methods study, researchers may now bring together their quantitative and qualitative insights and consider how they contribute to their research objectives. Researchers can relate their findings to past studies or theoretical frameworks to provide context and highlight contributions to existing knowledge. It is also important to assess study limitations, noting factors that may have influenced the results. Finally, they outline implications for future research and practical applications for stakeholders or broader audiences.
Validate the data and results
Ensuring accuracy in data, results, and interpretations is essential for high-quality mixed methods research. While qualitative and quantitative methods define validity differently, both approaches assess the quality of data, findings, and interpretations to enhance credibility.
In qualitative research, validity takes precedence over reliability. Researchers assess whether data is credible, transferable, dependable, and confirmable. To enhance validity, they can utilize various validation strategies, such as member-checking, where participants review summaries of findings to confirm accuracy, or triangulation, which compares multiple data sources to strengthen conclusions. Including disconfirming evidence adds credibility by acknowledging findings that challenge dominant themes. External reviews, where experienced researchers evaluate the analysis, provide another layer of validation.
Although reliability plays a smaller role, researchers may use intercoder agreement to ensure coding consistency. This involves multiple coders applying the same codes to data and comparing results, sometimes using statistical measures like Krippendorff's alpha to assess agreement.
Quantitative research relies on external standards to ensure validity and reliability. Construct validity confirms that measurement tools accurately capture the intended concept, while reliability assesses the consistency of scores over time. Researchers can use established instruments with proven validity and reliability, check internal consistency, and conduct test-retest assessments. They also address external validity by evaluating whether findings can be generalized across different populations, settings, or time periods.
Conclusion
Analyzing data in a mixed methods study is a comprehensive process that involves the systematic integration of quantitative and qualitative data to provide a more holistic understanding of research problems. This process is guided by the research questions or hypotheses, with specific analytical strategies tailored to the nature of the data collected. As Creswell and Plano Clark (2016) emphasize, effective mixed methods data analysis requires meticulous attention to the procedures involved in preparing, exploring, analyzing, representing, interpreting, and validating data.
The preparation phase for qualitative and quantitative data is foundational, setting the stage for rigorous analysis. This includes transcription, coding, data cleaning, and organization using software tools like ATLAS.ti, NVivo, SPSS, and R. The exploration phase helps identify patterns and trends, guiding the selection of appropriate analytical techniques. In the analysis phase, qualitative data undergo coding and in-depth analysis, while quantitative data are subjected to descriptive and inferential statistical tests. The representation of data through visualizations, tables, and narratives aids in effectively communicating findings.
Interpreting the results involves synthesizing insights from data types, ensuring that the integration adds value beyond what each dataset could offer independently. This integration is crucial in mixed methods research, as it fosters a comprehensive understanding of the research problem. Validating the data and results through strategies like triangulation, member-checking, and statistical tests enhances the reliability and credibility of the research findings.
Ultimately, data analysis in a mixed methods study is not just about combining quantitative and qualitative data but about creating meaningful connections between them to generate robust, insightful conclusions. This integrated approach allows researchers to address complex questions more effectively, providing a richer, more nuanced perspective on the phenomena under study.
References
- Creswell, J. W., & Plano Clark, V. L. (2016). Designing and conducting mixed methods research (3rd ed.). Thousand Oaks, CA: SAGE Publications.