- Handling qualitative data
- Transcripts
- Field notes
- Memos
- Survey data and responses
- Visual and audio data
- Data organization
- Data coding
- Coding frame
- Auto and smart coding
- Organizing codes
- Qualitative data analysis
- Content analysis
- Thematic analysis
- Narrative research
- Phenomenological research
- Discourse analysis
- Grounded theory
- Deductive reasoning
- Inductive reasoning
- Inductive vs. deductive reasoning
- Qualitative data interpretation
- Qualitative data analysis software
- How to cite "The Ultimate Guide to Qualitative Research - Part 2"
- Thematic analysis vs. content analysis
What is data interpretation? Tricks & techniques
Raw data by itself isn't helpful to research without data interpretation. The need to organize and analyze data so that research can produce actionable insights and develop new knowledge affirms the importance of the data interpretation process.

Let's look at why data interpretation is important to the research process, how you can interpret data, and how the tools in ATLAS.ti can help you look at your data in meaningful ways.
The role of data interpretation
The data collection process is just one part of research, and one that can often provide a lot of data without any easy answers that instantly stick out to researchers or their audiences. An example of data that requires an interpretation process is a corpus, or a large body of text, meant to represent some language use (e.g., literature, conversation). A corpus of text can collect millions of words from written texts and spoken interactions.
Challenge of data interpretation
While this is an impressive body of data, sifting through this corpus can be difficult. If you are trying to make assertions about language based on the corpus data, what data is useful to you? How do you separate irrelevant data from valuable insights? How can you persuade your audience to understand your research?
Data interpretation is a process that involves assigning meaning to the data. A researcher's responsibility is to explain and persuade their research audience on how they see the data and what insights can be drawn from their interpretation.
Interpreting raw data to produce insights
Unstructured data is any sort of data that is not organized by some predetermined structure or that is in its raw, naturally-occurring form. Without data analysis, the data is difficult to interpret to generate useful insights.
This unstructured data is not always mindless noise, however. The importance of data interpretation can be seen in examples like a blog with a series of articles on a particular subject or a cookbook with a collection of recipes. These pieces of writing are useful and perhaps interesting to readers of various backgrounds or knowledge bases.
Data interpretation starting with research inquiry
People can read a set of information, such as a blog article or a recipe, in different ways (some may read the ingredients first while others skip to the directions). Data interpretation grounds the understanding and reporting of the research in clearly defined terms such that, even if different scholars disagree on the findings of the research, they at least share a foundational understanding of how the research is interpreted.
Moreover, suppose someone is reading a set of recipes to understand the food culture of a particular place or group of people. A straightforward recipe may not explicitly or neatly convey this information. Still, a thorough reader can analyze bits and pieces of each recipe in that cookbook to understand the ingredients, tools, and methods used in that particular food culture.
As a result, your research inquiry may require you to reorganize the data in a way that allows for easier data interpretation. Analyzing data as a part of the interpretation process, especially in qualitative research, means looking for the relevant data, summarizing data for the insights they hold, and discarding any irrelevant data that is not useful to the given research inquiry.

Let's look at a fairly straightforward process that can be used to turn data into valuable insights through data interpretation.
Sorting the data
Think about our previous example with a collection of recipes. You can break down a recipe into various "data points," which you might consider categories or points of measurement. A recipe can be broken down into ingredients, directions, or even preparation time, things that are often written into a recipe. Or you might look at recipes from a different angle using less observed categories, such as the cost to make the recipe or skills required to make the recipe. Whatever categories you choose, however, will determine how you interpret the data.
As a result, think about what you are trying to examine and identify what categories or measures should be used to analyze and understand the data. These data points will form your "buckets" to sort your collected data into more meaningful information for data interpretation.
Identifying trends and patterns
Once you've sorted enough of the data into your categorical buckets, you might begin to notice some telling patterns. Suppose you are analyzing a cookbook of barbecue recipes for nutritional value. In that case, you might find an abundance of recipes with high fat and sugar, while a collection of salad recipes might yield patterns of dishes with low carbohydrates. These patterns will form the basis for answering your research inquiry.
Drawing connections
The meaning of these trends and patterns is not always self-evident. When people wear the same trendy clothes or listen to the same popular music, they may do so because the clothing or music is genuinely good or because they are following the crowd. They may even be trying to impress someone they know.
As you look at the patterns in your data, you can start to look at whether the patterns coincide (or co-occur) to determine a starting point for discussion about whether they are related to each other. Whether these co-occurrences share a meaningful relationship or are only loosely correlated with each other, all data interpretation of patterns starts by looking within and across patterns and co-occurrences among them.
Quantitative data interpretation
Quantitative analysis through statistical methods benefits researchers who are looking to measure a particular phenomenon. Numerical data can measure the different degrees of a concept, such as temperature, speed, wealth, or even academic achievement.
Quantitative data analysis is a matter of rearranging the data to make it easier to measure. Imagine sorting a child's piggy bank full of coins into different types of coins (e.g., pennies, nickels, dimes, and quarters). Without sorting these coins for measurement, it becomes difficult to efficiently measure the value of the coins in that piggy bank.
Quantitative data interpretation method
A good data interpretation question regarding that child's piggy bank might be, "Has the child saved up enough money?" Then it's a matter of deciding what "enough money" might be, whether it's $20, $50, or even $100. Once that determination has been made, you can then answer your question after your quantitative analysis (i.e., counting the coins).
Although counting the money in a child’s piggy bank is a simple example, it illustrates the fact that a lot of quantitative data interpretation depends on having a particular value or set of values in mind against which your analysis will be compared. The number of calories or the amount of sodium you might consider healthy will allow you to determine whether a particular food is healthy. At the same time, your monthly income will inform whether you see a certain product as cheap or expensive. In any case, interpreting quantitative data often starts with having a set theory or prediction that you apply to the data.

Qualitative data interpretation
Data interpretation refers to the process of examining and reviewing data for the purpose of describing the aspects of a phenomenon or concept. Qualitative research seldom has numerical data arising from data collection; instead, qualities of a phenomenon are often generated from this research. With this in mind, the role of data interpretation is to persuade research audiences as to what qualities in a particular concept or phenomenon are significant.
While there are many different ways to analyze complex data that is qualitative in nature, here is a simple process for data interpretation that might be persuasive to your research audience:
- Describe data in explicit detail - what is happening in the data?
- Describe the meaning of the data - why is it important?
- Describe the significance - what can this meaning be used for?
Qualitative data interpretation method
Coding remains one of the most important data interpretation methods in qualitative research. Coding provides a structure to the data that facilitates empirical analysis. Without this coding, a researcher can give their impression of what the data means but may not be able to persuade their audience with the sufficient evidence that structured data can provide.
Ultimately, coding reduces the breadth of the collected data to make it more manageable. Instead of thousands of lines of raw data, effective coding can produce a couple of dozen codes that can be analyzed for frequency or used to organize categorical data along the lines of themes or patterns.
Analyzing qualitative data through coding involves closely looking at the data and summarizing data segments into short but descriptive phrases. These phrases or codes, when applied throughout entire data sets, can help to restructure the data in a manner that allows for easier analysis or greater clarity as to the meaning of the data relevant to the research inquiry.
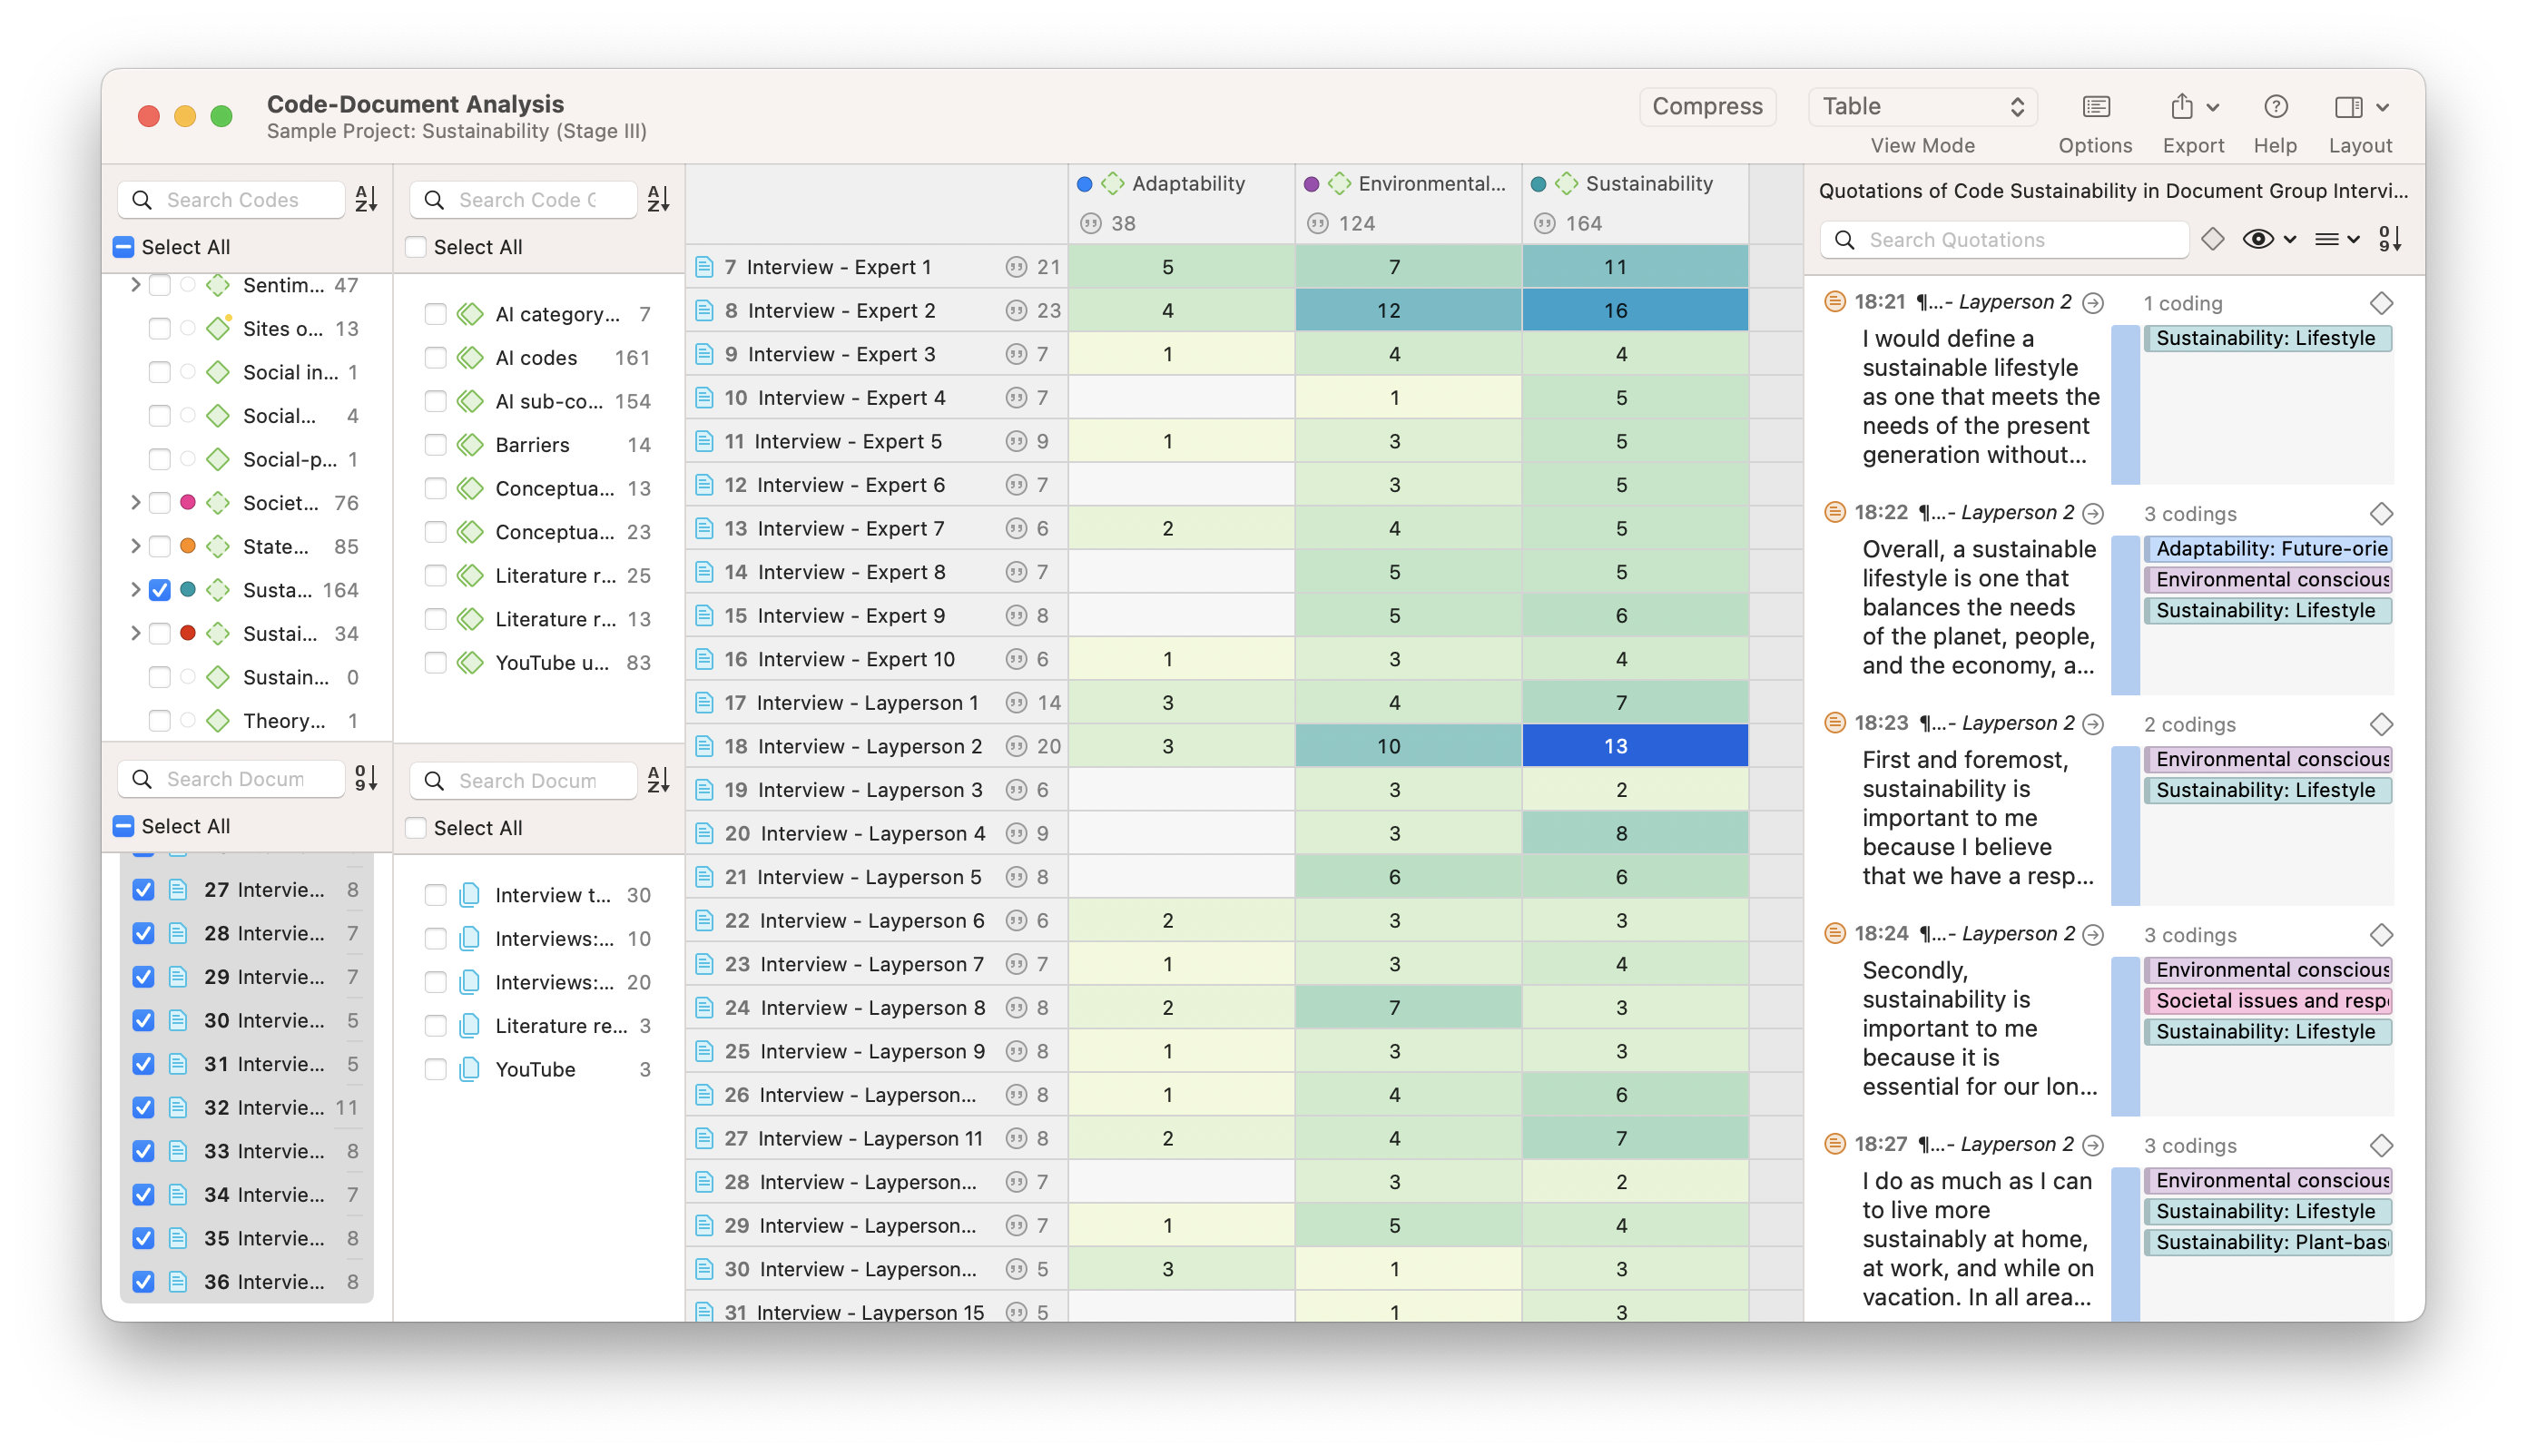
Code-Document Analysis
A comparison of data sets can be useful to interpret patterns in the data. Code-Document Analysis in ATLAS.ti looks for code frequencies in particular documents or document groups. This is useful for many tasks, such as interpreting perspectives across multiple interviews or survey records. Where each document represents the opinions of a distinct person, how do perspectives differ from person to person? Understanding these differences, in this case, starts with determining where the interpretive codes in your project are applied.
Using ATLAS.ti for interpreting data
Software is great at accomplishing mechanical tasks that would otherwise take time and effort better spent on analysis. Such tasks include searching for words or phrases across documents, completing complicated queries to organize the relevant information in one place, and employing statistical methods to allow the researcher to reach relevant conclusions about their data. What technology cannot do is interpret data for you; it can reorganize the data in a way that allows you to more easily reach a conclusion as to the insights you can draw from the research, but ultimately it is up to you to make the final determination as to the meaning of the patterns in the data.
This is true whether you are engaged in qualitative or quantitative research. Whether you are trying to define "happiness" or "hot" (because a "hot day" will mean different things to different people, regardless of the number representing the temperature), it is inevitably your decision to interpret the data you're given, regardless of the help a computer may provide to you.
Think of qualitative data analysis software like ATLAS.ti as an assistant to support you through the research process so you can identify key insights from your data, as opposed to identifying those insights for you. This is especially preferable in the social sciences, where human interaction and cultural practices are subjectively and socially constructed in a way that only humans can adequately understand. Human interpretation of qualitative data is not merely unavoidable; in the social sciences, it is an outright necessity.

With this in mind, ATLAS.ti has several tools that can help make interpreting data easier and more insightful. These tools can facilitate the reporting and visualization of the data analysis for your benefit and the benefit of your research audience.
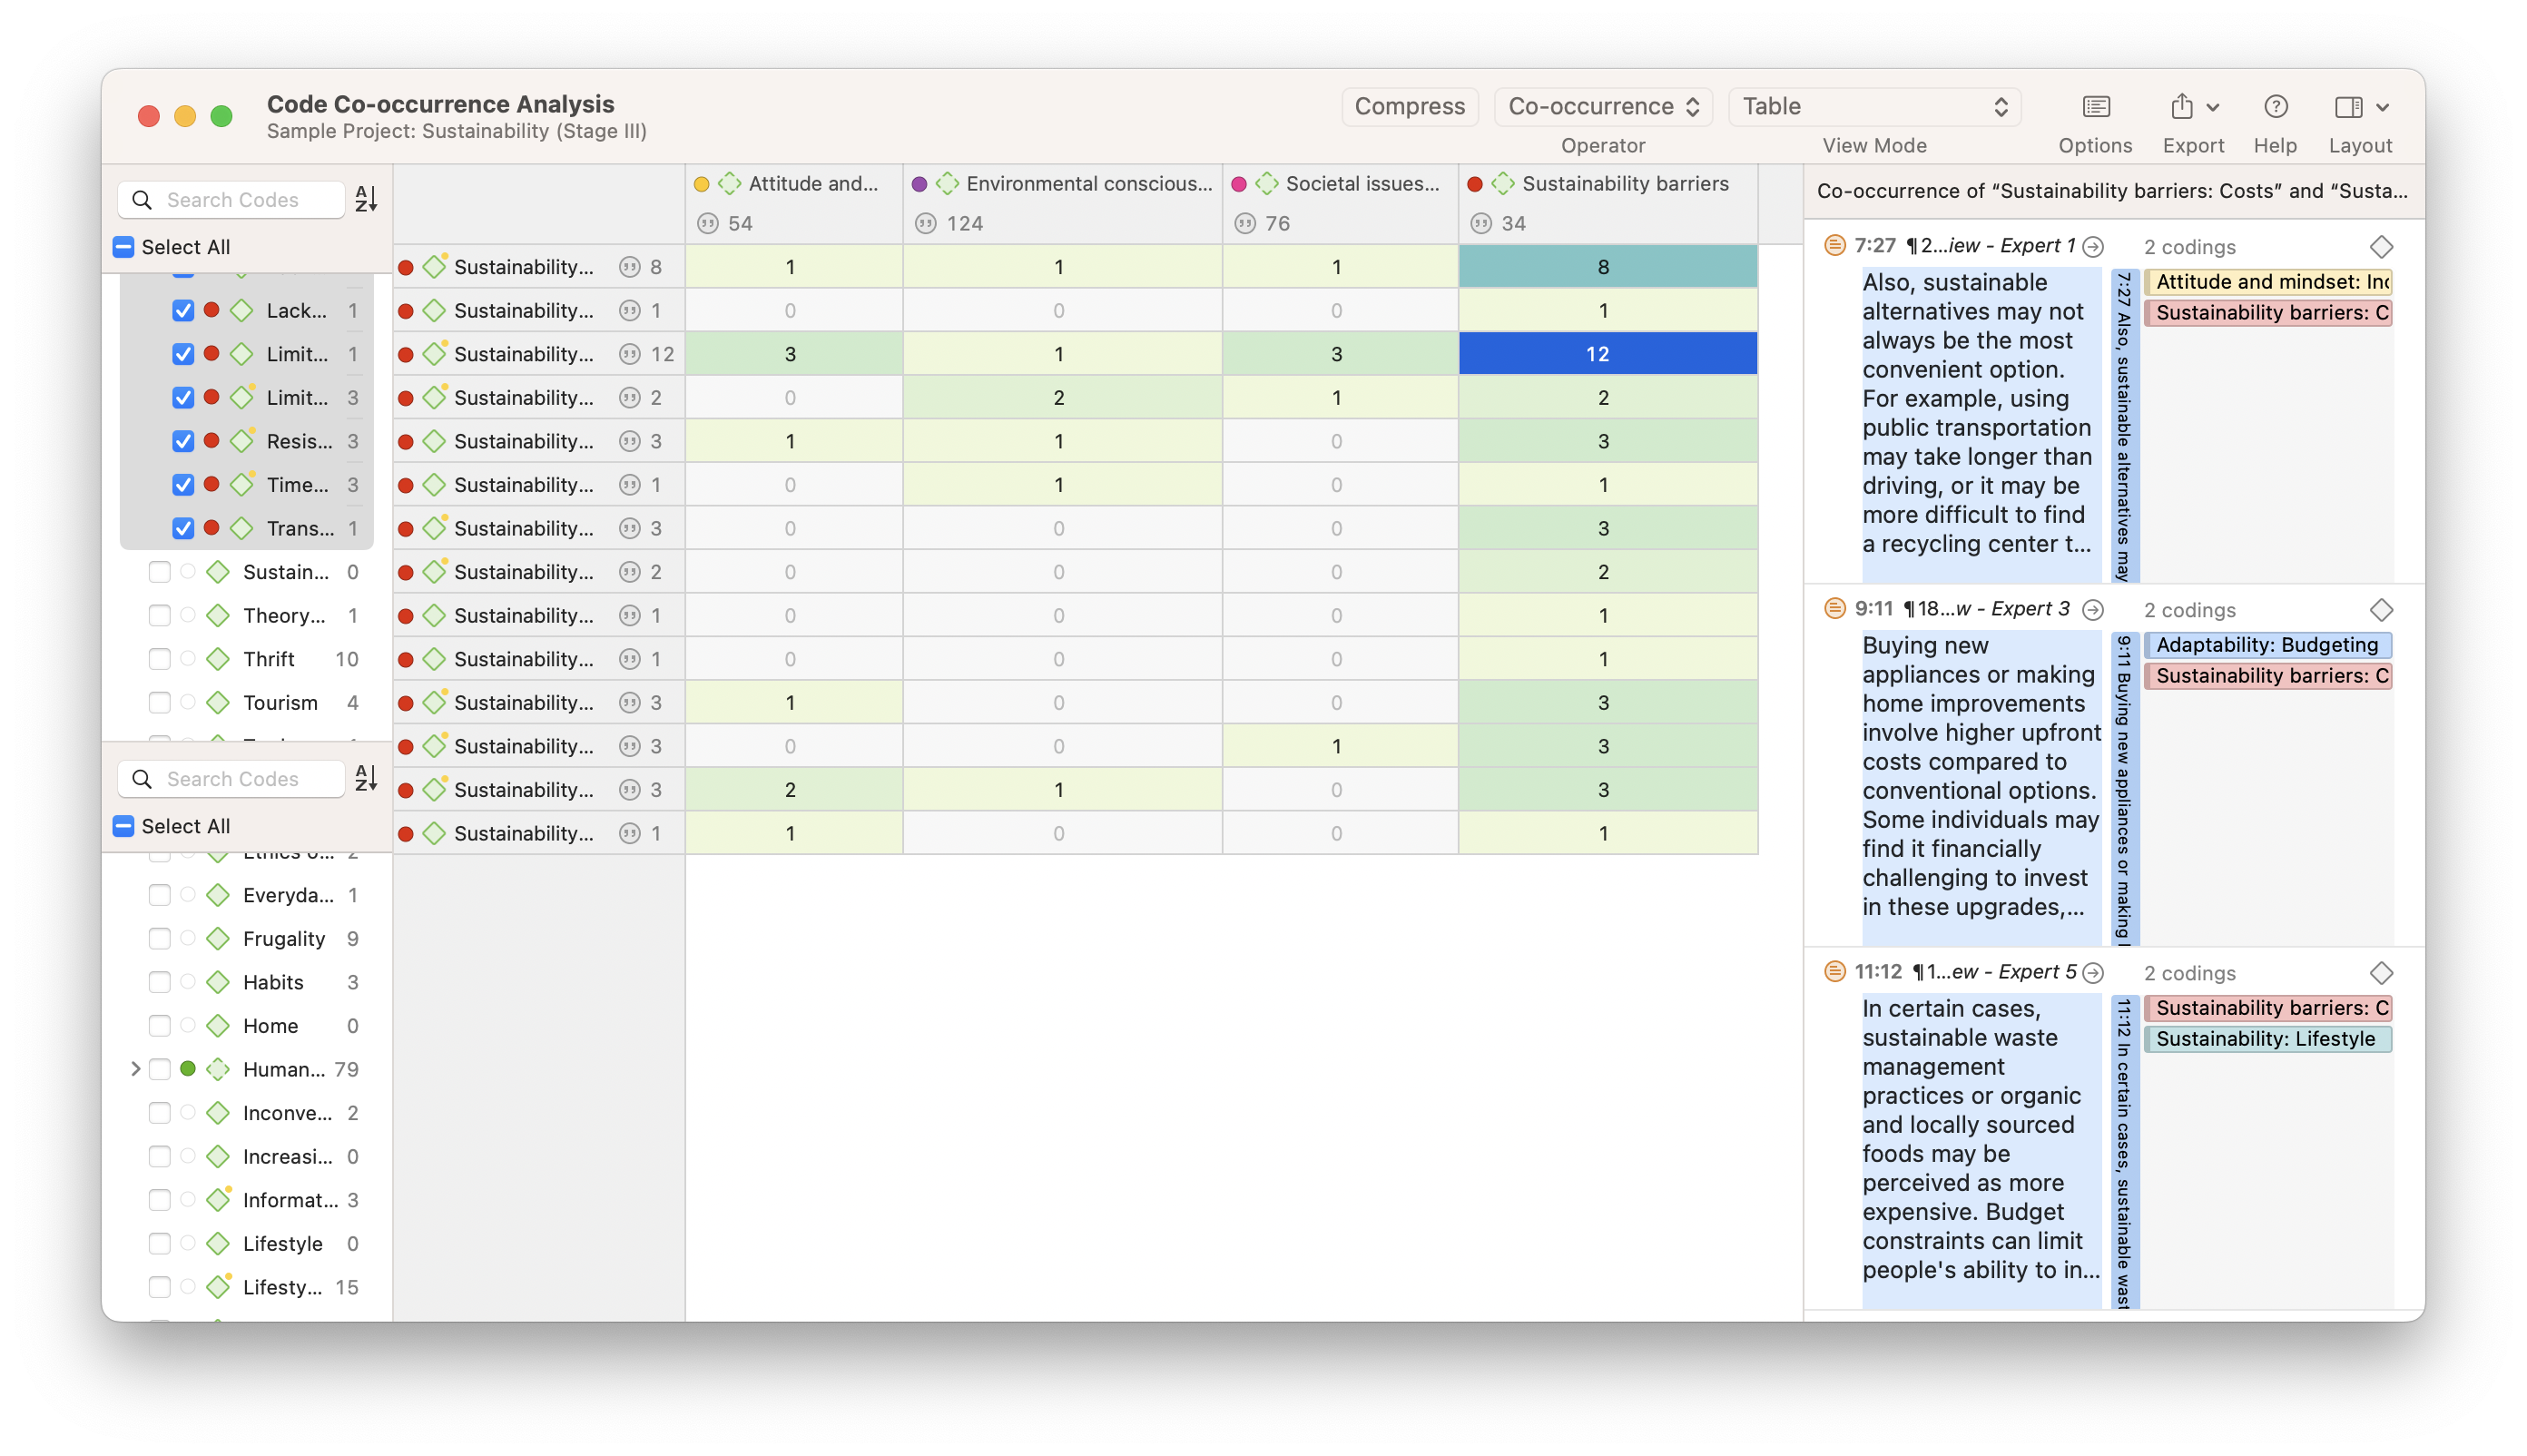
Code Co-Occurrence Analysis
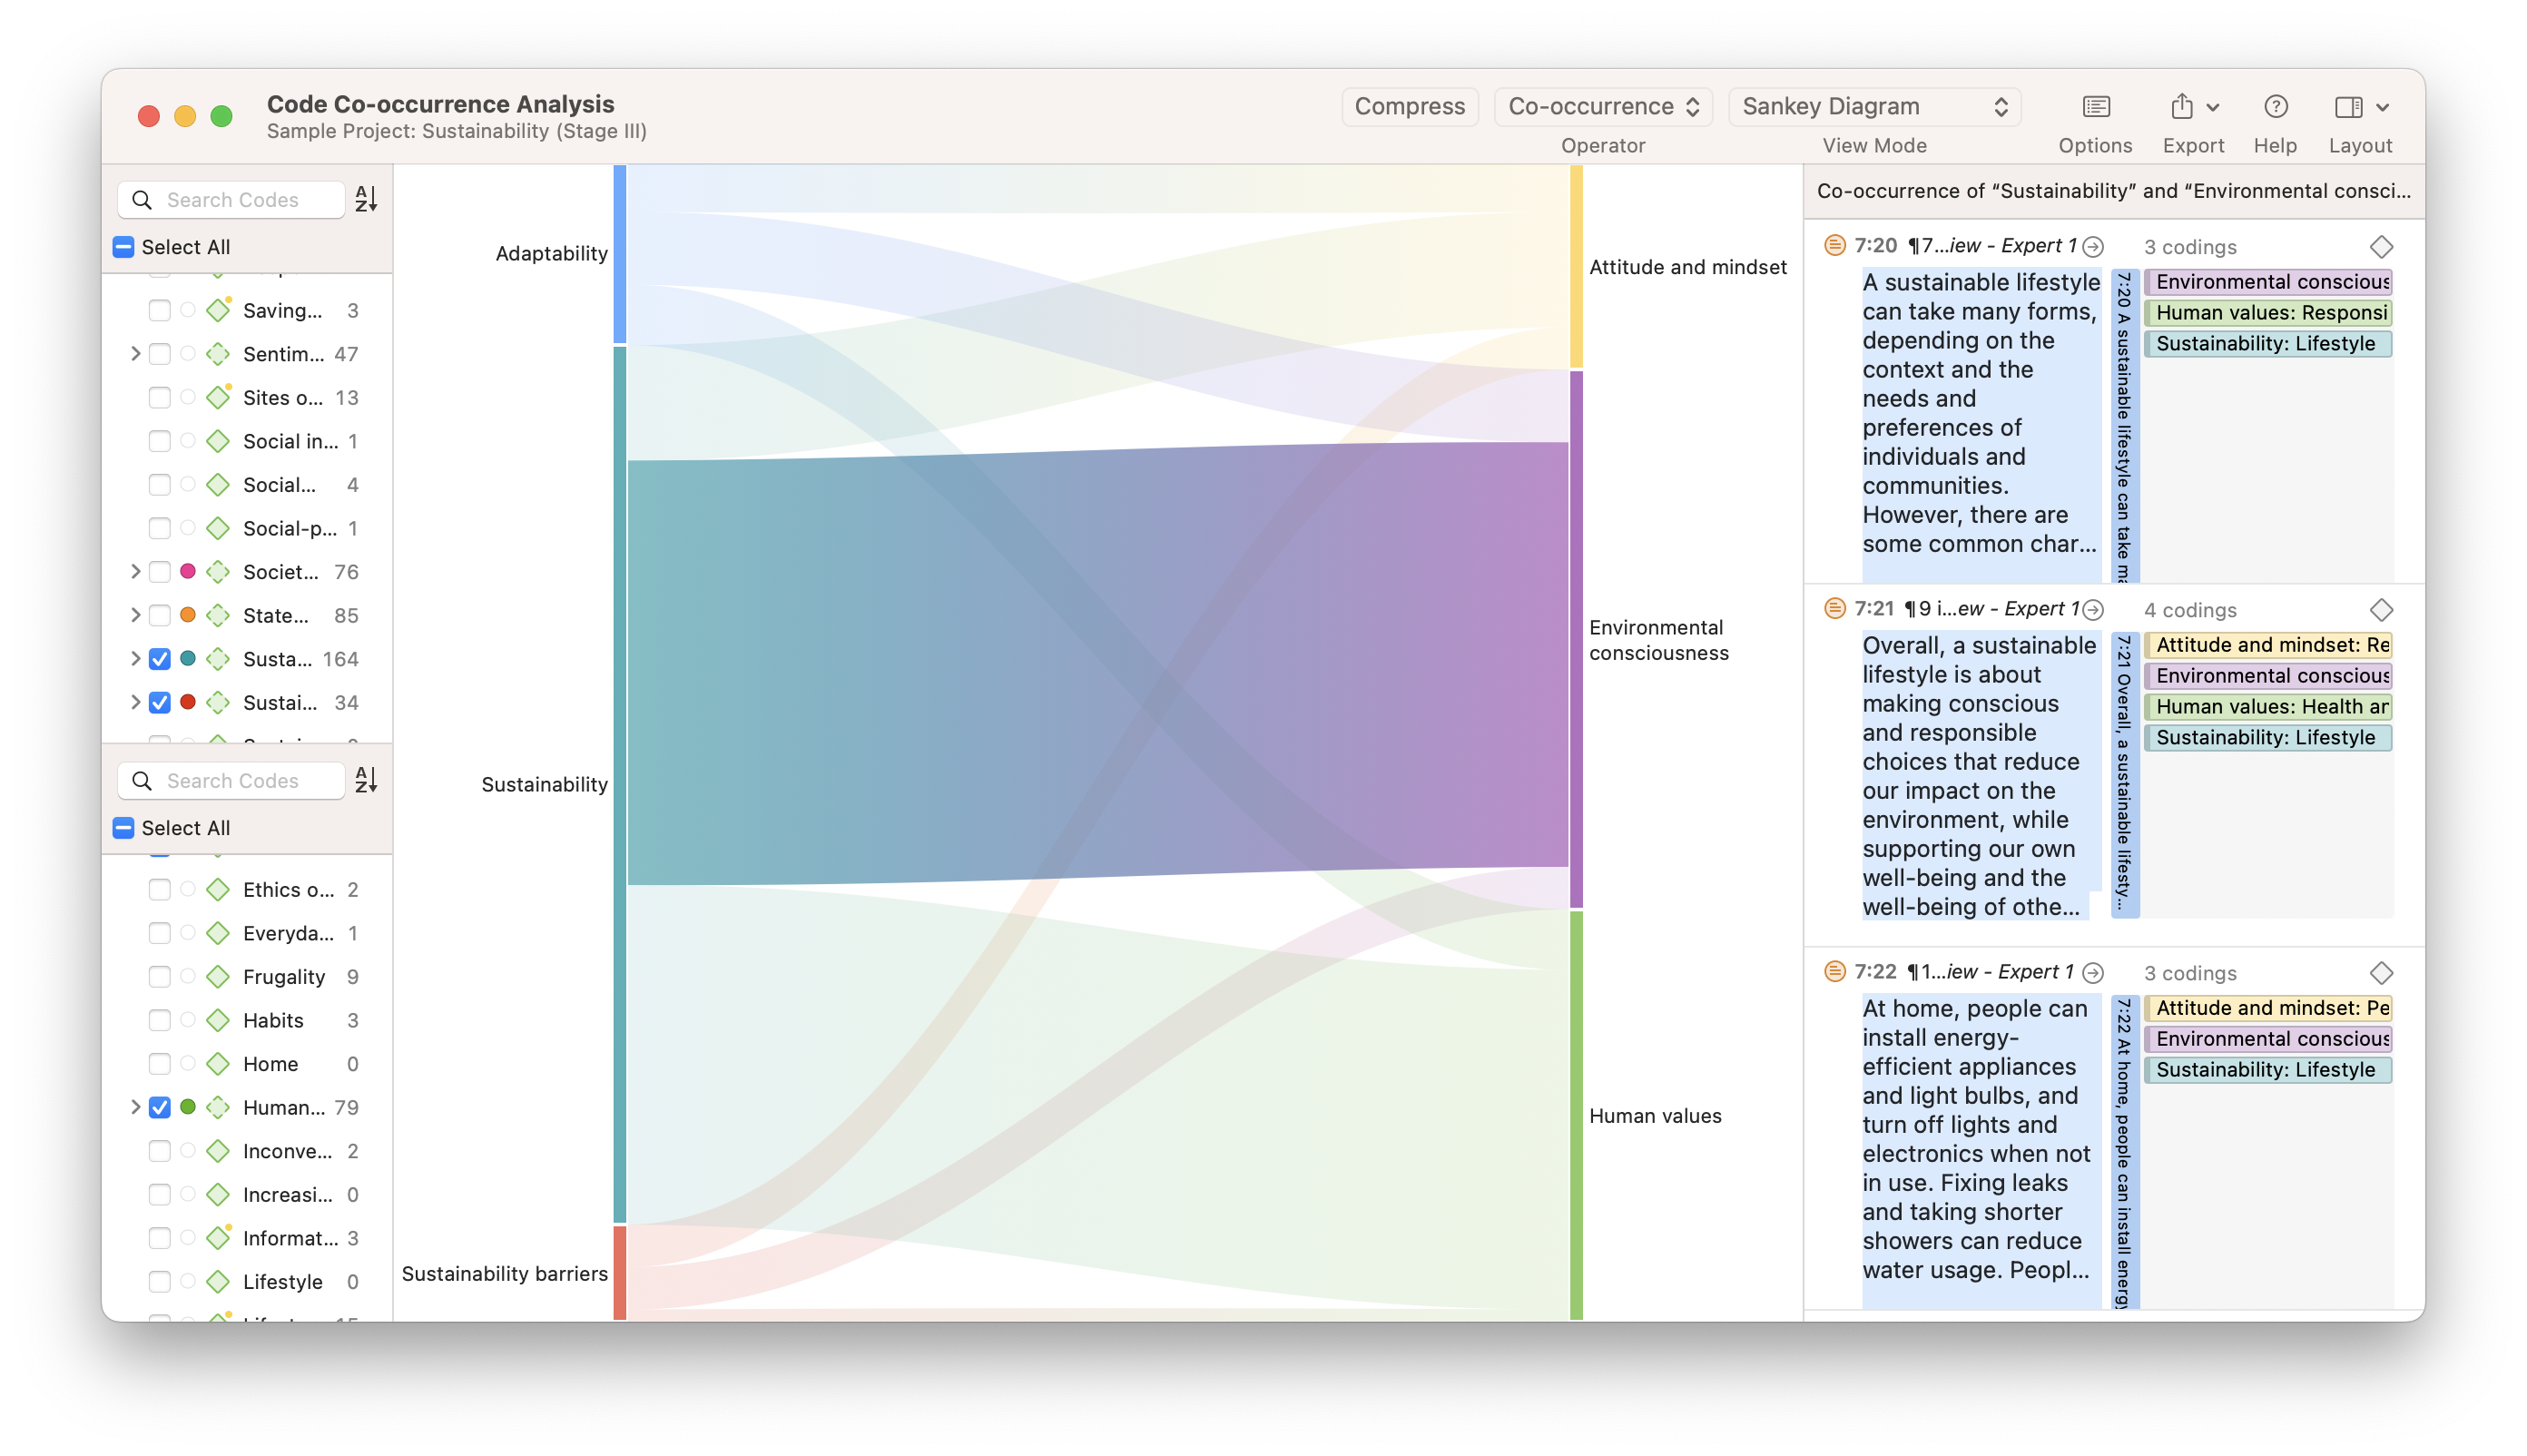
The overlapping of codes in qualitative data is a useful starting point to determine relationships between phenomena. ATLAS.ti's Code Co-Occurrence Analysis tool helps researchers identify relationships between codes so that data interpretation regarding any possible connections can contribute to a greater understanding of the data.
Memos
Memos are an important part of any research, which is why ATLAS.ti provides a space separate from your data and codes for research notes and reflection memos. Especially in the social sciences or any field that explores socially constructed concepts, a reflective memo can provide essential documentation of how researchers are involved in data gathering and data interpretation.
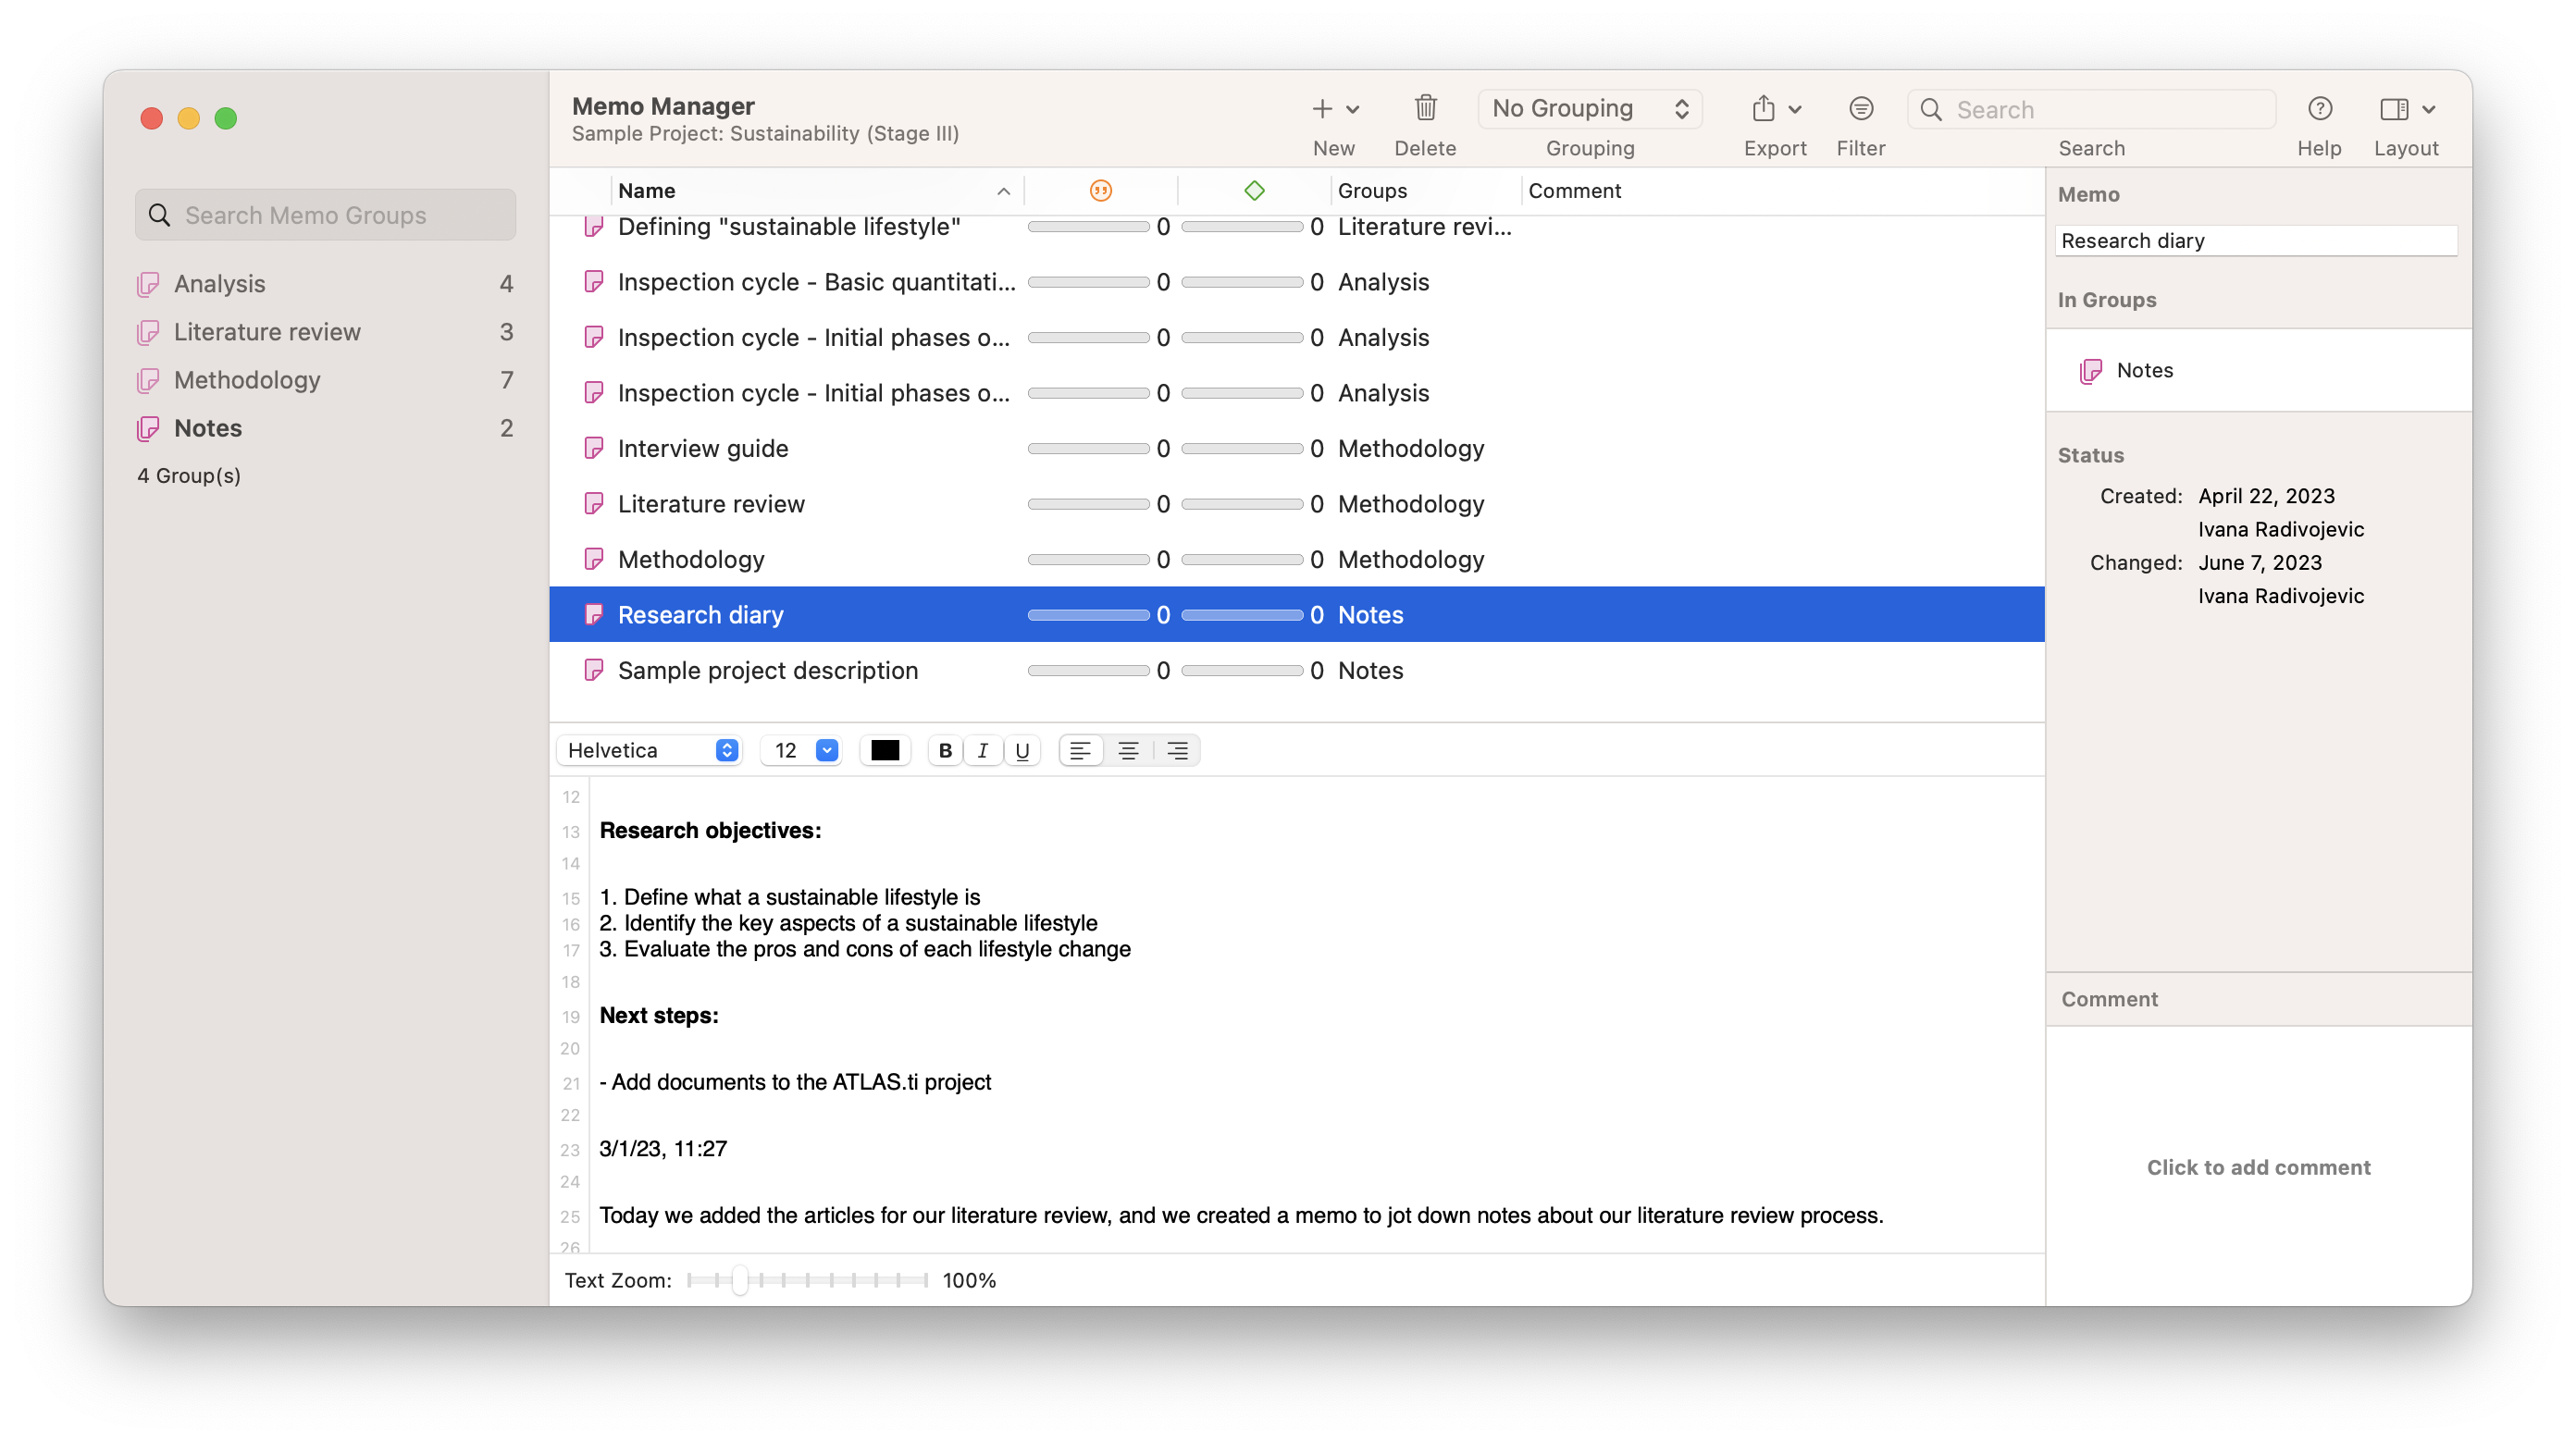
With memos, the steps of analysis can be traced, and the entire process is open to view. Detailed documentation of the data analysis and data interpretation process can also facilitate the reporting and visualization of research when it comes time to share the research with audiences.

Data visualization
In research, the main objective in explicitly conducting and detailing your data interpretation process is to report your research in a manner that is meaningful and persuasive to your audience. Where possible, researchers benefit from visualizing their data interpretation to provide research audiences with the necessary clarity to understand the findings of the research.
Ultimately, the various data analysis processes you employ should lead to some form of reporting where the research audience can easily understand the data interpretation. Otherwise, data interpretation holds no value if it is not understood, let alone accepted, by the research audience.
Data visualization tools in ATLAS.ti
ATLAS.ti has a number of tools that can assist with creating illustrations that contribute to explaining your data interpretation to your research audience.

TreeMaps
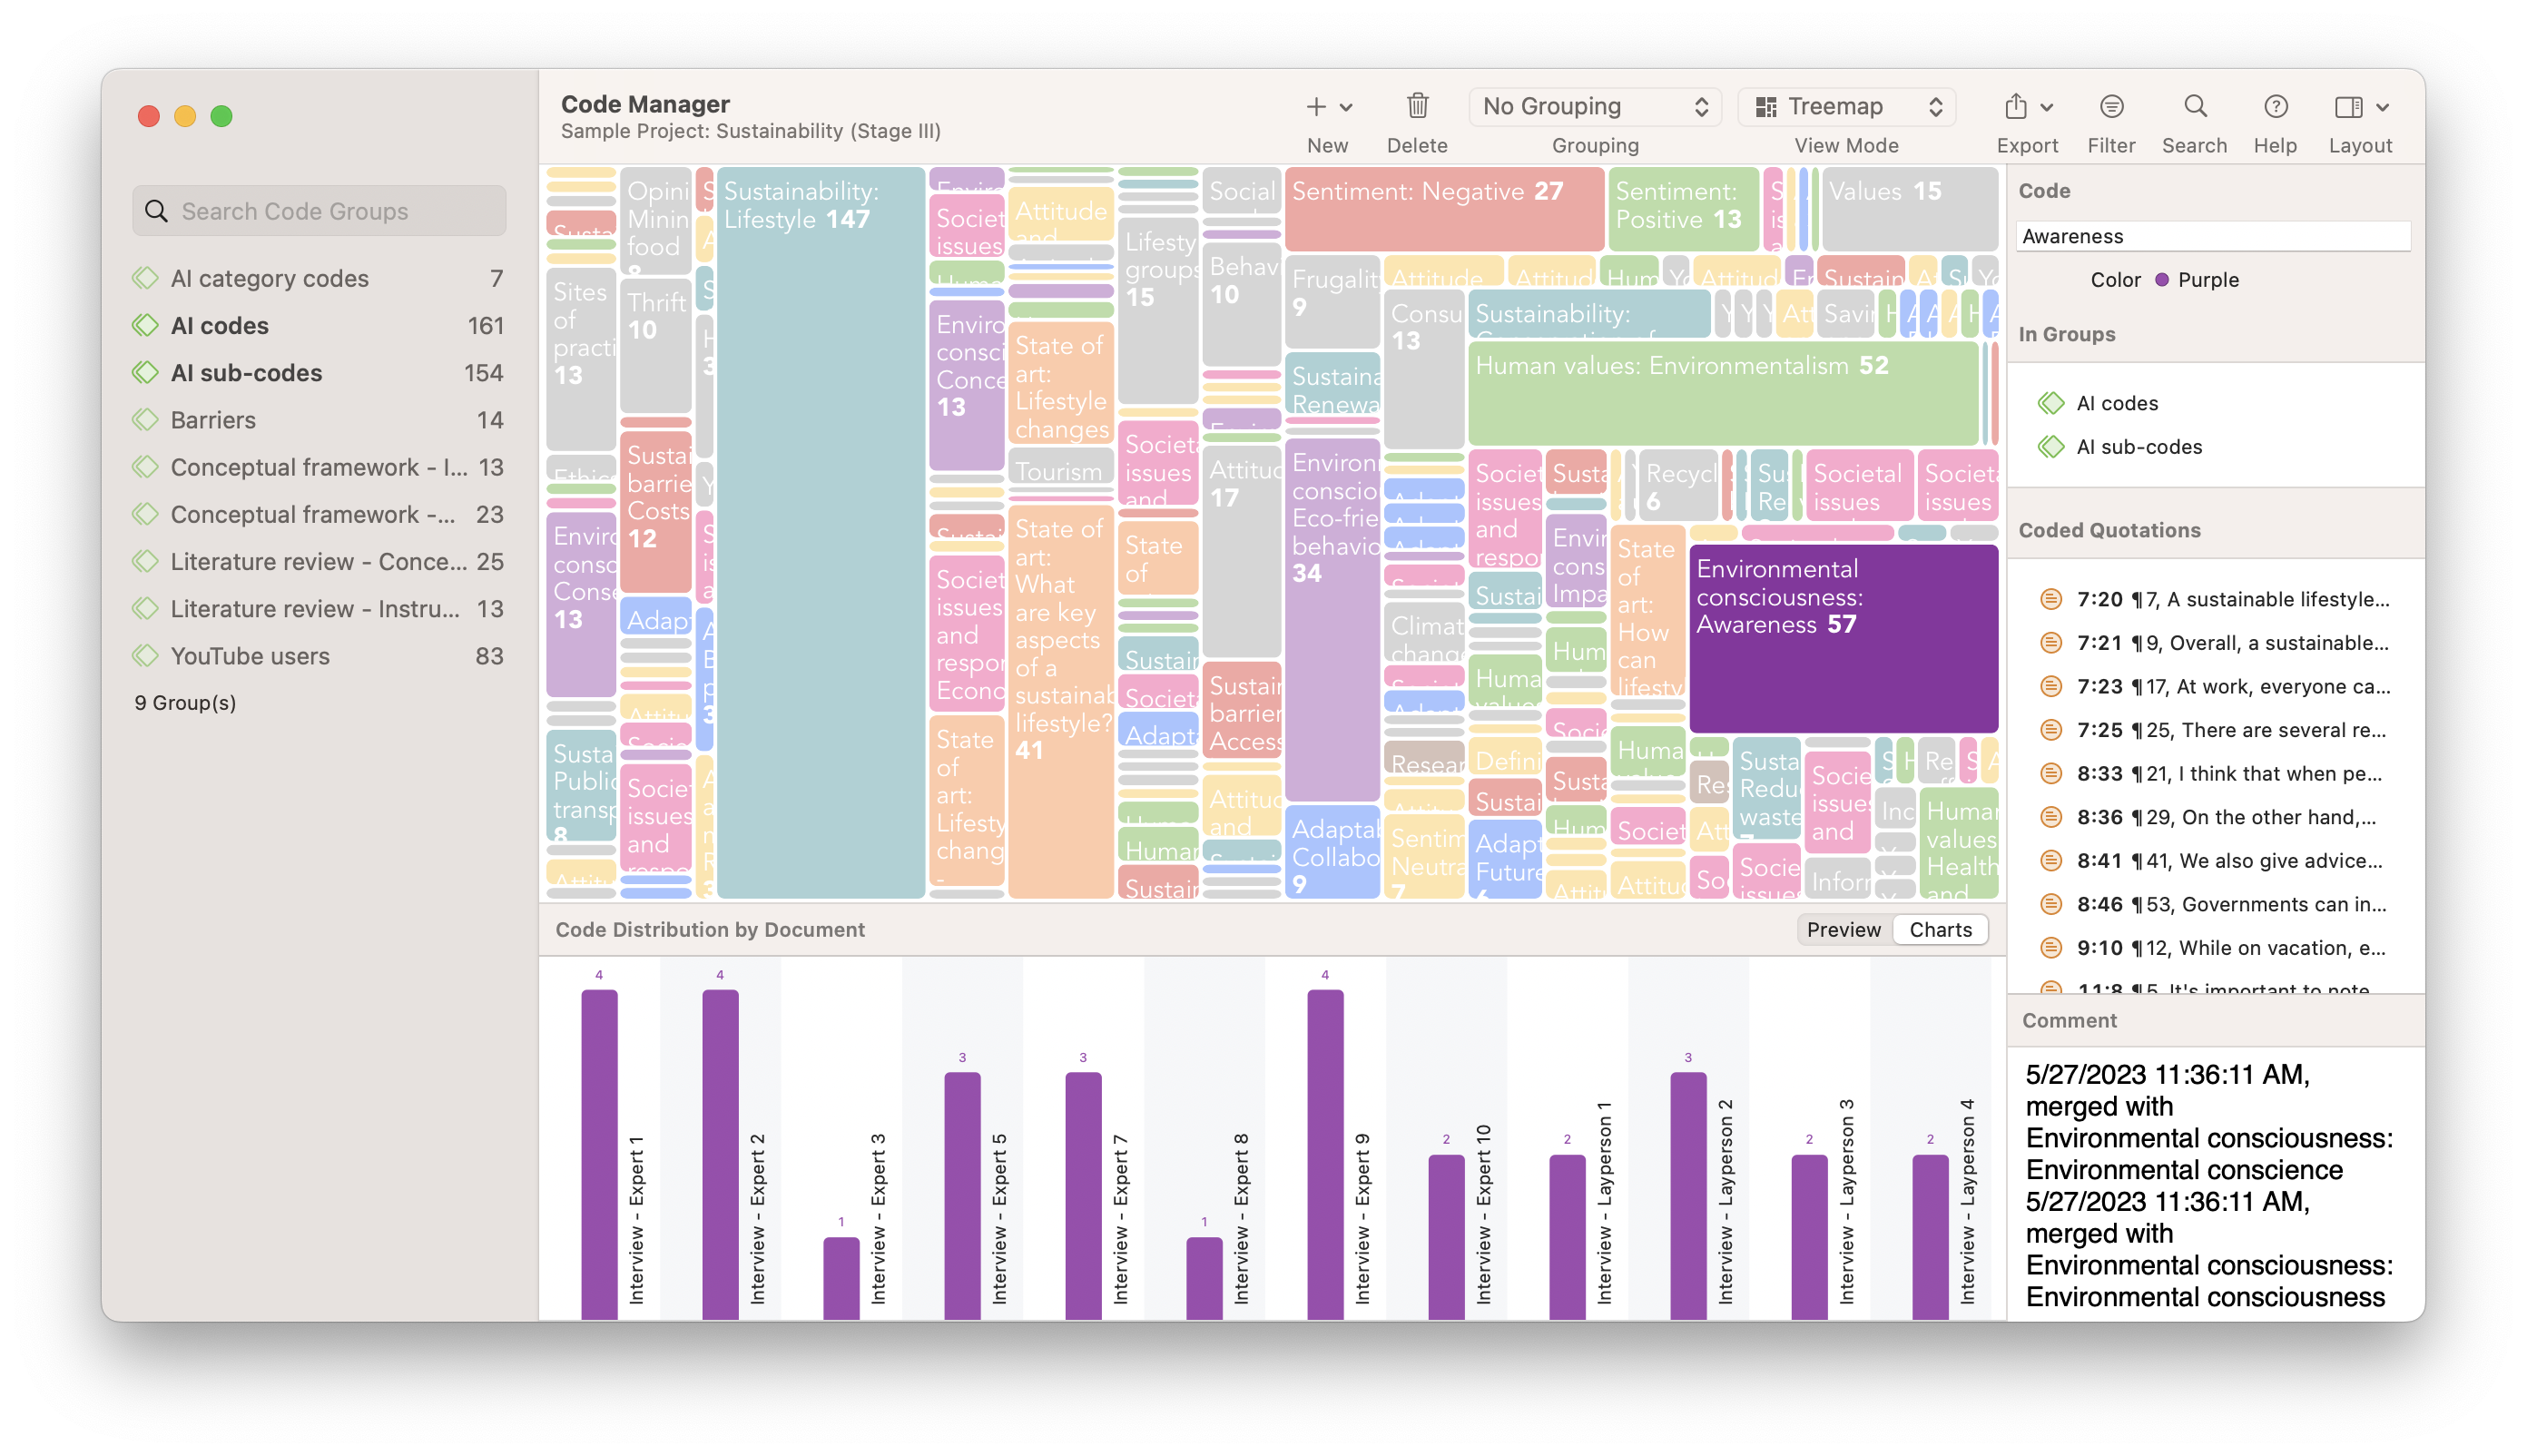
A TreeMap of your codes can be a useful visualization if you are conducting a thematic analysis of your data. Codes in ATLAS.ti can be marked by different colors, which is illustrative if you use colors to distinguish between different themes in your research. As codes are applied to your data, the more frequently occurring codes take up more space in the TreeMap, allowing you to examine which codes and, by use of colors, which themes are more and less apparent and help you generate theory.
Sankey diagrams
The Code Co-Occurrence and Code-Document Analyses in ATLAS.ti can produce tables, graphs, and also Sankey diagrams, which are useful for visualizing the relative relationships between different codes or between codes and documents. While numerical data generated for tables can tell one story of your data interpretation, the visual information in a Sankey diagram, where higher frequencies are represented by thicker lines, can be particularly persuasive to your research audience.
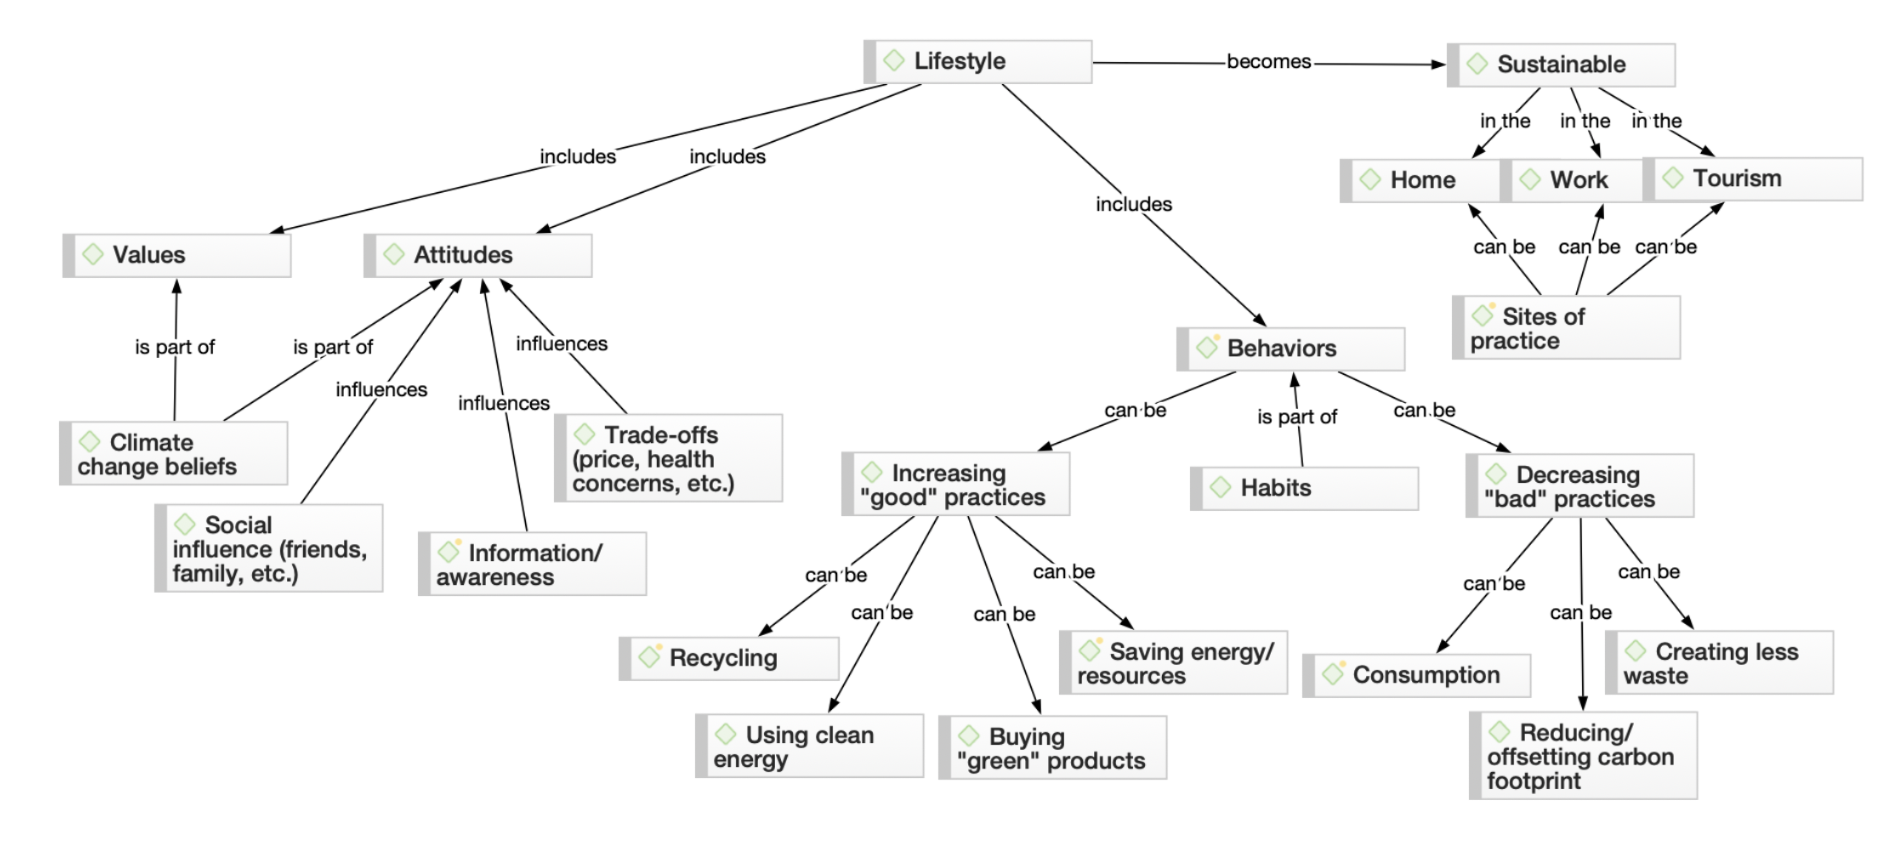
Networks
When it comes time to report actionable insights contributing to a theory or conceptualization, you can benefit from a visualization of the theory you have generated from your data interpretation. Networks are made up of elements of your project, usually codes, but also other elements such as documents, code groups, document groups, quotations, and memos. Researchers can then define links between these elements to illustrate connections that arise from your data interpretation.
