Using CAQDAS for qualitative research

- Overview
- Challenges of qualitative analysis
- What is CAQDAS used for?
- What should I consider when choosing a CAQDAS package?
- Qualitative analysis tools in ATLAS.ti
Overview
Nowadays, computer-assisted qualitative data analysis software (CAQDAS) is a necessary component of qualitative research. As data sets grow larger and more complex, qualitative data analysis (QDA) software packages help researchers analyze data collected from qualitative methods. The question now for researchers is how to choose the best QDA software for their research. In this section, we'll look at how research has evolved to necessitate CAQDAS, the various applications unique to CAQDAS, and what factors researchers should consider when choosing a software package. Then, we'll examine some of the tools in ATLAS.ti that can be particularly useful to qualitative researchers.

Challenges of qualitative analysis
Needless to say, analyzing qualitative data takes time and effort. Qualitative data is unstructured and requires organization before any research is conducted. Without qualitative data analysis software, many of the rich analyses we expect in the disciplines that rely on qualitative methods become difficult, if not outright impossible. Let's look at it from two different angles: what qualitative data analysis used to look like before computers and why computers have become necessary for analysis.
Traditional qualitative data analysis
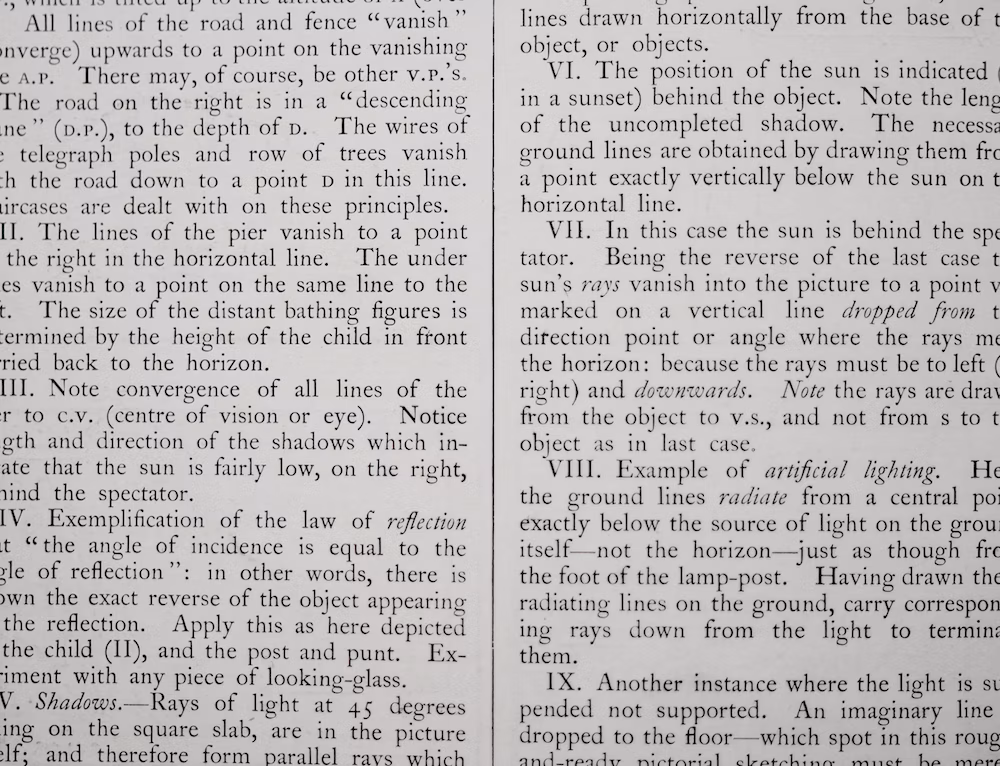
We take computers and technology for granted these days. If we're not at a computer, there's a smartphone in our hands. So it might be easy to overlook the contribution technology provides to the research process. To appreciate the challenges, it helps to imagine what qualitative research looked like before computers or digital technology were widely available as analytical resources. Anyone learning about qualitative data analysis today might hear anecdotes of qualitative researchers taping pages of printed data to their walls or spreading out piles of papers across living room floors to get a bird's eye view of their research while they took a highlighter and sticky notes to make sense of their data. Colors represented different themes while sticky notes provided space for researchers to annotate their data. Relevant data quotations could also be copied onto index cards to make it easier to parse out key segments and try different categorizations. If the data set was not too large, examining colors, annotations, and index cards was feasible enough for qualitative researchers to grasp the themes in their data and draw connections to tell the overarching story.
More data, more kinds of data
Naturally, this analog approach to data analysis has its limits. How many pieces of paper can fit on the floor of one room, anyways? As qualitative research expands, so do the data sets that researchers collect. Research transcripts can encompass dozens or hundreds of hours of interview and focus group recordings. Survey data can include thousands of records collected from large populations. Ethnographers collect and then analyze field notes, pictures, video recordings, and documents to determine connections between related data segments in very different parts of their research projects. Combine this with the need for more complex analysis as researchers continuously tackle novel research questions. After all, there are only so many highlighter colors the human eye can distinguish before the researcher becomes overwhelmed.

What is CAQDAS used for?
The ability to manage large sets of data is one matter. As qualitative research evolves, the complexity of methods for qualitative data analysis begins to transcend the reach of human intuition without the assistance of technology. Let's look at a few examples.
Content analysis
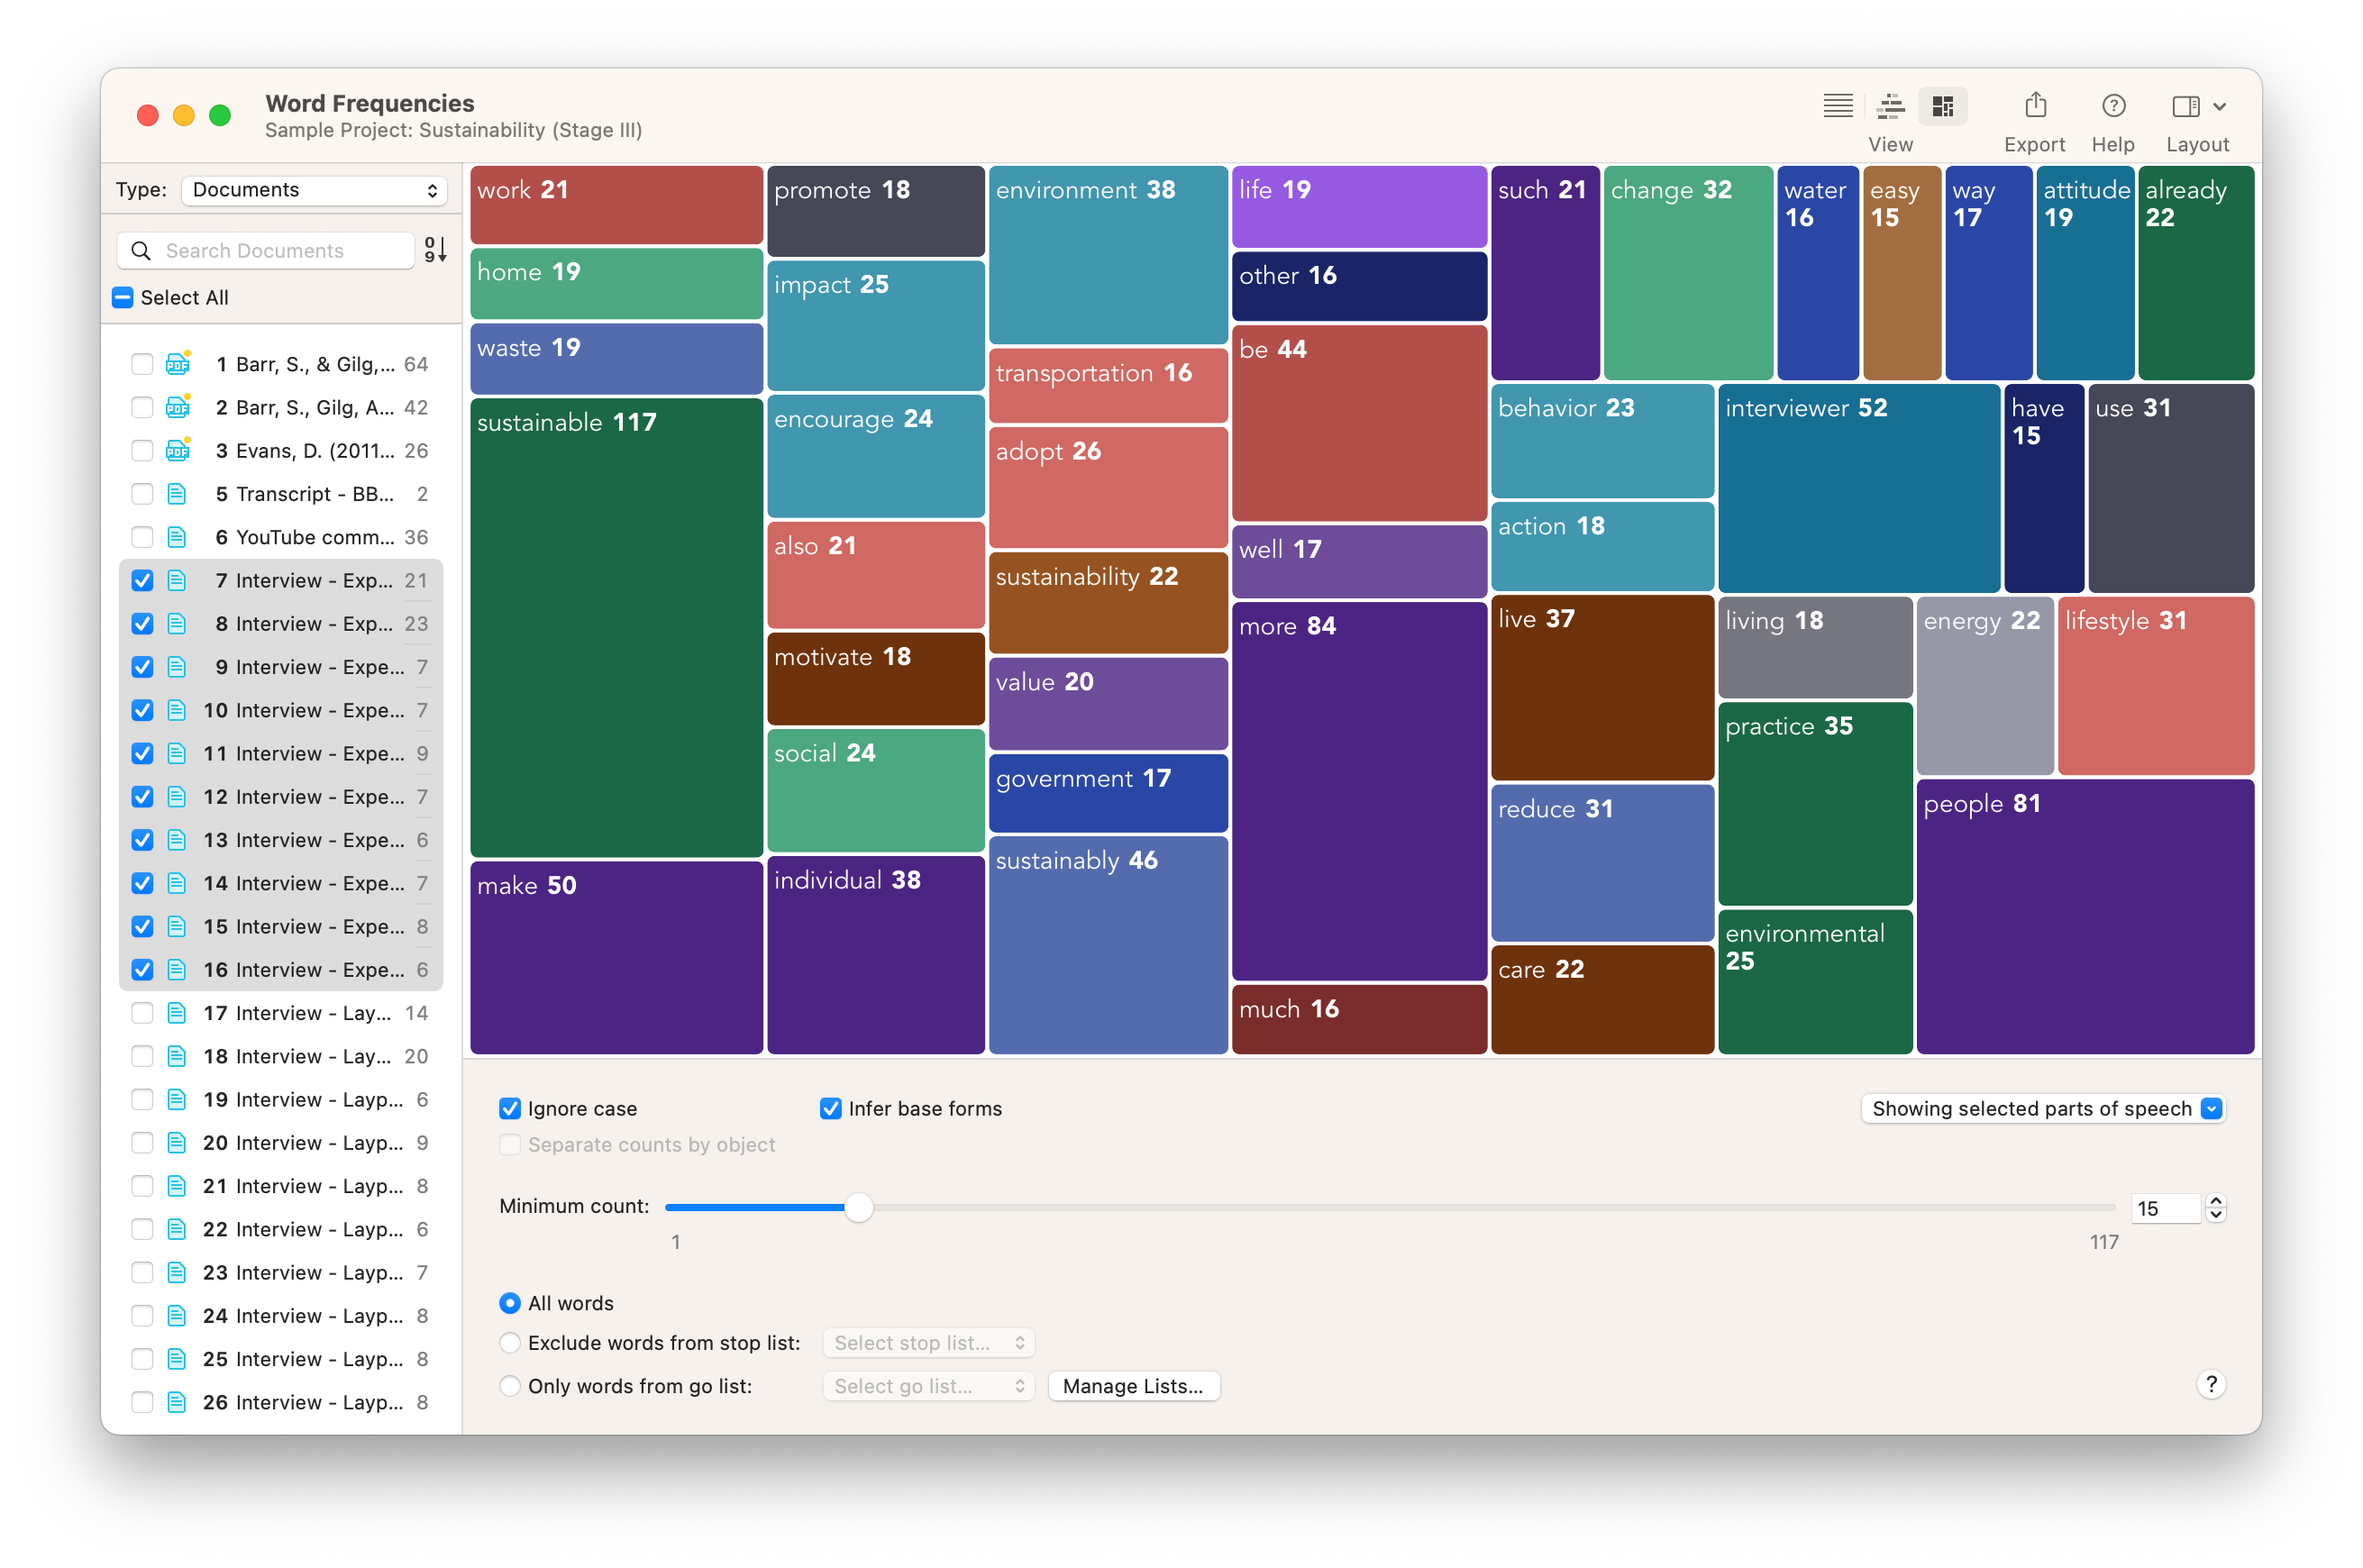
In research inquiries related to discourse, researchers are sometimes interested in what words and phrases are used in written or spoken text. Researchers often turn to content analysis to address this need. Many forms of content analysis involve counting how many times a particular word or phrase is used in a set of textual data. In large qualitative projects, completing this task by hand is simply unfeasible; computer programs can aggregate this data much faster and more consistently than the human eye can.
Codebooks
Keeping track of dozens, perhaps hundreds of codes, is a key function in CAQDAS software. Think about the challenges of aggregating all your coded data by hand. How quickly can you determine the frequencies for each and every code in your project? How do you process discrete codes and organize them into larger categories and themes? A good CAQDAS platform should make this transition from raw data to coded, structured data simple.
Analysis of image data and audio files
Qualitative data analysis software today handles more than text. Researchers analyze images, audio recordings, and video recordings to construct novel understanding and explore phenomena from different angles. After all, a timely facial expression or a non-verbal utterance that can't be captured through words can affect the meaning of any corresponding text. As a result, researchers rely on CAQDAS to organize various forms of textual and non-textual data for a more holistic research inquiry or to explore research questions that cannot be answered through textual data alone.
What should I consider when choosing a CAQDAS package?
CAQDAS packages are fairly standard nowadays thanks to the collective efforts of qualitative researchers, software developers, and proponents such as the CAQDAS Networking Project, which was formed to assist researchers in the use of software for qualitative data analysis. Most broadly, CAQDAS software packages should allow researchers to search through their data, create codes, establish links, and query their data for rich analysis. As a result, there is a core set of tools that exist across just about every major QDA software platform.
In a nutshell, all researchers have basic considerations regarding the price, ease of use, and the support that comes with the use of software packages. In addition, it's important to check that the capabilities of the CAQDAS matches the needs of the research project. When working in teams (e.g., within a university research lab or a non-profit organization), researchers may also think about a software's collaboration tools, the compatibility of the software across platforms (e.g., Windows or Mac), and project data storage features. Finally, researchers may also look at how other researchers have reviewed different software packages to determine if the research field is satisfied with the software.
Qualitative analysis tools in ATLAS.ti
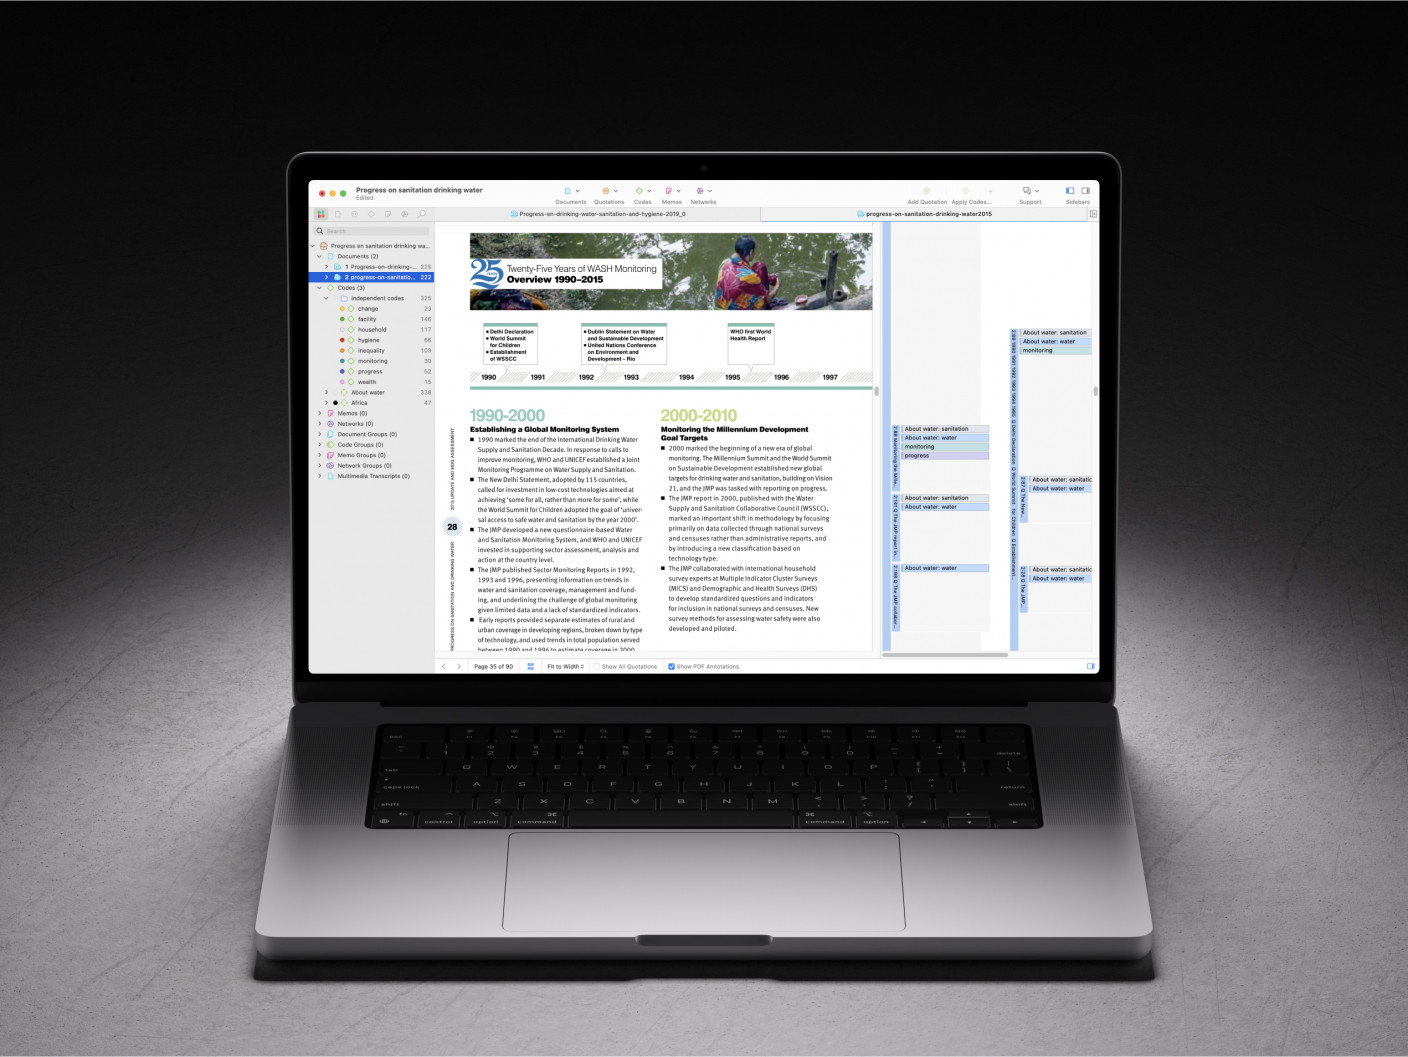
Among all these considerations, the capabilities of any particular QDA software package are likely to be front and center when you make a comparison. Whether you use our desktop software or our web-based platform, our software helps you save time in organizing and analyzing your data. All CAQDAS software packages have tools that can accomplish tasks that an analog approach cannot, but ATLAS.ti has a number of tools that provide users with several advantages for conducting research.
Focus group coding
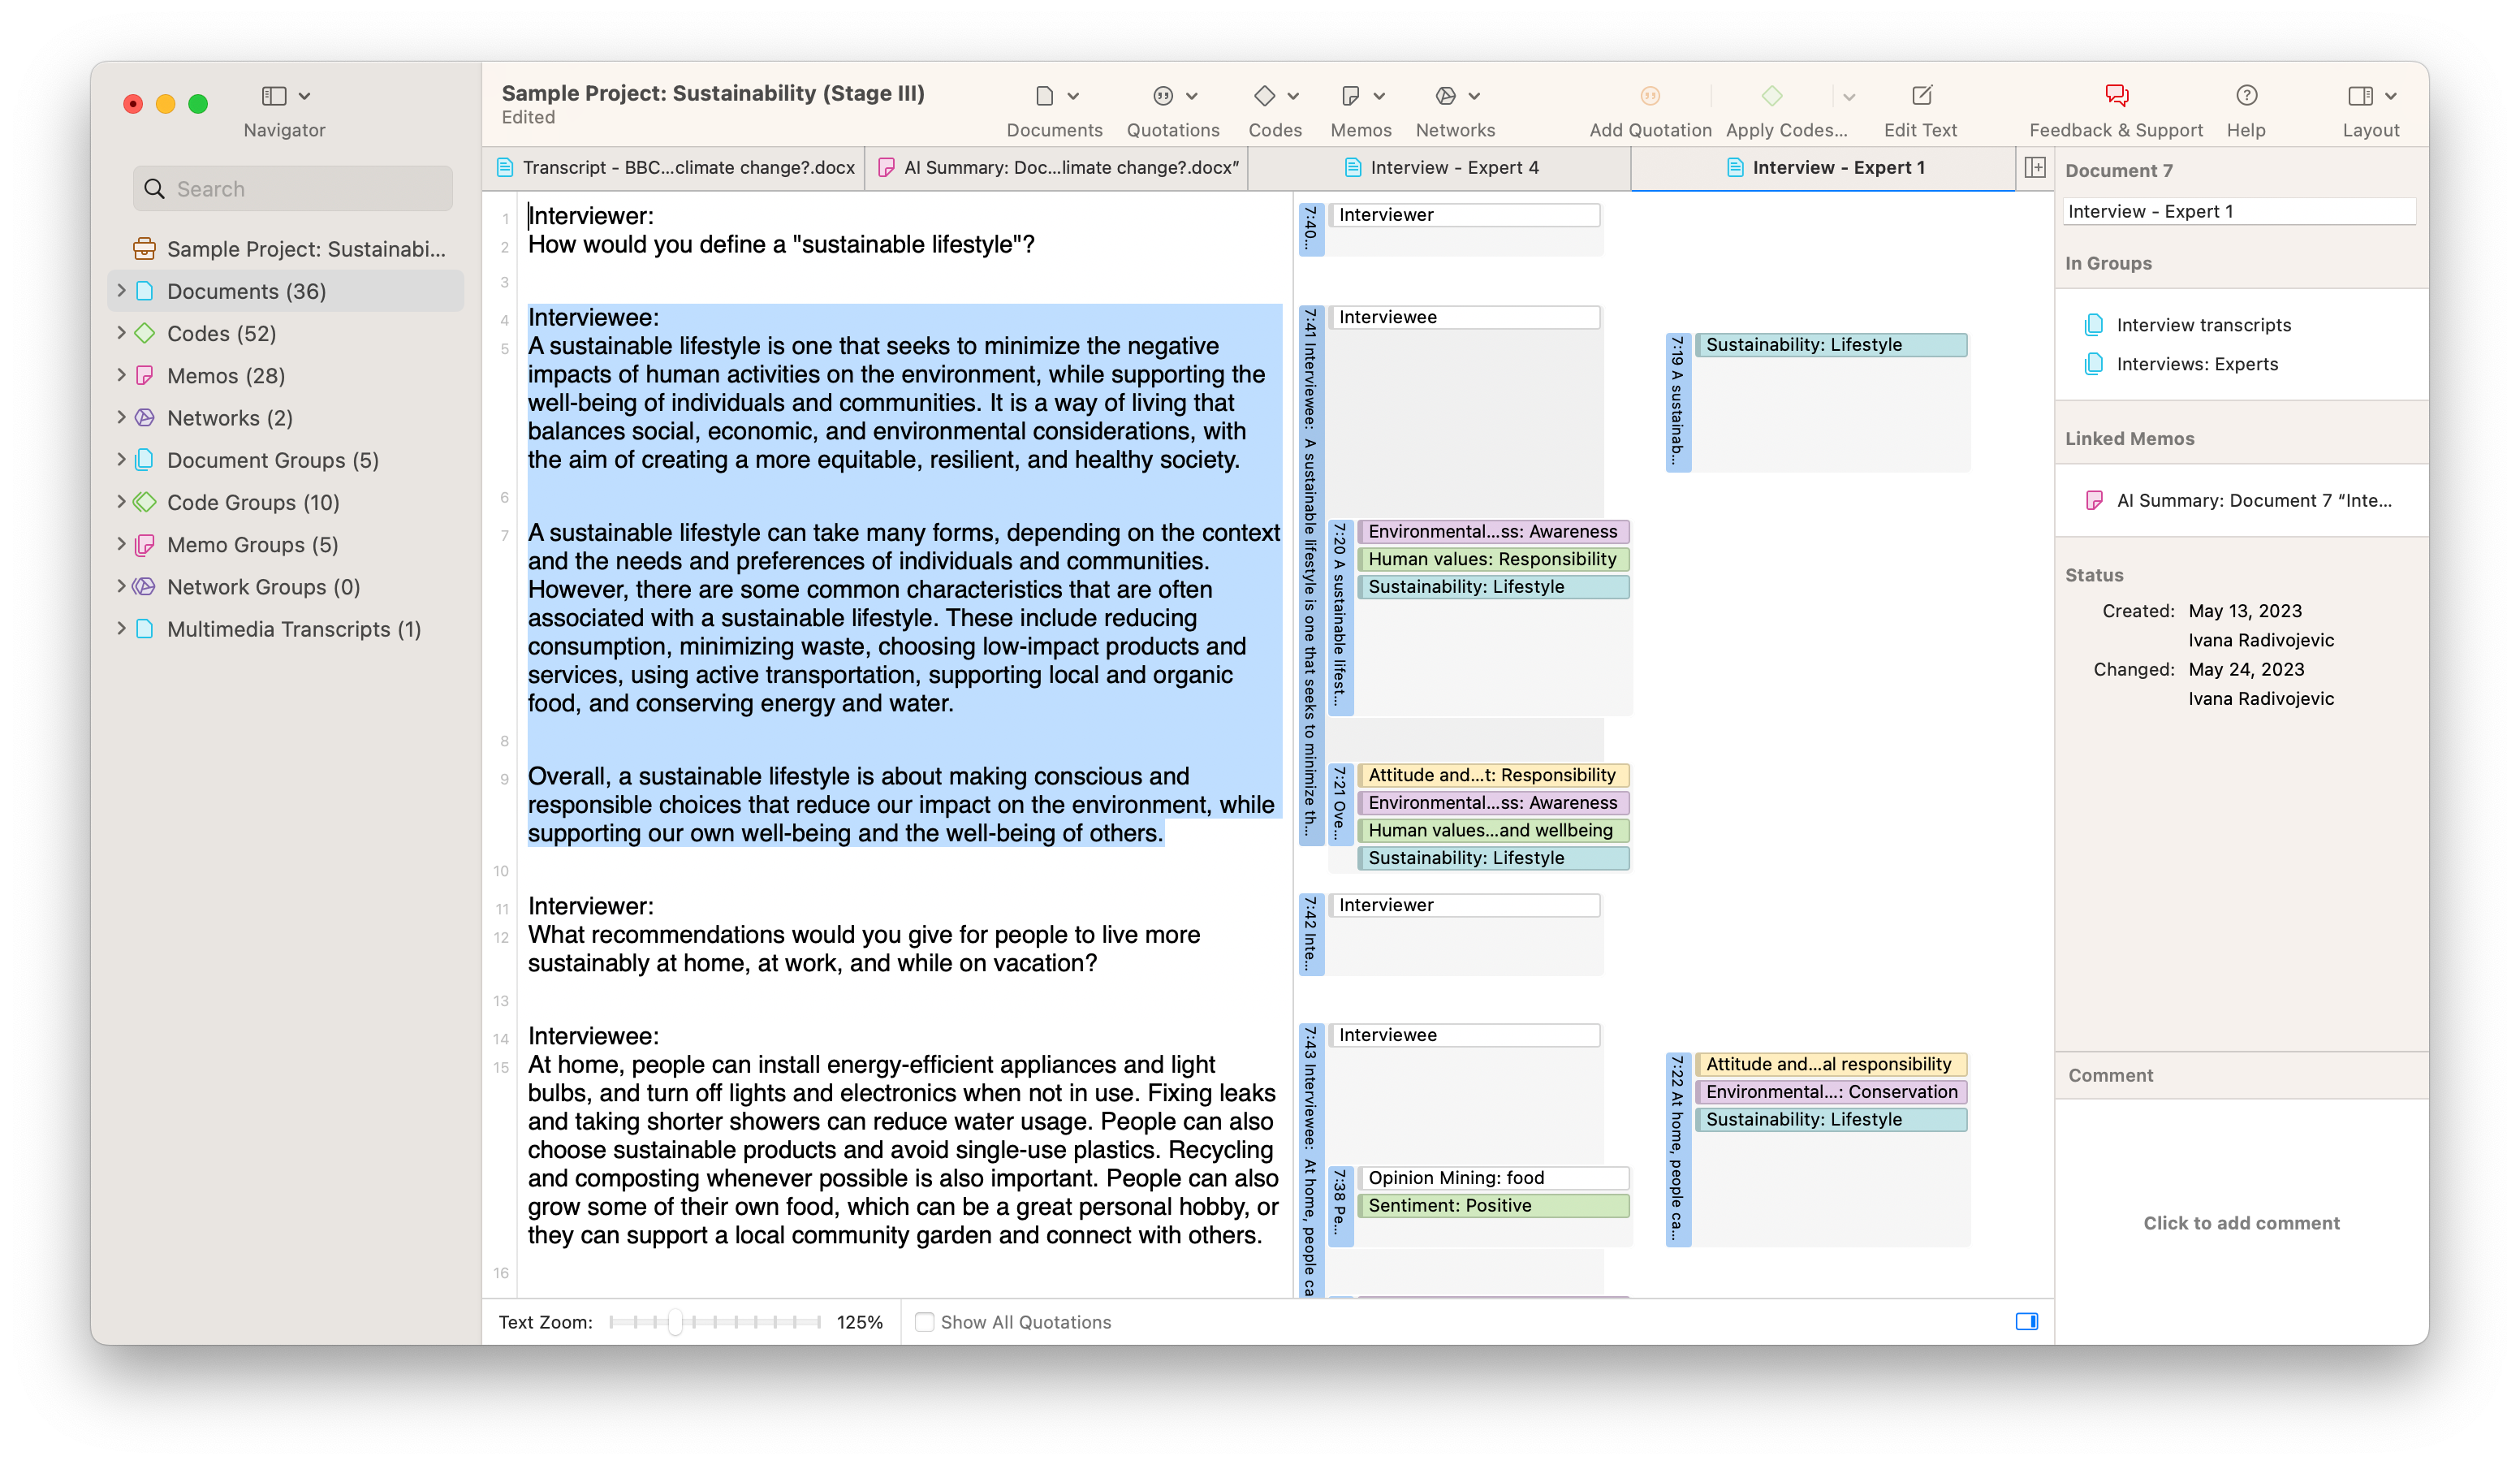
When you have transcripts from focus groups involving multiple research participants, you may only want to analyze participant responses without including utterances from the interviewer or moderator. The Focus Group Coding tool in ATLAS.ti can create codes for all of the speakers in a transcript to capture participant names, demographics, or any other characteristics of interest. Then you can refine your focus of the data by looking at text labeled with the codes for your interview respondents to get the most relevant insights quickly and easily.
Data visualization
In any research project, a picture can tell a thousand words. This is especially true for visualizations like word clouds and Sankey diagrams, all of which can be generated in ATLAS.ti. An insightful visualization can be incredibly beneficial in research papers or presentations to persuade your audience and to help you make sense of your rich qualitative data.
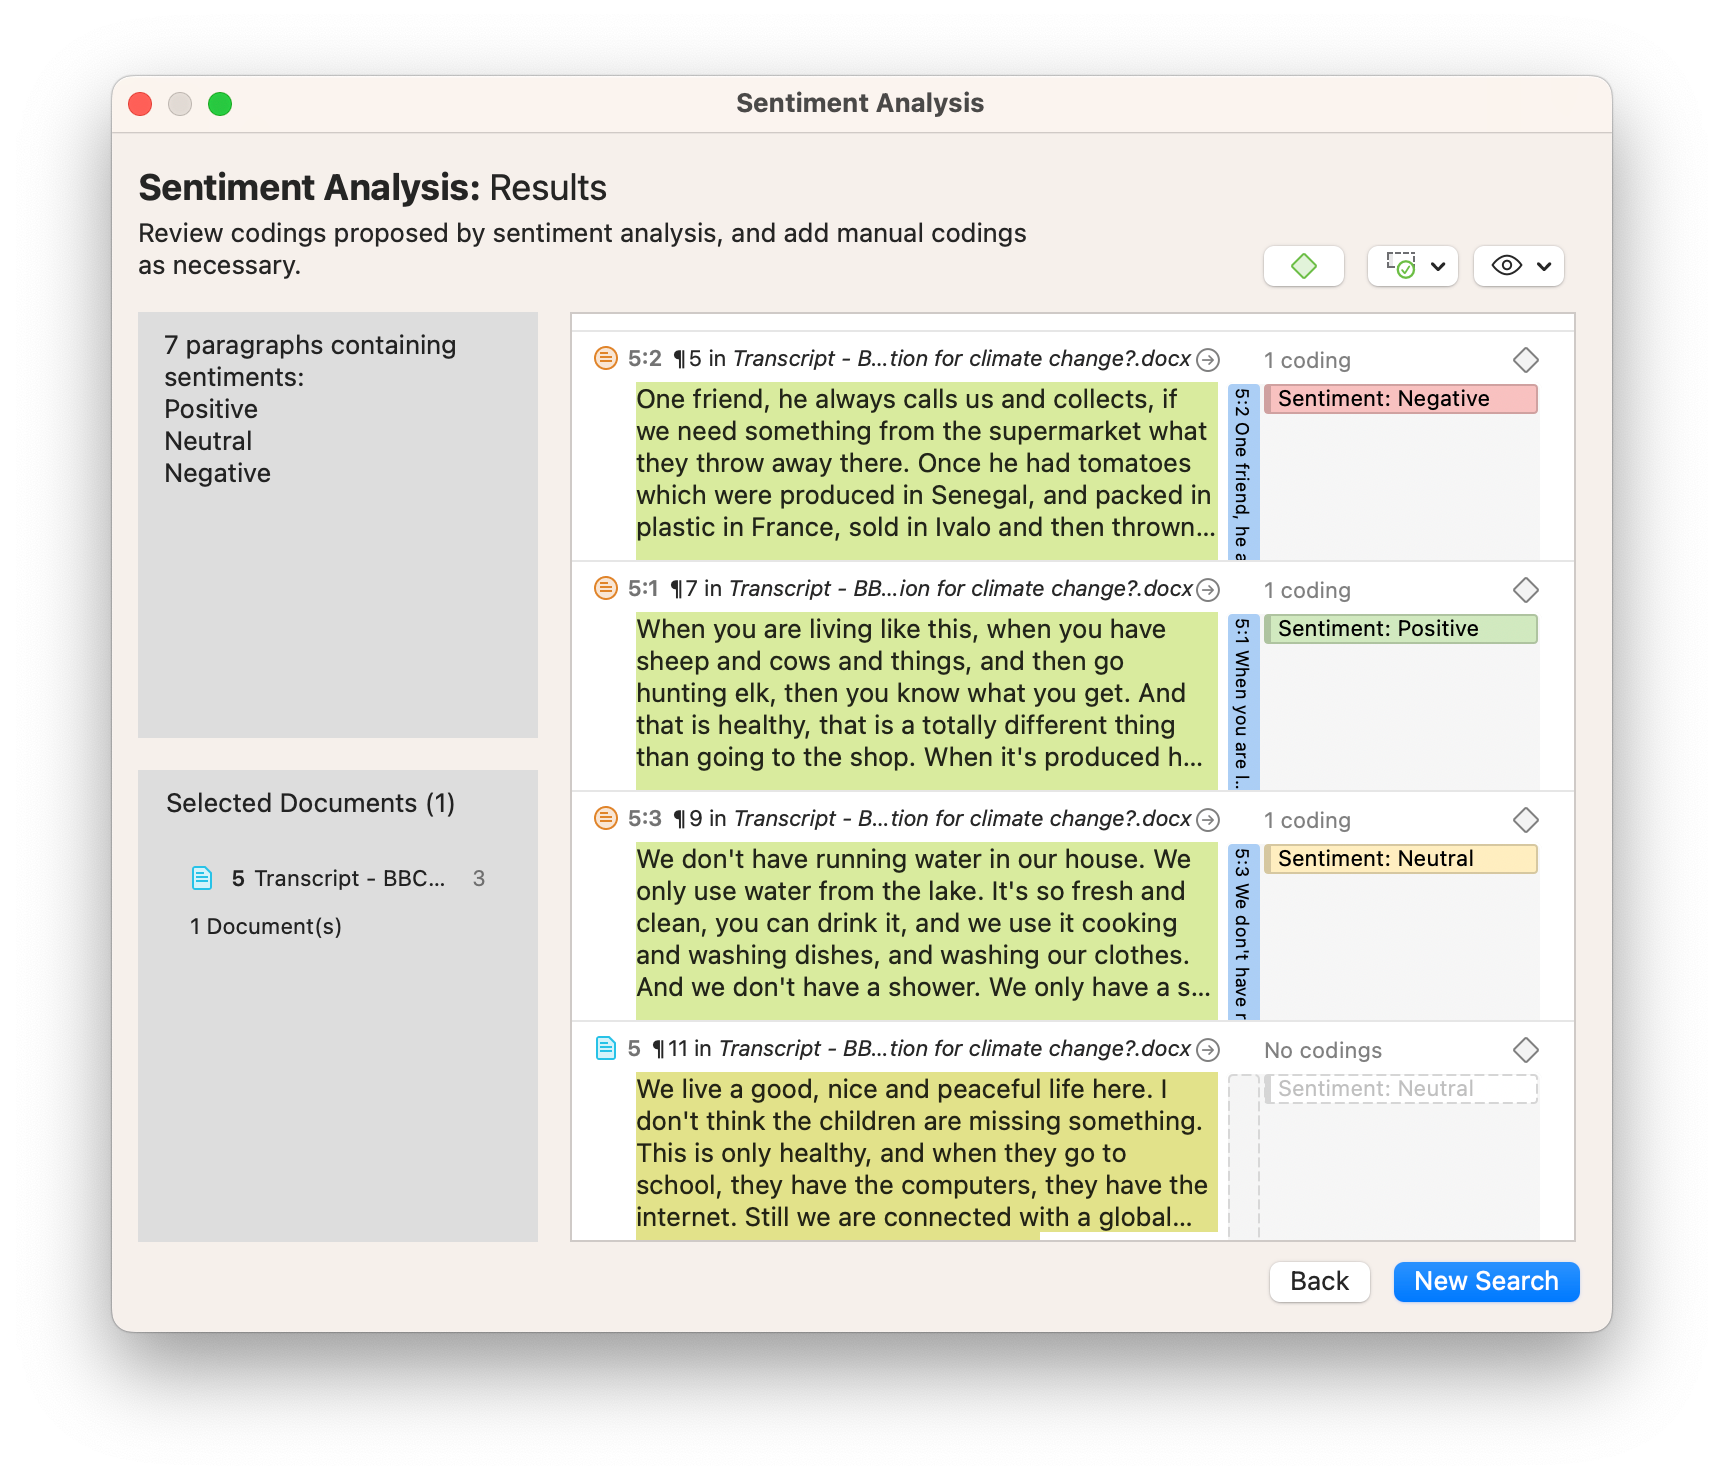
Text mining
A number of tools in ATLAS.ti can mine textual data to uncover meaningful insights, such as concepts, opinions, entities, and more. Sentiment Analysis, for instance, parses the text in documents to determine whether the language is either positive, negative, or neutral in nature. Used in conjunction with the Focus Group Coding tool, for example, you can use Sentiment Analysis to identify how different interview respondents feel about a particular topic or concept.
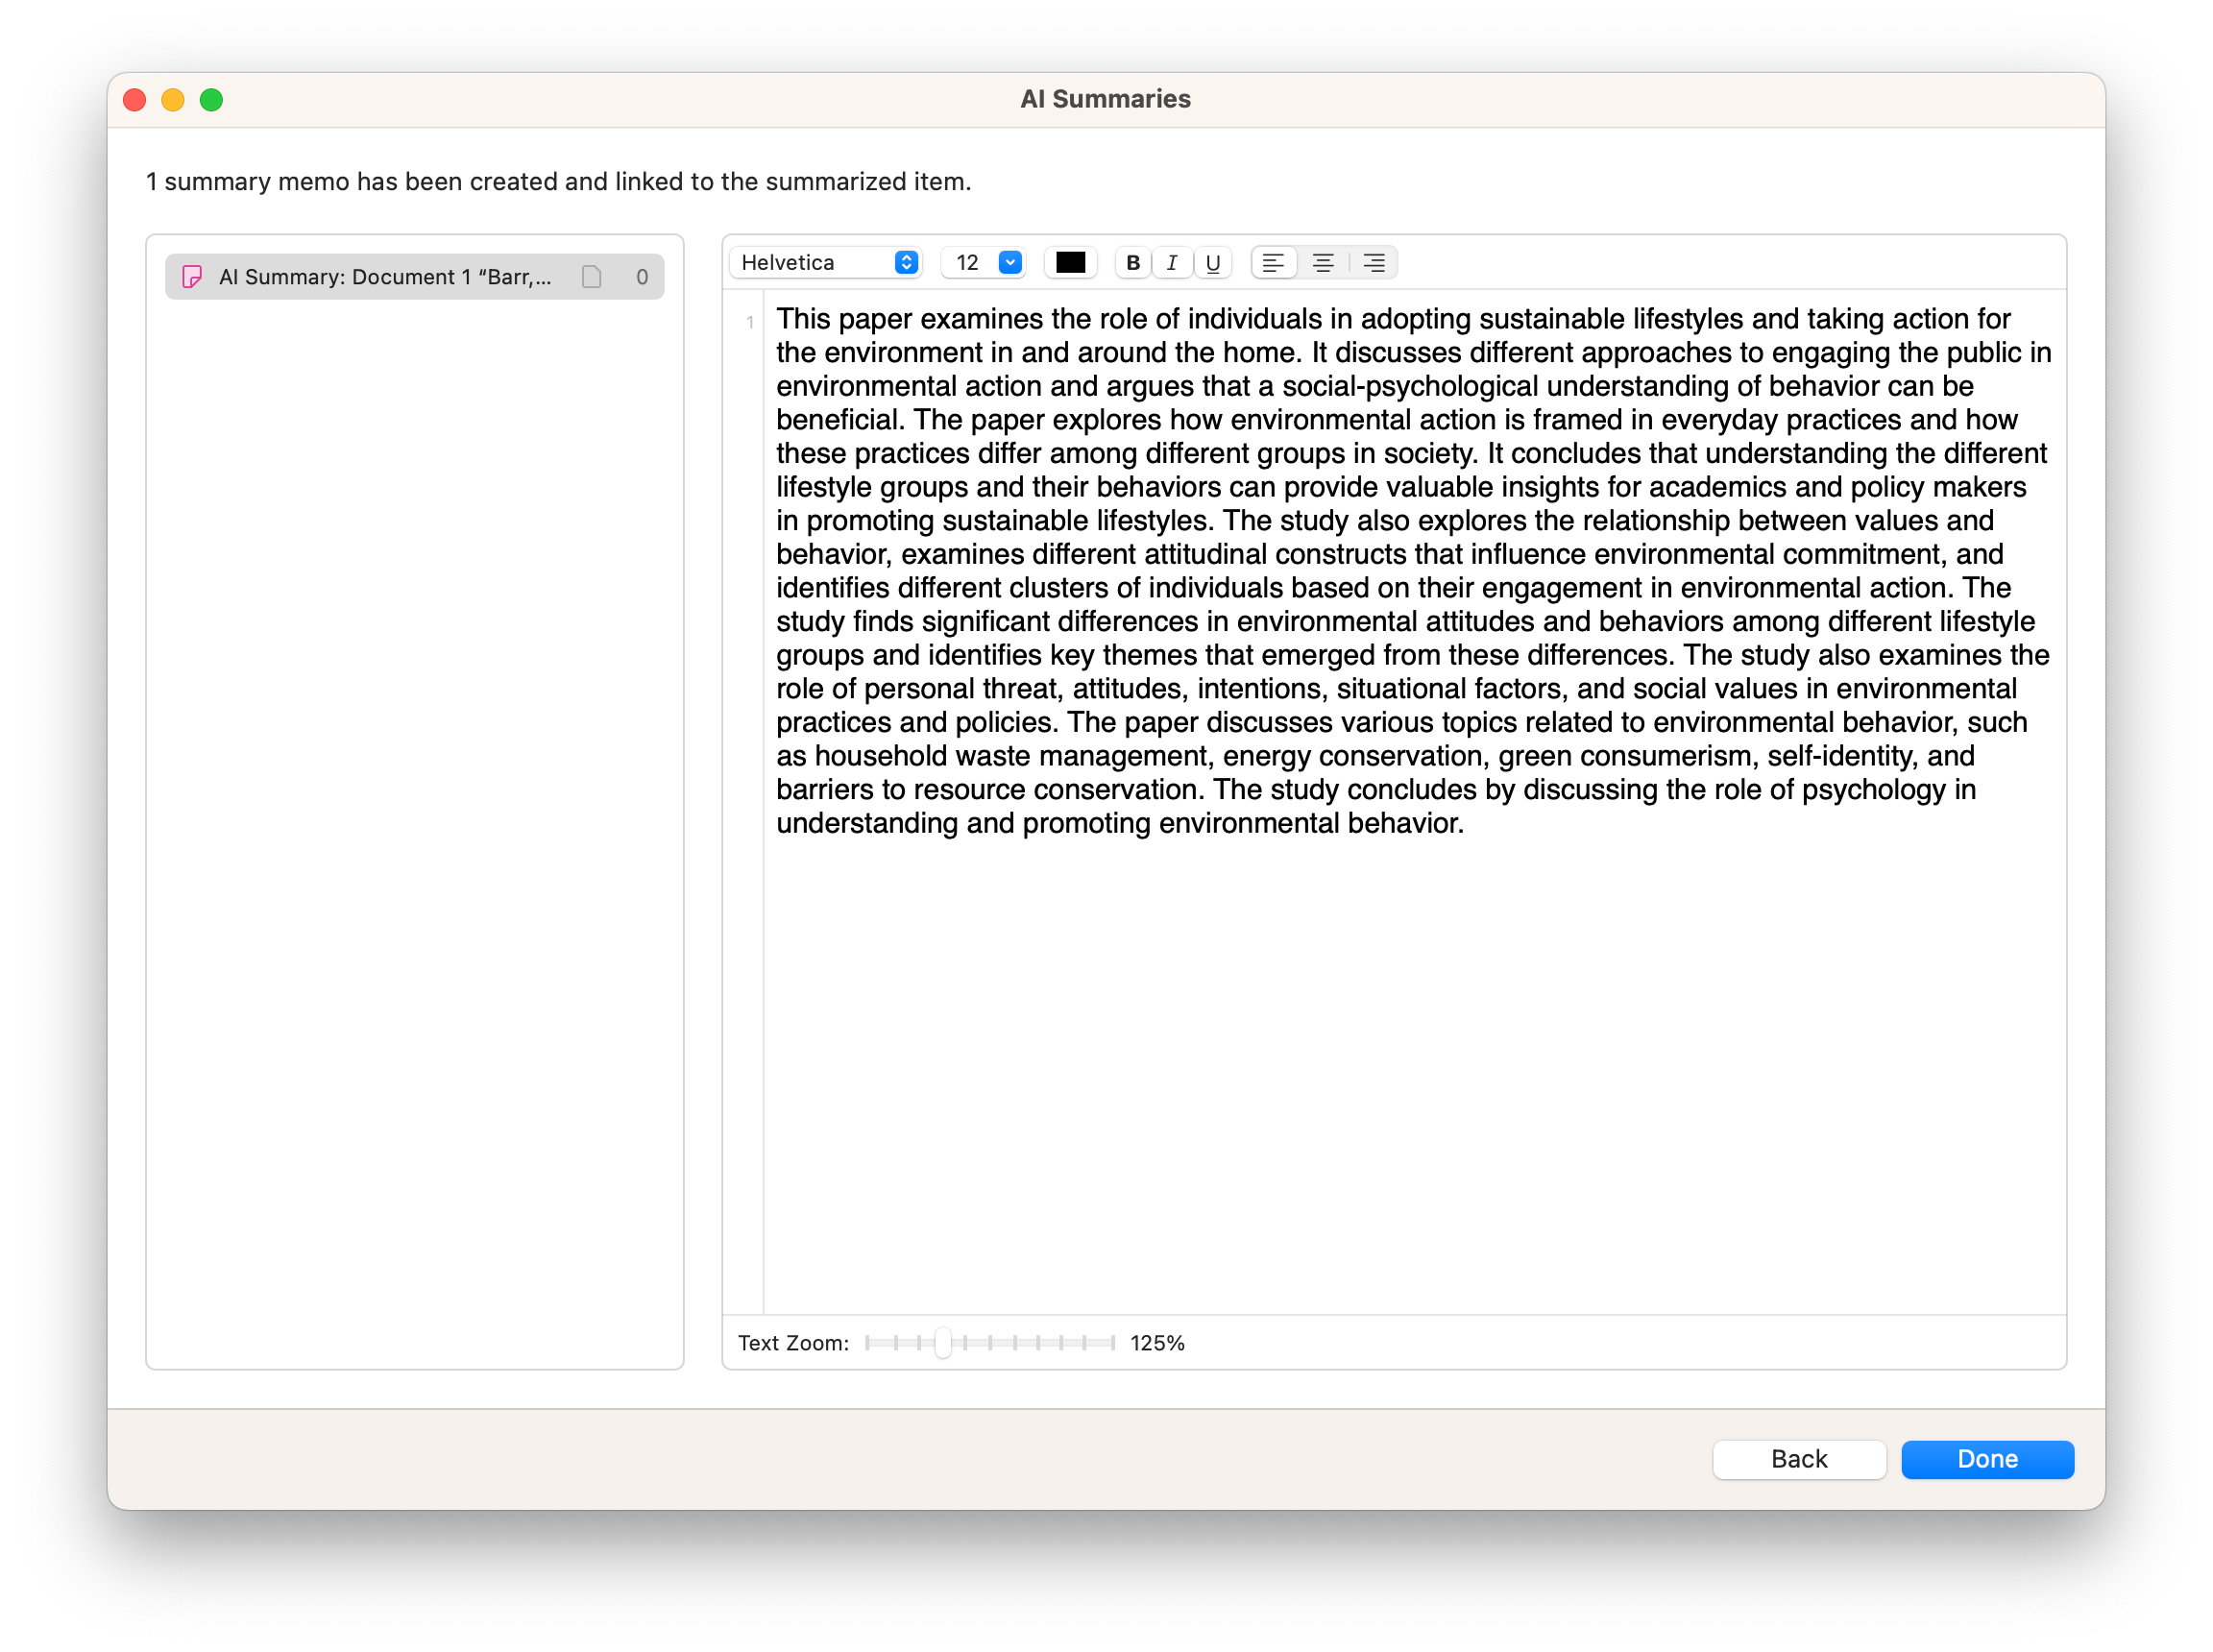
Artificial intelligence tools
ATLAS.ti's advanced features such as AI Coding and AI Summaries take advantage of generative artificial intelligence to describe any body of textual data, which can be manifest in qualitative coding or in brief summaries to facilitate your analysis. With these AI-assisted tools at your fingertips, you can analyze large sets of textual data more quickly than with analog methods or with traditional CAQDAS software.