Data Analysis Software | Features & How To Choose

- Introduction
- What is data analysis?
- What is data analysis software?
- Why rely on software for data analysis?
- What can data analysis software do?
- Types of data analysis software
- How to choose data analysis software
Introduction
Data analysis software has become an essential tool for researchers and professionals who need to handle large amounts of data efficiently. This software assists in organizing, retrieving, and visualizing data, making complex analyses more manageable. With various types available, it can cater to both qualitative and quantitative research needs.
Understanding what data analysis tools offer and how to choose the right one can significantly impact the effectiveness of your data analysis process. This article will provide an overview of data analysis software, its key features, and guidance on selecting the best option for your specific requirements.

What is data analysis?
Data analysis is the process of applying systematic techniques to organize, interpret, and summarize data. It is used in various fields, including business, science, healthcare, and social sciences, to identify patterns, draw conclusions, and make informed decisions. The process typically involves several key steps: data collection, data preparation, data analysis, and interpretation of the results.
Data collection
The first step in data analysis is data collection, where relevant data is gathered from various sources. This data can be qualitative, quantitative, or a mix of both, depending on the research goals. Once collected, the data must be prepared for analysis. This preparation includes cleaning the data to remove any errors or inconsistencies and organizing it in a way that makes it easier to analyze.
Data analysis
After the data is prepared, the analysis phase begins. This involves applying appropriate methods to examine the data, whether through statistical calculations, thematic analysis, or other techniques suited to the type of data being used. The goal is to identify trends, relationships, or patterns that can provide insights into the research questions or problems being studied.
Data interpretation
The final step in data analysis is interpreting the results. This involves making sense of the data and bringing the findings together into a format that is understandable and actionable, such as narrative writing and visual displays. The insights developed from the overall data science process can then be used to inform decisions, improve processes, or support research conclusions.
What is data analysis software?
Data analysis software is a tool designed to help users organize, manage, and analyze data efficiently. This software is used across various industries to streamline the process of data analysis, making it easier to handle large datasets and complex analytical tasks. The software can be tailored to different types of data, whether qualitative or quantitative, and offers functionalities that support different analytical methods.
Streamlined automation
The primary function of data analysis software is to automate and simplify the process of analyzing data. Instead of manually sorting through data and performing calculations, the software can perform these tasks quickly and accurately. It allows users to input raw data, which can then be organized, filtered, and analyzed according to specific parameters. This capability is especially useful when dealing with large volumes of data or when complex analytical methods are required.
Visualization and analytics tools
In addition to basic data handling, many data analysis software programs offer advanced features such as data visualization, predictive analytics, and machine learning integration. These features help users gain deeper insights from their data by providing tools that can identify patterns, trends, and relationships that may not be immediately obvious. Data visualization, in particular, is a powerful feature that enables users to create charts, graphs, and other visual representations of data, making it easier to understand and communicate findings.
User-friendly interface
Today, data analysis software is designed to be user-friendly, often featuring intuitive interfaces that allow users to navigate through the different functions with minimal technical expertise. This accessibility ensures that even users without a strong background in data analysis can effectively use the software to achieve their research or business goals.
Why rely on software for data analysis?
Data analysis software offers several advantages that make it a valuable tool for researchers and professionals across various fields. These benefits can be categorized into three main areas: efficiency, accuracy, and capability.
Efficiency
One of the most significant advantages of using data analysis software is the efficiency it brings to the data analysis process. Manual data analysis can be time-consuming, especially when dealing with large datasets or complex analyses. Data analysis software automates many of the tasks involved, such as data cleaning, organization, and calculation.
This automation reduces the time and effort required to perform these tasks, allowing users to focus on interpreting the results rather than getting bogged down in the mechanics of data handling. Additionally, the software can process large volumes of data much faster than manual methods, enabling users to complete their analyses in a fraction of the time it would take otherwise.
Accuracy
Accuracy is another benefit of relying on software for data analysis. Human error is a common issue in manual data analysis, particularly when working with large datasets or performing complex calculations.
Data analysis software minimizes the risk of such errors by automating the analysis process and providing tools that ensure consistency and precision. The software is designed to handle various types of data and perform calculations with high accuracy, reducing the likelihood of mistakes that could skew the results. Moreover, many data analysis programs include features that help identify and correct errors in the data before analysis begins, further enhancing the credibility of the results.

Capability
Data analysis software also expands the range of analyses that can be performed. While manual methods may be limited by the analyst's skills and available time, software tools can handle a broader spectrum of analytical tasks. This includes advanced statistical analyses, data modeling, predictive analytics, and even machine learning algorithms.
These capabilities allow users to explore their data in more depth and uncover insights that might not be accessible through manual analysis. Additionally, many software programs offer data visualization tools that help users present their findings in a clear and impactful way, making it easier to communicate results to others.
What can data analysis software do?
Data analysis software provides a range of functionalities that streamline and enhance the data analysis process. These tools help users manage data more effectively, retrieve relevant information quickly, and present findings in a clear and visually appealing manner.
This section will explore three key capabilities of data analysis software: data organization, data retrieval, and data visualization.
Data organization
One of the fundamental tasks in data analysis is organizing the data in a way that makes it accessible and easy to work with. Data analysis software helps with this task by providing tools that allow users to categorize, sort, and structure data according to various parameters. Whether dealing with qualitative or quantitative data, these tools enable users to manage large datasets efficiently.
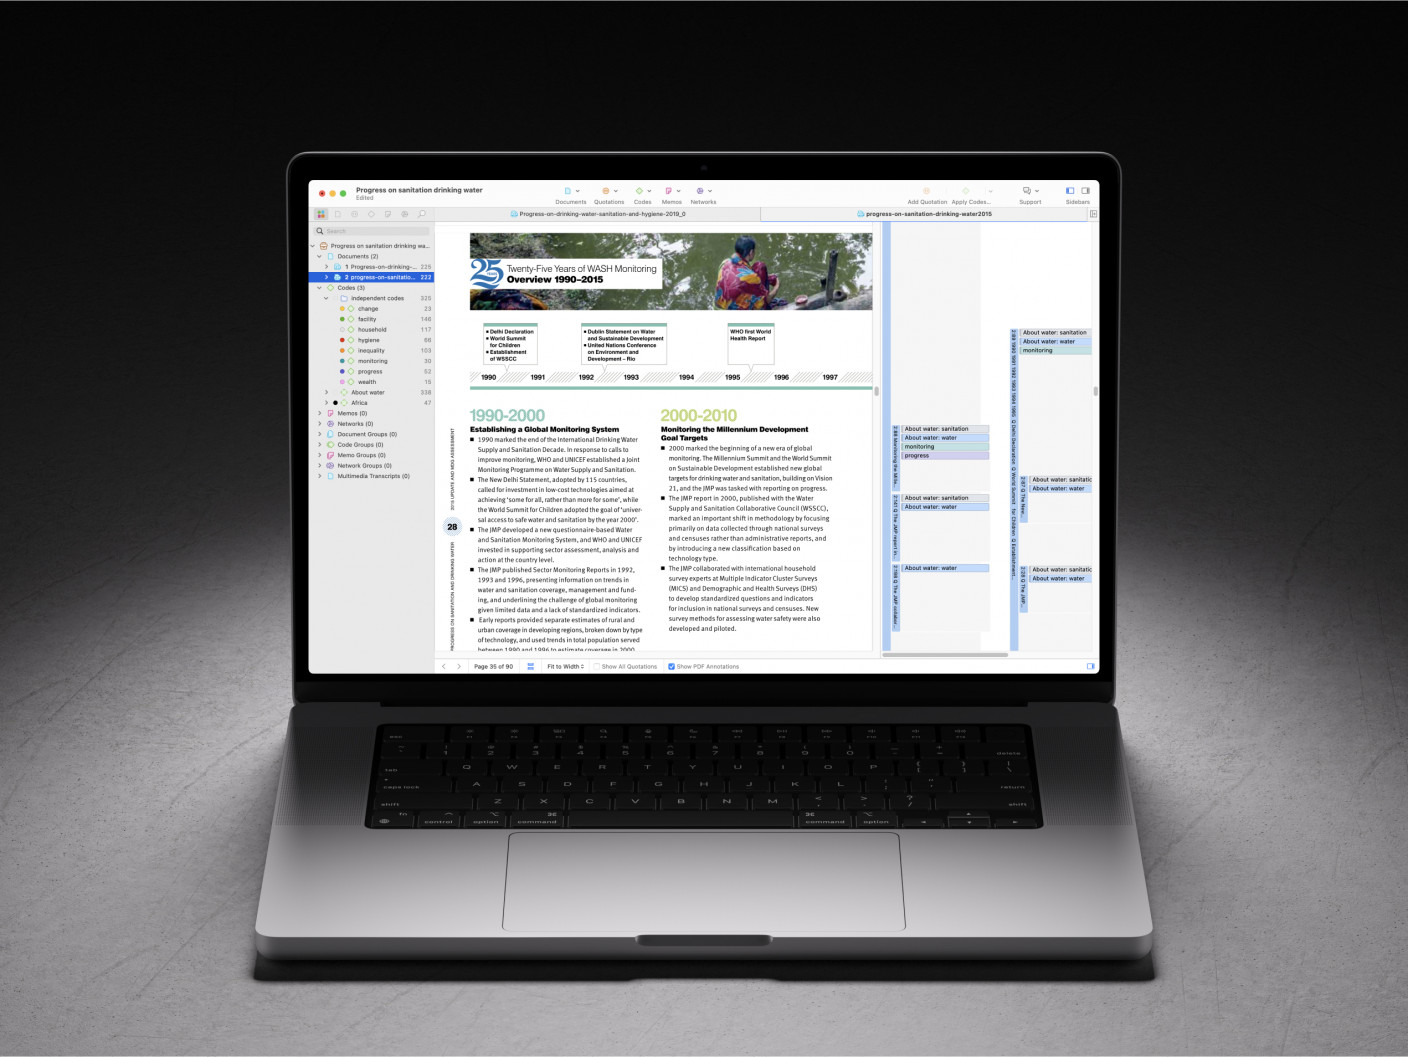
For qualitative data, such as interview transcripts or survey responses, the software can help organize the data into themes, categories, or codes. This organization is critical for researchers who need to sift through large amounts of text to identify patterns or recurring themes. By grouping related data together, the software simplifies the analysis process and makes it easier to draw meaningful conclusions.
Quantitative data, such as numerical datasets, also benefits from the organizational features of data analysis software. The software can sort data by variables, filter out irrelevant information, and aggregate data points to provide a clearer picture of the overall trends. This level of organization is particularly useful when dealing with complex datasets that require careful management to ensure accurate analysis.
Data retrieval
Once data is organized, the next challenge is retrieving relevant information quickly and efficiently. Data analysis software offers robust search and retrieval functions that allow users to locate specific data points or subsets of data with ease. This capability is especially important in large datasets, where manually searching for information would be time-consuming and prone to error.
For qualitative data, retrieval features may include keyword searches, code searches, and the ability to retrieve data based on specific criteria, such as date ranges or respondent characteristics. These tools enable researchers to focus on the most relevant parts of the data, speeding up the analysis process and ensuring that no important information is overlooked.
Quantitative data retrieval is also enhanced by software tools that allow for the quick extraction of relevant data subsets. Users can apply filters, create custom queries, and generate reports that focus on specific variables or data points. This ability to retrieve data efficiently is key to conducting thorough and accurate analyses, particularly when working with large and complex datasets.
Data visualization
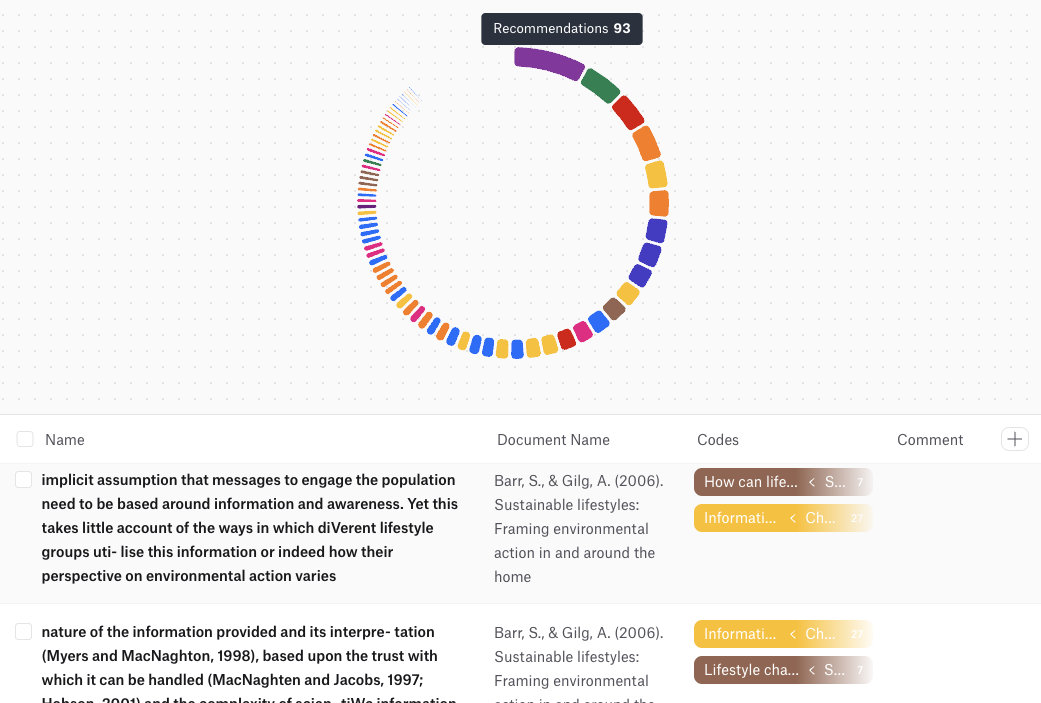
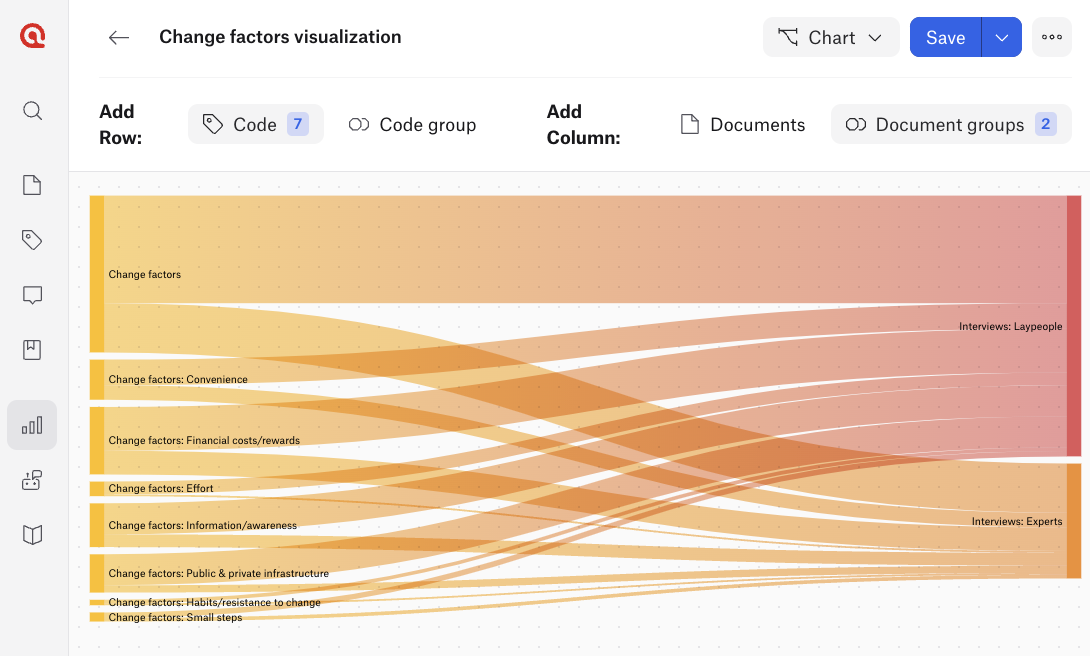
Data visualization is another key feature of data analysis software that plays an important role in interpreting and presenting data. Visualization tools transform raw data into visual formats, such as charts, graphs, and maps, making it easier to understand patterns, trends, and relationships within the data. This visual representation is not only helpful for the analyst but also for communicating findings to others, whether in a report, presentation, or publication.
Qualitative data can be visualized through tools that create word clouds, thematic maps, or flow charts, helping to illustrate the connections and themes that emerge from the data. These visual aids can make complex qualitative findings more accessible and easier to grasp.
For quantitative data, many visualization options are also available. Users can create bar charts, line graphs, scatter plots, pie charts, and other types of graphs to represent numerical data. These visuals can highlight key trends, compare variables, and show relationships between different data points. The ability to customize these visualizations—adjusting colors, labels, scales, and other elements—further enhances the clarity and impact of the presentation.
Moreover, some advanced data analysis software includes data visualization capabilities that allow users to explore their qualitative and quantitative data dynamically. For example, users might click on a part of a graph to drill down into more detailed data or adjust filters to see how different subsets of the data affect the outcomes. This interactivity can provide deeper insights and make data exploration more engaging and informative.
Types of data analysis software
Data analysis software comes in various forms, each tailored to specific types of data and analytical needs. Broadly, these tools can be categorized into two main types: qualitative data analysis software and quantitative data analysis software. Understanding the differences between these types is important for selecting the right tool for your research or business needs.
Qualitative data analysis software
Qualitative data analysis software is designed to handle non-numerical data, such as text, audio, video, and images. This type of software is particularly useful in fields like social sciences, education, and market research, where understanding the meaning, context, and themes within the data is more important than numerical analysis.
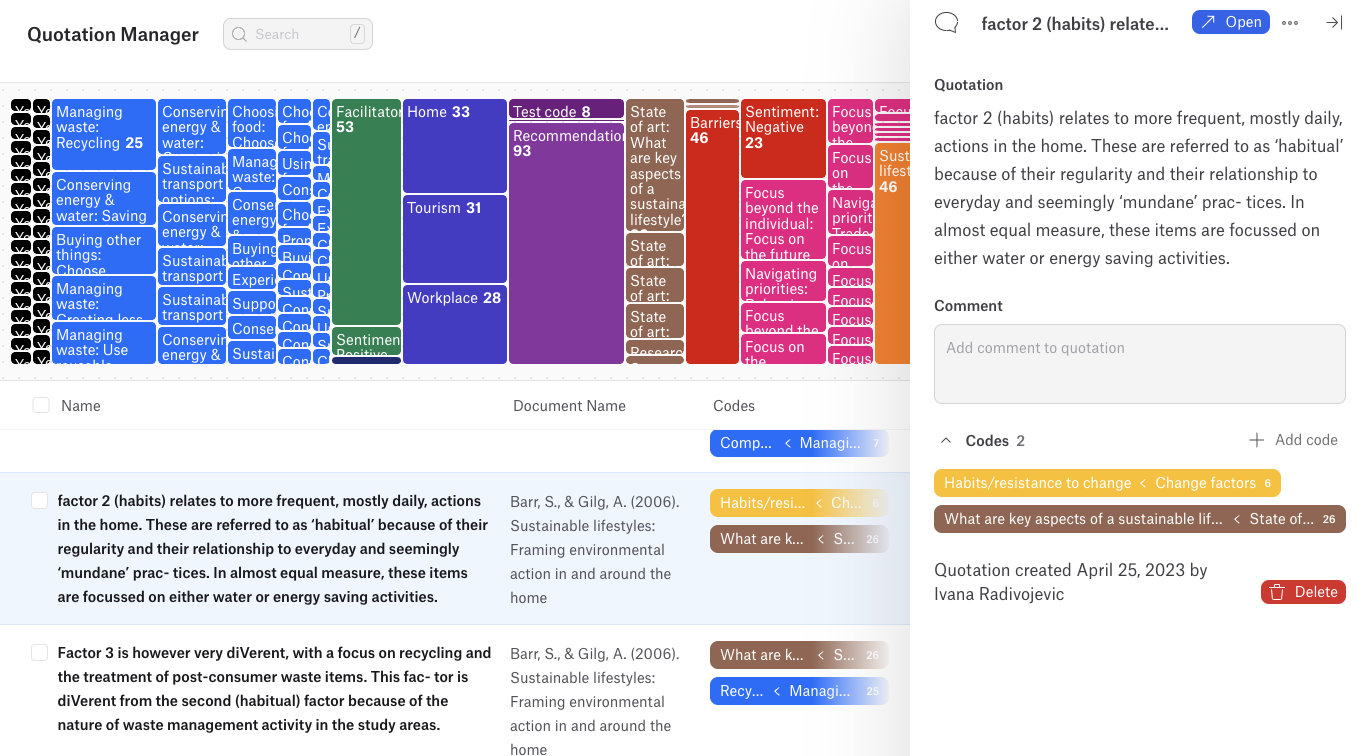
One of the key functions of qualitative data analysis software is coding, which involves labeling sections of data with tags or codes that represent specific themes or concepts. This process helps in organizing the data into categories, making it easier to identify patterns and draw conclusions. The software allows users to create and manage these codes efficiently, even when dealing with large volumes of data.
Another important feature of qualitative data analysis software is its ability to manage complex data types. For example, the software can handle transcripts of interviews, focus group discussions, or open-ended survey responses.
It also supports multimedia data, allowing researchers to analyze audio recordings, videos, and images within the same project. This flexibility makes it possible to perform in-depth analyses across various types of qualitative data.
Qualitative data analysis software also often includes tools for visualizing data. These tools can create visual representations of themes, code frequencies, or relationships between different codes, making it easier to interpret and present the findings. The ability to visualize qualitative data can be particularly helpful in communicating complex ideas to stakeholders or in academic publications.
Quantitative data analysis software
Quantitative data analysis software is designed for numerical data. This type of software is commonly used in fields like finance, economics, engineering, and the natural sciences, where the focus is on numerical analysis, hypothesis testing, and statistical modeling.
One of the primary functions of quantitative data analysis software is statistical analysis. Statistical analysis software can perform a wide range of statistical tests, from basic descriptive statistics to more complex inferential analyses.
This includes tests like t-tests, ANOVAs, regression analyses, and chi-square tests, among others. The software automates these calculations, reducing the risk of human error and ensuring that the analyses are conducted accurately and efficiently.
Another key feature of statistical software is data visualization. Data manipulation for the purpose of visualization often includes sophisticated options, such as histograms, scatter plots, bar charts, and line graphs. These visualizations help users understand the distribution of data, identify outliers, and observe trends over time.
Quantitative data analysis software also typically includes features for data management, such as data cleaning and preparation. The software can identify and handle missing data, outliers, and other anomalies, ensuring that the dataset is ready for analysis. This is particularly important in quantitative research, where the accuracy of the data directly impacts the validity of the results.

Mixed methods data analysis software
Some data analysis software packages offer integrated solutions that combine both qualitative and quantitative analysis capabilities. These tools are designed for mixed methods research, where both qualitative and quantitative data are collected and analyzed. Integrated data analysis software allows researchers to manage and analyze both types of data within a single platform, providing a more holistic view of the research problem.
One of the key advantages of integrated data analysis software is the ability to link qualitative and quantitative data. For example, a researcher might start with a quantitative survey to identify general trends and then conduct qualitative interviews to explore those trends in more depth. The software allows the researcher to analyze both sets of data together, providing insights that might not be apparent from analyzing each type of data separately.
Integrated data analysis software also often includes features that facilitate the integration of findings from different data types. For example, the software might offer tools for comparing themes from qualitative data with statistical results from quantitative data, helping researchers build a more complete understanding of their findings.

How to choose data analysis software
Choosing the right data analysis software is essential for ensuring that your research or business objectives are met efficiently and accurately. The selection process should consider several key factors, including the type of data you are working with, the specific features you need, and your budget.
Identify your data type
The first step in choosing data analysis software is identifying the type of data you will be analyzing. If your data is primarily qualitative, such as interview transcripts, focus group discussions, or open-ended survey responses, you will need software that helps you with managing and analyzing non-numerical data.
On the other hand, if your data is quantitative, consisting of numerical data like survey results, financial records, or experimental measurements, you should look for software that offers robust statistical analysis tools. For those conducting mixed-methods research, integrated software that supports both qualitative and quantitative data can be particularly valuable.
Evaluate software features
Once you have identified your data type, the next step is to evaluate the features offered by different software options. Consider what specific functions you need, such as data organization, retrieval, or visualization capabilities. For qualitative data, coding and text analysis tools are essential, while quantitative analysis requires strong statistical and data management features.
Additionally, consider whether you need advanced options like machine learning integration, predictive data analytics, or interactive data visualization. Make sure the software you choose offers the tools and the interactive dashboards necessary to perform your analysis effectively.
Consider your budget
Finally, consider your budget when selecting data analysis software. Prices can vary widely, from free or open-source tools to premium software with extensive features. It’s important to balance cost with the functionality you require.
For example, open-source software might be suitable for basic needs, but if your project requires advanced analysis or large-scale data handling, investing in a more robust paid option might be necessary. Additionally, consider any ongoing costs, such as subscription fees or charges for updates and support. Choose software that fits your budget while still meeting your analytical needs.