Code frequency analysis | The code-document table | ATLAS.ti Desktop


- Code frequency analysis with ATLAS.ti: The document table
- What is the Code-Document Table?
- How does the Code-Document Table work?
- Select the code(s) and/or code group(s), document(s) and/or document group(s) you are interested in
- View normalized frequency counts and relative frequencies
- Export your table to Excel to save your results
Code frequency analysis with ATLAS.ti: The document table
ATLAS.ti Windows & Mac provide a comprehensive workbench for your qualitative data analysis. You can code just about any type of qualitative data, and you can take advantage of ATLAS.ti’s advanced analysis tools to explore your data in different ways. In this Best Practices article, we will show you how you can examine the frequencies of your codes using the Code-Document Table.
What is the Code-Document Table?
With this tool, you can construct tables that show the frequencies of your codes and/or code groups. In other words, you can see how many times a certain code (or code group) was used in a particular document (or document group). Therefore, you can explore where in your project the different codes (or concepts) appear.
The Code-Document Table can show you absolute frequencies, normalized frequency counts, and relative frequencies. You can likewise view the quotations behind each frequency count, so you are always staying close to the context of these numbers. The Code-Document Table can be exported directly to Excel, so you can easily save your results and create charts or graphs of your results to include in final reports and presentations.
How does the Code-Document Table work?
Using the Code-Document Table consists of the following steps:
- Open the Code-Document Table
- Select the code(s) and/or code group(s) you are interested in
- Select the document(s) and/or document group(s) you are interested in
- View normalized frequency counts and relative frequencies, if you would like
- Export your table to Excel to save your results
Now let’s take a look at each step and work through an example. In this project, we are analyzing online leadership and the ways in which online leaders communicate their vision, make decisions, negotiate, and use their resources of power.
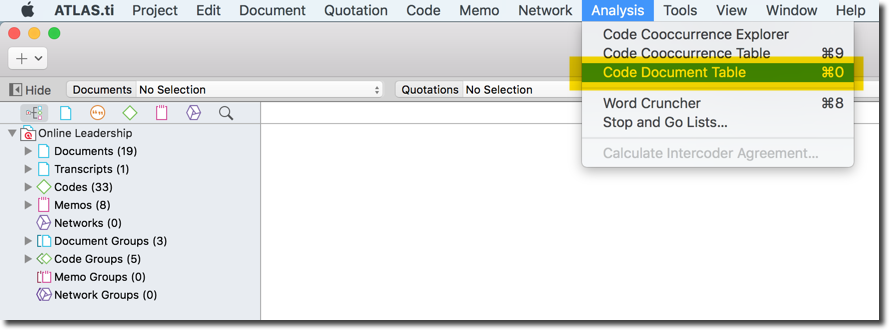
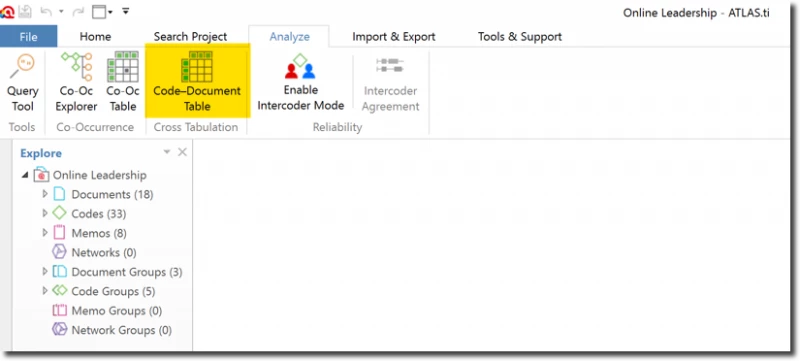
First, we will open the Code-Document Table. In ATLAS.ti Windows, you will find the tool under the “Analyze” tab. In ATLAS.ti Mac, the tool is in the “Analysis” menu.
Select the code(s) and/or code group(s), document(s) and/or document group(s) you are interested in
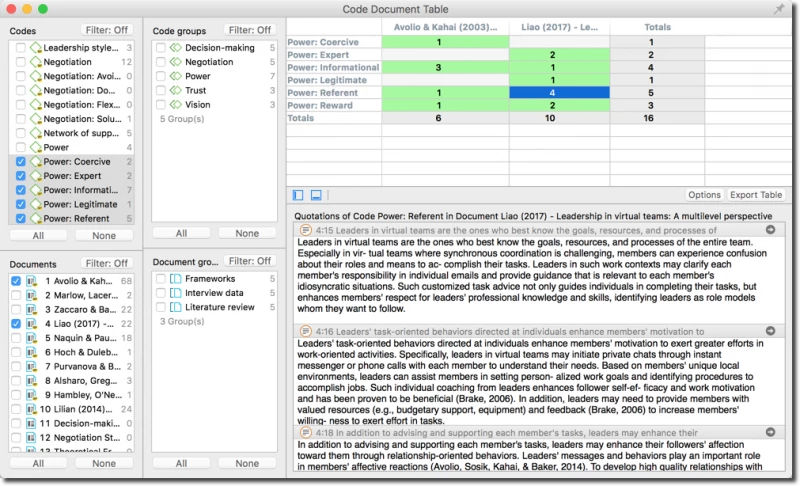
On the left-hand side, you can select the codes and documents you want to analyze. You can pick either individual codes, code groups, individual documents, document groups, and/or any combination of these.
As you tick the boxes, you will see the table automatically updating to show the frequencies. If you click on any of the cells, you can see a preview of the exact quotations down below.
View normalized frequency counts and relative frequencies
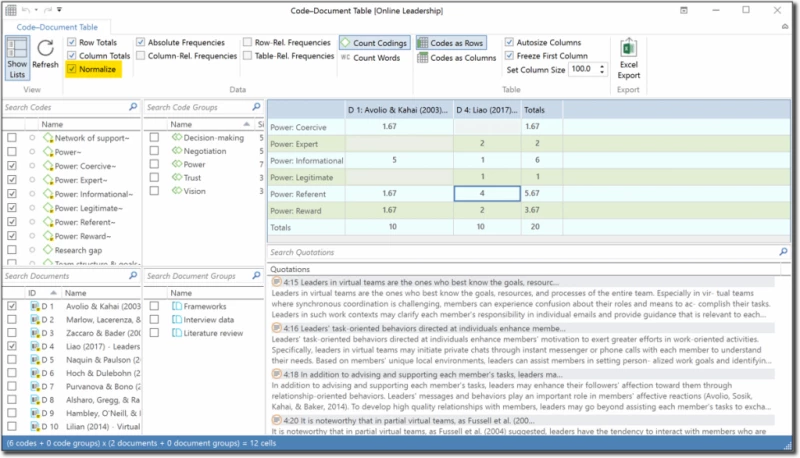
In the above example, we are examining how many times the different types of power were mentioned across two articles from our literature review. You can see that the code “Power: Referent” was used four times in document 4 “Liao (2017)”. In other words, it seems that Liao (2017) mentions online leaders using referent power four times. We can already see that, in comparison to Avolio and Kahai (2003), Liao (2017) talks more about online leaders using referent power. Below the table, we can see a preview of these four quotations (and by clicking on any of the quotations, you can see it back in its original document; ATLAS.ti always keeps you close to your data!).
Right now, the table is showing us the absolute frequencies of these codes. However, what if Liao (2017) is a 30-page article, while Avolio and Kahai (2003) is a 10-page article? Well then, these results are slightly distorted as there is more data (i.e., there are more quotations) in Liao (2017) in comparison to Avolio and Kahai (2003). Therefore, we cannot make accurate comparisons based on just these absolute frequencies. What do we do now?
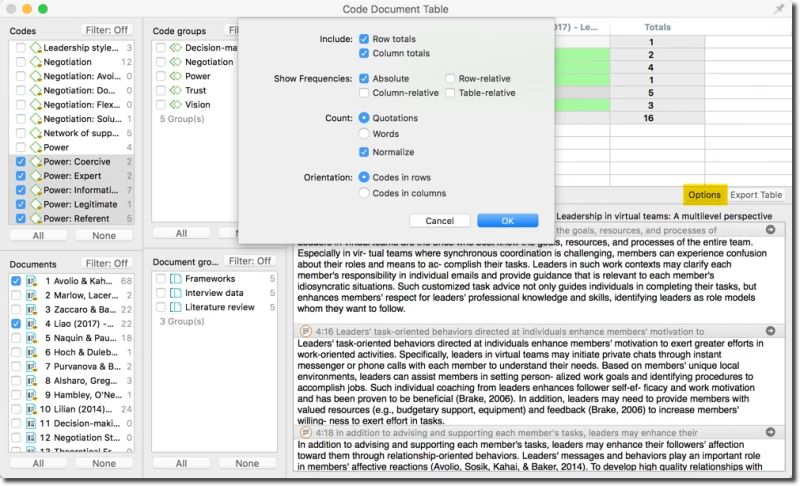
Fortunately, ATLAS.ti is here to help! You can normalize these frequency counts: the numbers are automatically adjusted by taking the size of the document into consideration. In ATLAS.ti Windows, click on “Normalize” in the ribbon toolbar; in ATLAS.ti Mac, click on “Options” and select “Normalize.”
In addition to this, you can also view relative frequencies by selecting the options (in the ribbon toolbar in ATLAS.ti Windows; in the Options window in ATLAS.ti Mac). For example, if we want to see how much each author talked about each type of power, we can view the column relative frequencies.
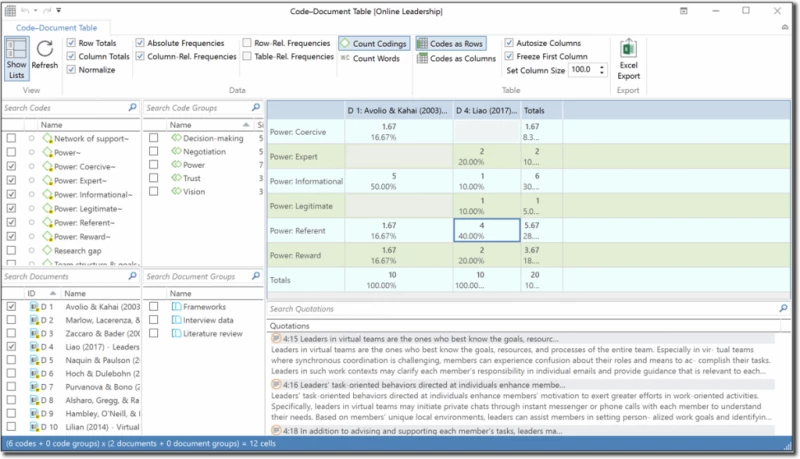
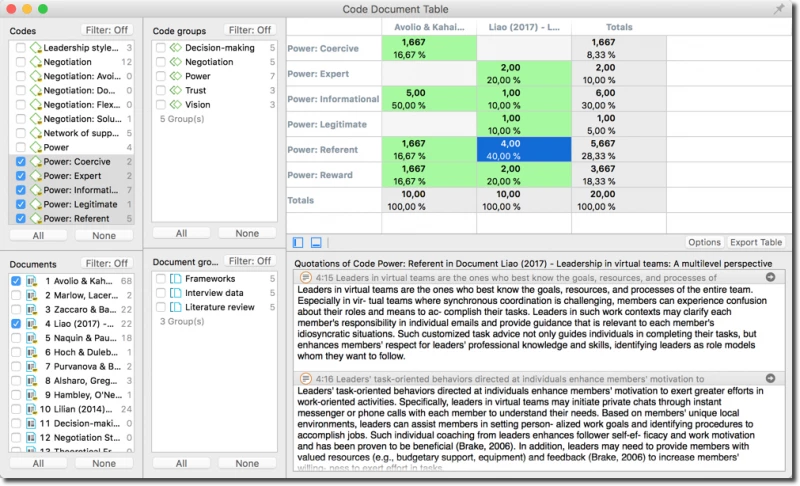
Looking at the table, we can see that 50% of the data regarding power that comes from Avolio and Kahai (2003) is about informational power. On the other hand, 40% of the data regarding power that comes from Liao (2017) is about referent power. Thus, you can choose whether you want to see the relative frequencies of the data in the columns, rows, and/or whole table (you can select one, two, or all three options to view them in the table at the same time).
To save this table, just click on the “Export” button, and ATLAS.ti will open up the table directly in Excel. ATLAS.ti will export whatever information you currently see in your Code-Document Table (i.e., if you have included column relative frequencies, those will also be exported to Excel). From Excel, you could easily insert a chart or graph to visually present your findings (this can be particularly helpful for presenting your results in a final paper or presentation!).
So, this example here is a pretty straightforward comparison, as we can see how much each code was used in each document. Perhaps now would be a good moment to open a memo, and write our reflections and interpretations of this result; for example, it is interesting to note that Liao (2014) talks more about referent power while Avolio and Kahai (2003) talk more about informational power, why might this be? Is it because they conducted studies focusing on that particular type of power? Or do they think that that particular type of power is more important for online leadership? We can write out our ideas, and then we can easily look through the corresponding quotations to discern whether our interpretations make sense: Does the interpretation fit the data, or is there a better way to explain this trend?
Let’s take a look at one more example. We also conducted interviews with online leaders, and now we want to compare between our findings from the literature review and from our interviews. We have grouped all the documents from the literature review and all the documents from the interviews, so now we can directly compare between these two groups of documents. Similarly, we have grouped all of the “power” codes into one group, and we grouped all the codes of the other dimensions of online leadership we are analyzing. Now let’s see how much of our findings on all the dimensions of online leadership come from the literature review and interview data. So, this time around, we are going to select our corresponding code groups and document groups.
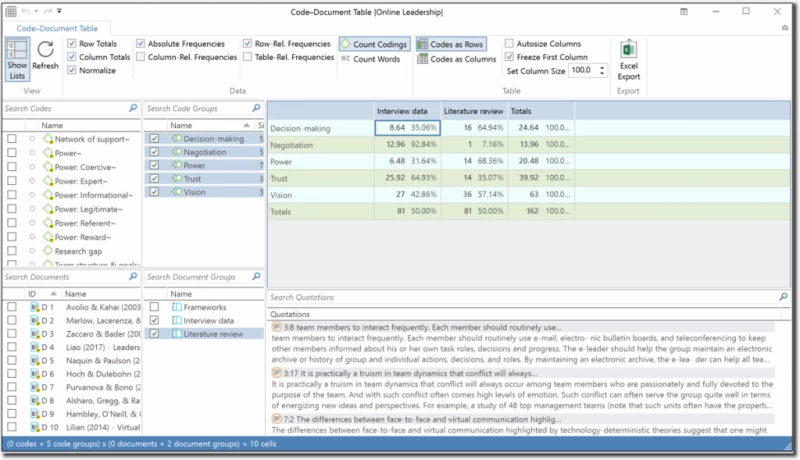
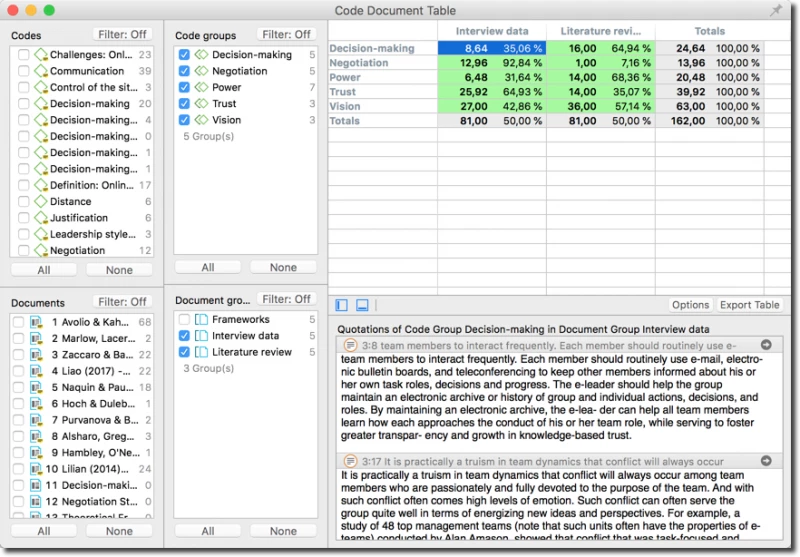
Now, let’s open up a memo and write our reflections. For example, while participants talked a lot about how online leaders negotiate, it is very surprising to see that so little information about negotiation is present in the literature review – Could it be that there is a need for more scholarly research on negotiation and online leadership? We could create a bar chart of these results and include these findings in our final article.
Export your table to Excel to save your results
The Code-Document Table helps us examine the frequencies of our codings. In other words, we can carry out some quantitative analyses of our qualitative data. This table is great for getting a global overview of where in our project the different codes are coming up. You can take advantage of your code groups and document groups to draw comparisons between your dimensions of interest. Making accurate comparisons across the data has never been easier: you can automatically normalize the counts and view relative frequencies. Export the table to Excel and view your results in charts or graphs. Gain insights regarding trends in your data and share your findings with others!