Getting started with ATLAS.ti

- Introduction
- Supported formats
- Guidelines for preparing data
- How to use ATLAS.ti for data management
- Backing up your data
Either you have collected data for your qualitative research study, or you are in the process of collecting data. Now you have to organize the data so that you can code and analyze it for key insights. Admittedly, project management is likely not the most exciting step in the research process. It is, however, necessary to facilitate all of the other steps that get you to your research findings.
ATLAS.ti is not just a powerful tool for data analysis. It is also a platform to manage the data collection process and make the analysis as efficient and as painless as possible. Take the time to carefully consider what your data should look like and how it should be managed in an ATLAS.ti project so you can more easily make sense of your data later.
Supported formats
As the needs of qualitative researchers have evolved, the types of data that are analyzed have increased to meet those needs. Qualitative research today is seldom just a task of analyzing text. Audio, video, and images are also relevant data, and ATLAS.ti has been designed to accommodate them all.
ATLAS.ti supports the following forms of data:
- text (including plain text, rich text, Microsoft Word, LibreOffice Writer; Evernote files and folders; and data from spreadsheets such as survey responses or social media post comments)
- transcripts (VTT, SRT, TXT, DOCX, and RTF)
- web pages (HTML files)
- PDF files (including files from bibliographic reference managers)
- images (most major formats such as JPEG, GIF, and PNG)
- audio (most major formats such as MP3 and M4A)
- video (most major formats such as MP4, MOV, and AVI)
- geographic data (from Google Earth maps)
ATLAS.ti will also convert the following data into PDF format:
- e-books (MOBI files)
- Excel and LibreOffice Calc spreadsheets
- PowerPoint and LibreOffice Impress presentations
- vector graphics from Visio and LibreOffice Draw
In addition, supplemental information such as comments in Word documents and annotations in PDF files will be converted to quotations containing comments attached to your data. In summary, ATLAS.ti can accommodate all types of data and will preserve as much of the fine-grained details in your data for analysis in your project.
Guidelines for preparing data
Qualitative data is often unstructured and may undergo some editing before it can be analyzed. Maybe you have an audio file from an interview that you have processed through an automatic transcription service. Or you might have written field notes in your favorite notebook. Or perhaps you took a picture of an important event or artifact during field work. Whatever data you collected and however you collected it, you may need to edit it to create a clear structure and remove any identifying information to maintain confidentiality.
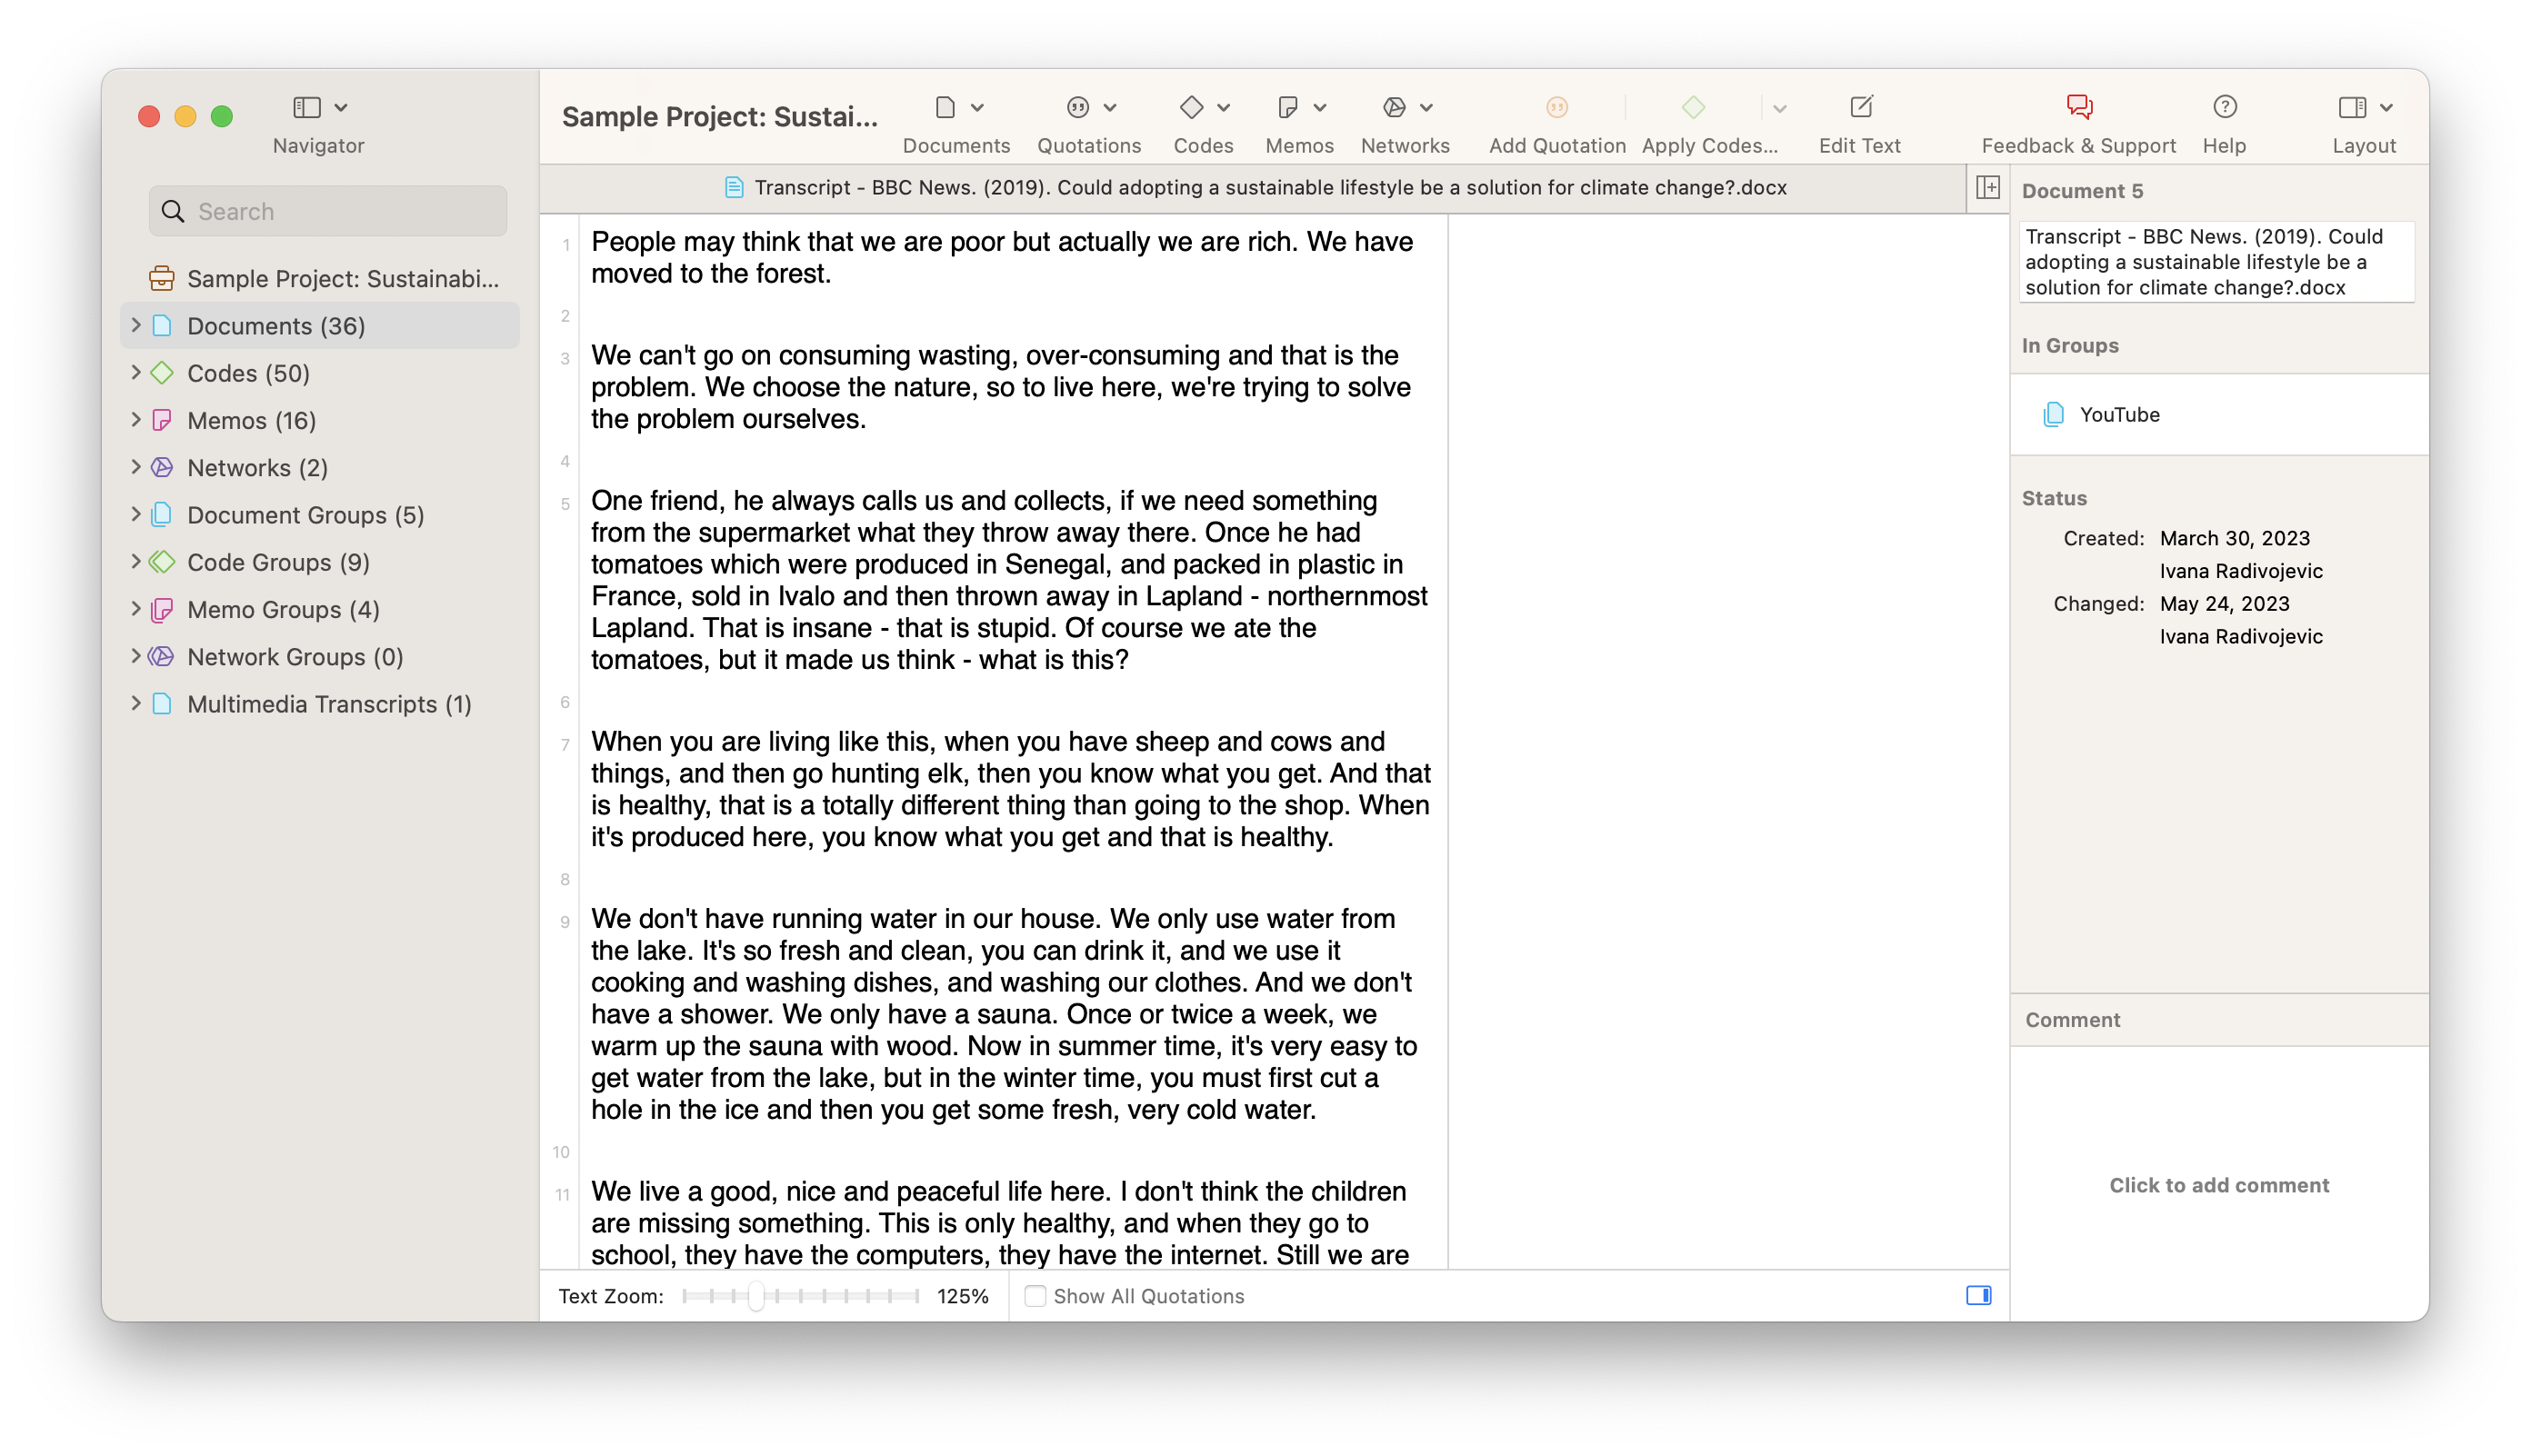
Consider a simple text document like in the screenshot below. We’ve taken this document from one of ATLAS.ti’s sample projects on the topic of sustainability. The text is divided into paragraphs that represent different sections of a text based on the video this transcript comes from. On the one hand, the shape of the document is easier on the eyes, as people seldom sustain their attention while reading one unnecessarily long paragraph. On the other hand, it is always useful to revise any transcript of video or audio data to ensure the accuracy of the transcription.
Now look at a screenshot of an interview transcript. Most standardized transcripts follow a simple pattern of identifying the speaker and then what they say.
While this may sound elementary, these seemingly minor characteristics actually have important implications for how data can be analyzed and coded in ATLAS.ti.
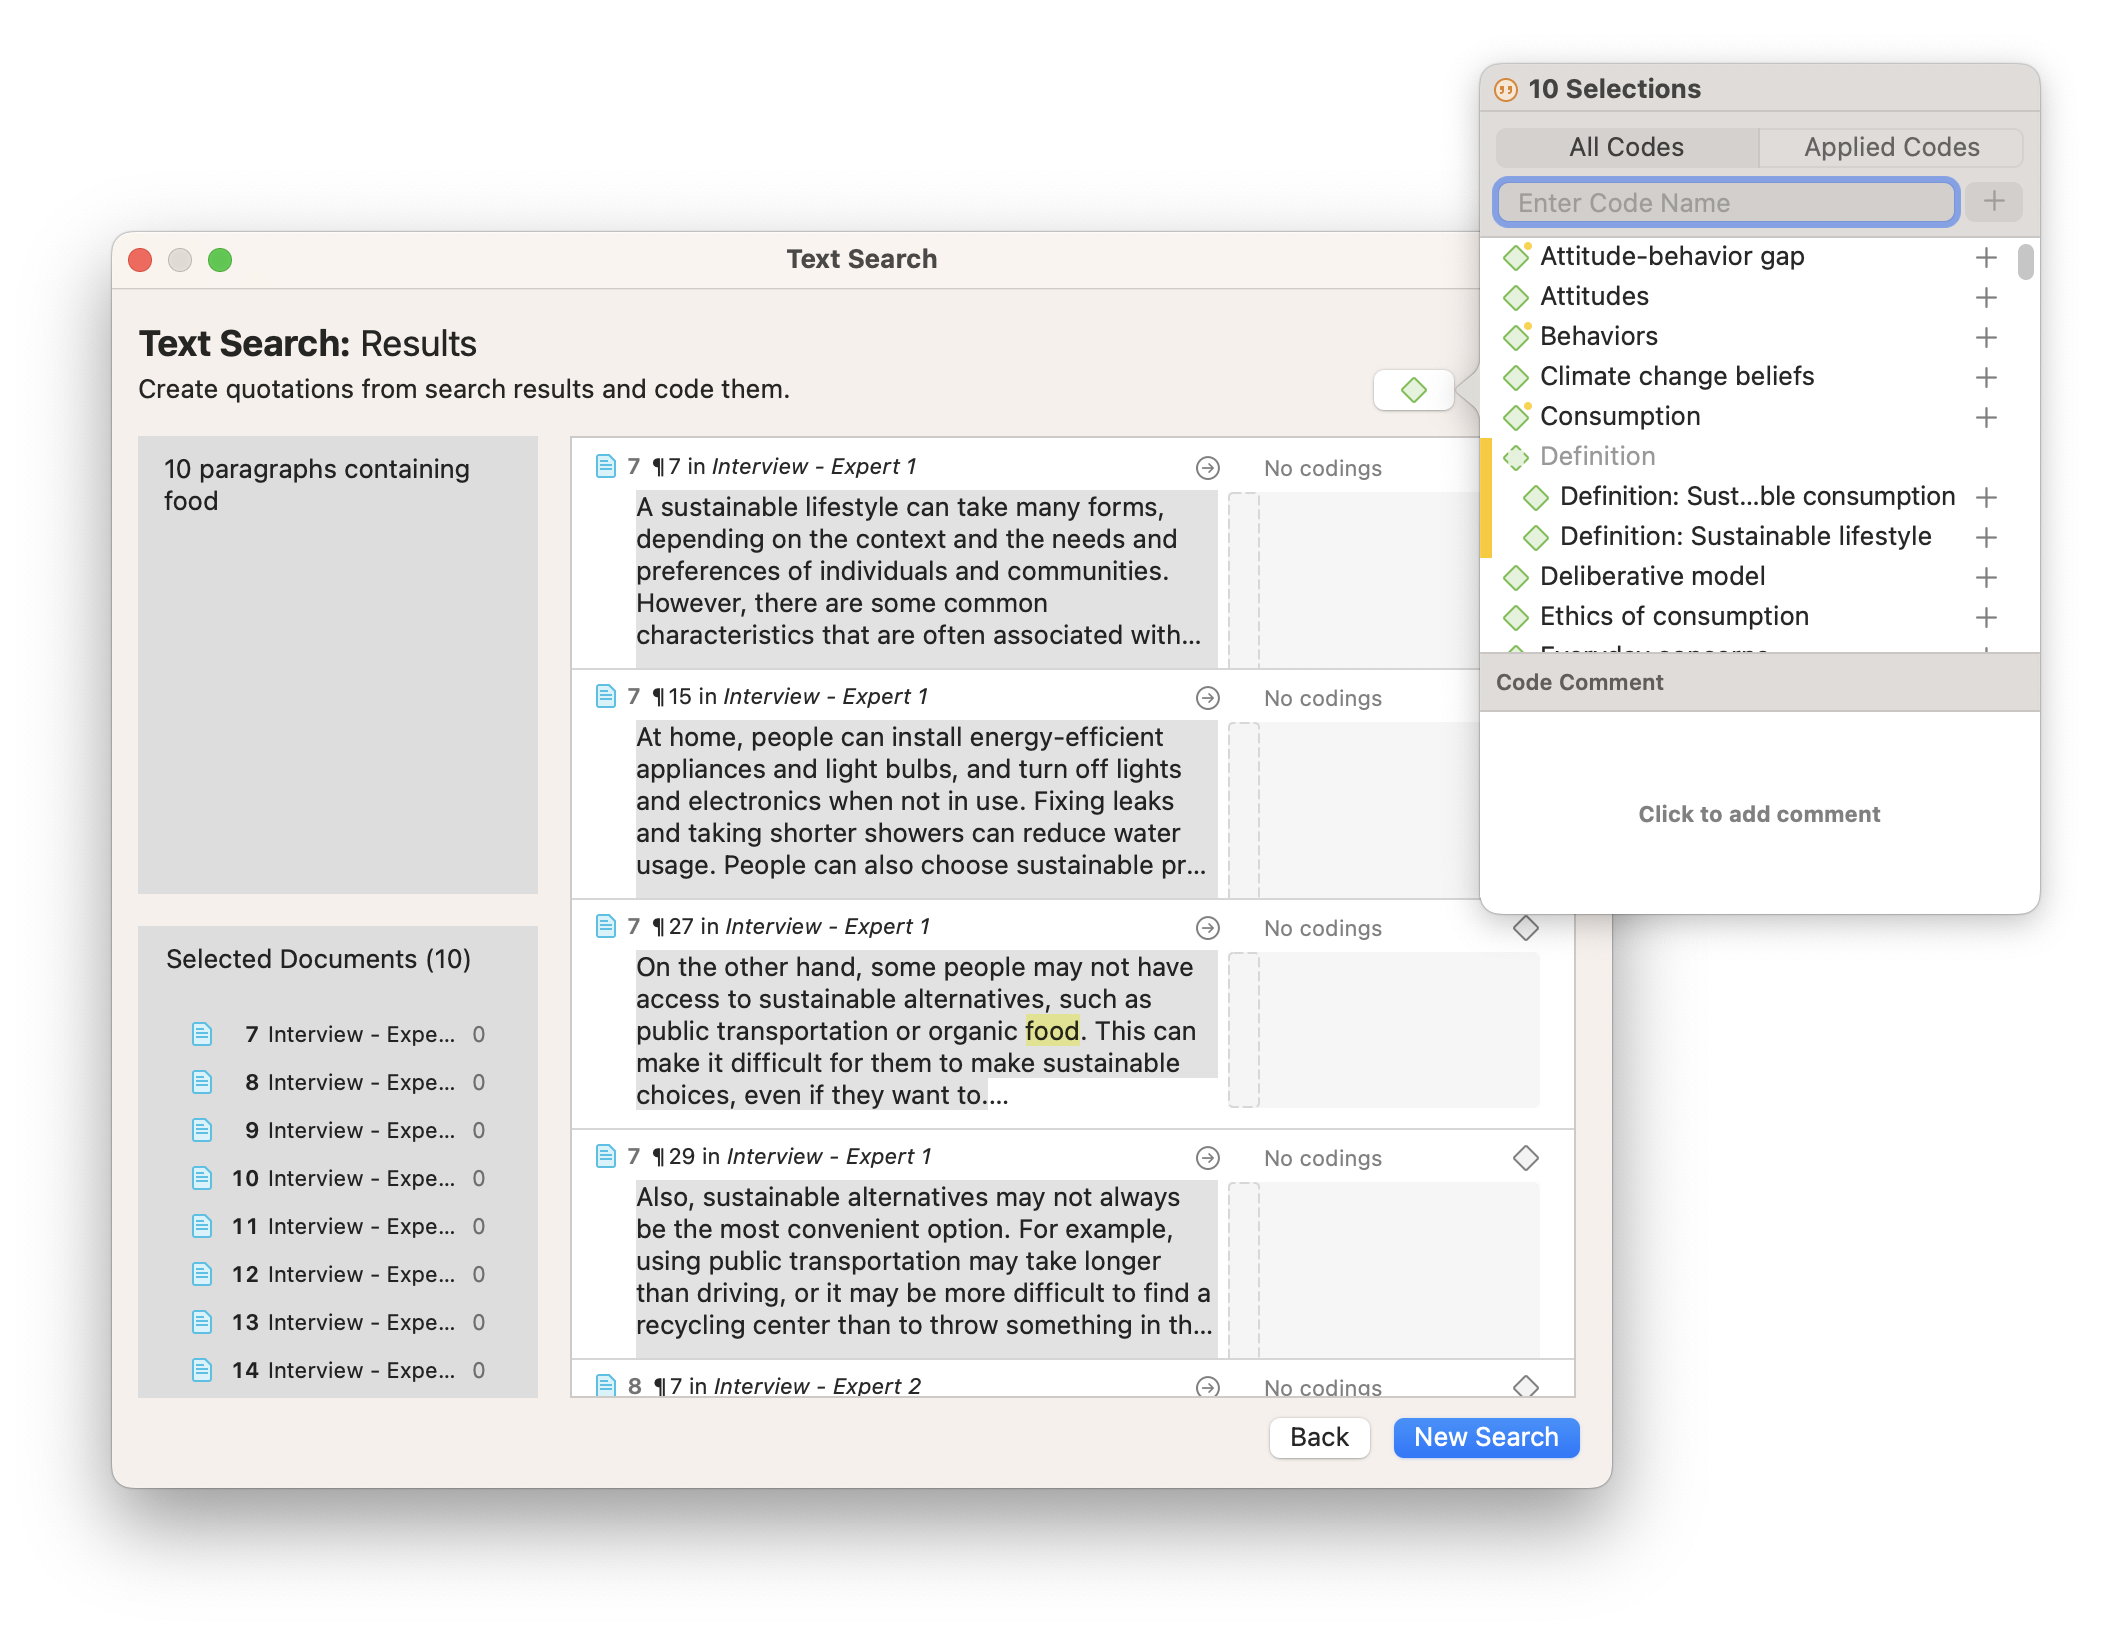
The Text Search function, for example, allows you to seek out data segments containing a word or phrase you’re looking for. These segments are easily listed for you in one place for easy coding. You can define the scope of the data that you can code with this tool, whether it is exact matches, sentences, or entire paragraphs.
As for transcripts from interviews and focus groups, it might be a challenge to sift through pages of transcripts when you only want to look at what a particular respondent says. The Focus Group Coding tool takes that headache away by parsing transcripts and creating quotations labeled by codes representing the different speakers. With this tool, you can analyze a particular code belonging to a specific speaker, filtering out all other voices and their associated data.
With these tools and other tools in ATLAS.ti in mind, think about what your documents should look like before adding them to your project. Do you need to edit the names of speakers in a transcript? Do you need to add more line breaks to a body of text? Do you need to change particular words in your data so you can search for them in ATLAS.ti?
A helpful practice is to work backwards. ATLAS.ti has a set of sample projects that you can use to test the various tools and functions of our software. Feel free to play around with all of the different capabilities and then consider how you could organize your raw data. Regardless of what software you use or what tools you employ, you will undoubtedly need to organize your data to provide a more efficient structure for analysis. Doing so early on will save you significant time later in the research process.
How to use ATLAS.ti for data management
With your data prepared, it is now time to add your documents to an ATLAS.ti project so you can code and continue to analyze your data. This part of the process also requires you to consider how the organization of your project is connected to your research goals. Of course, you could just dump all your documents into a project and code right away. But some careful planning at this point is also useful.
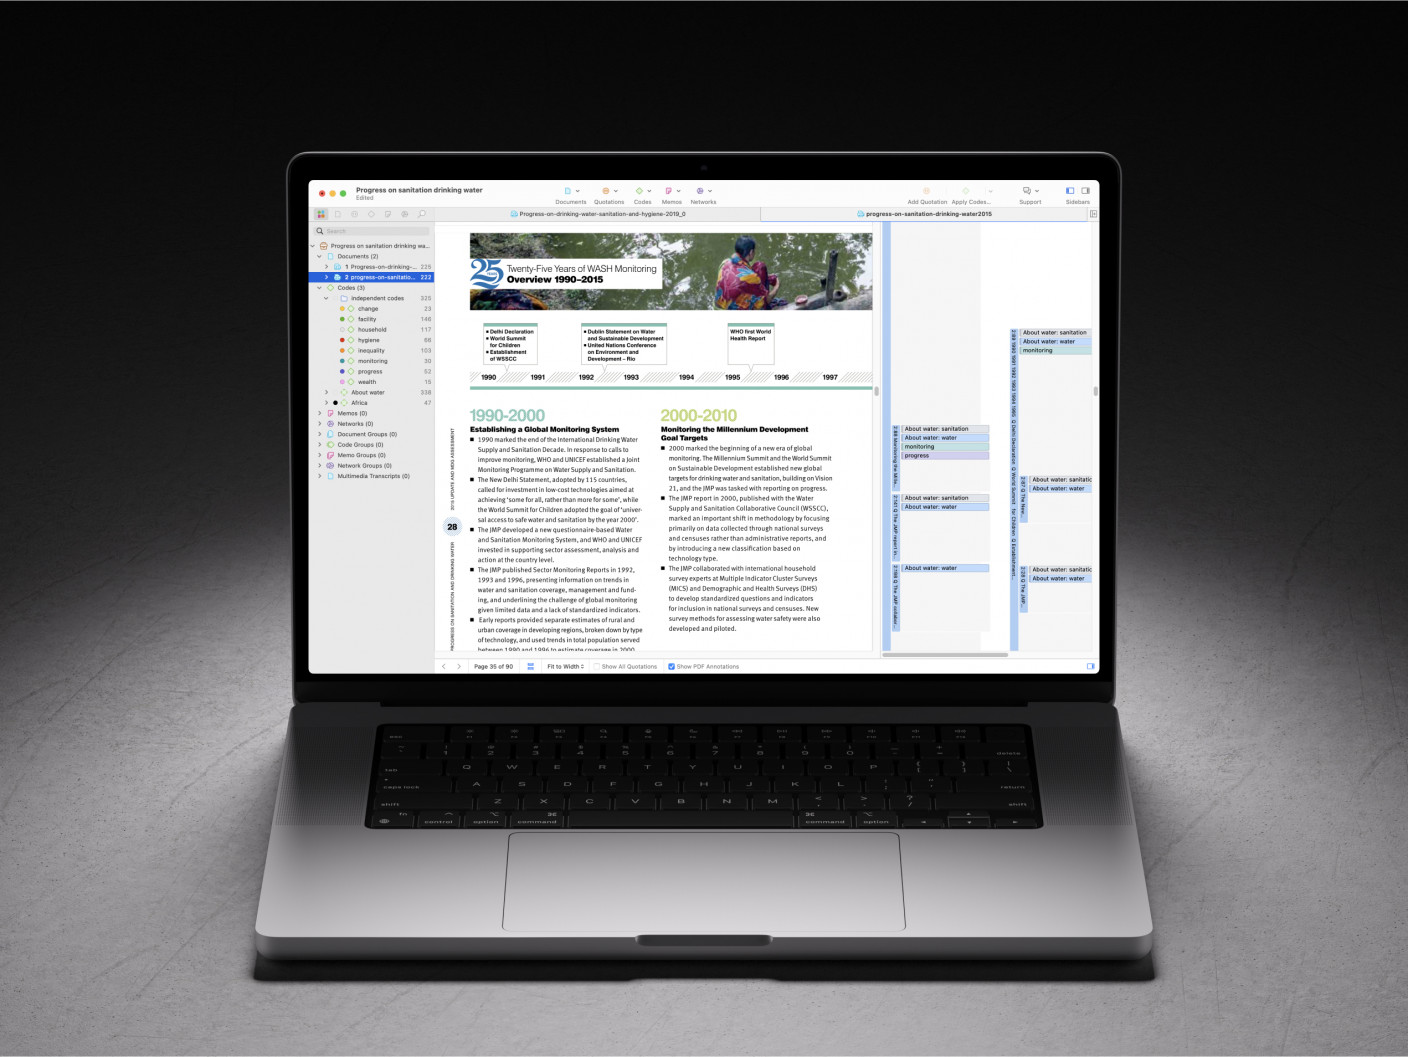
Looking at the Document Manager showing all of the documents in the Sustainability sample project, we can see the name of each document, a comment attached to each document, and the document groups to which each document belongs. All three aspects are beneficial to keeping your project data organized and easy to analyze.
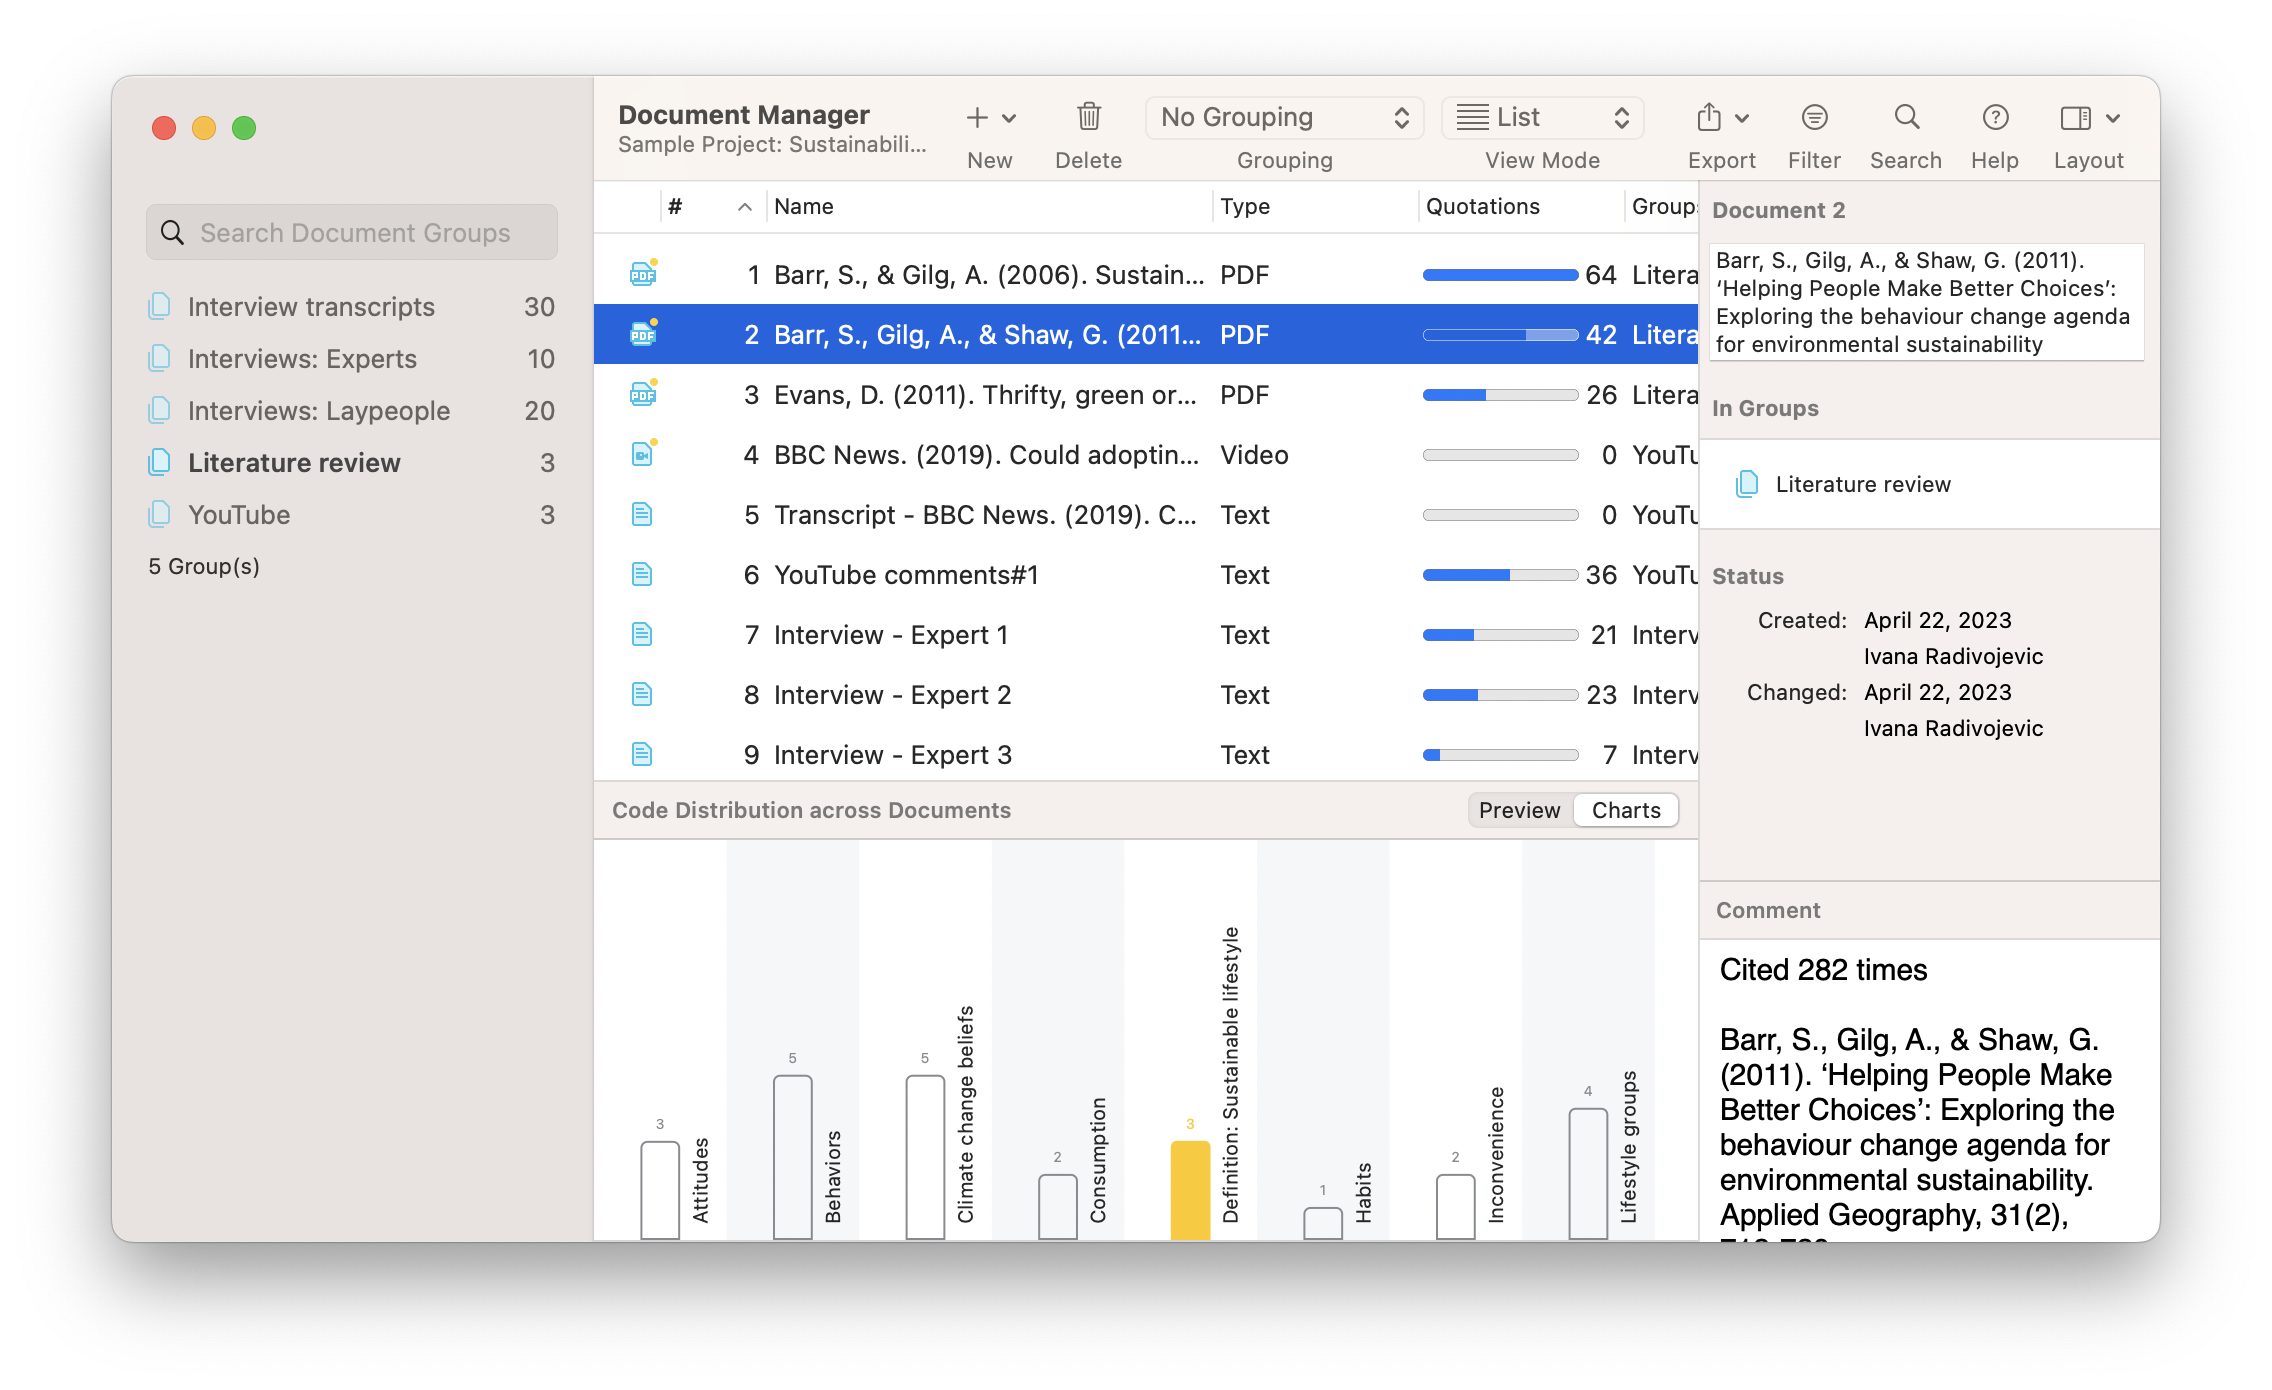
First, the naming convention you employ for naming your documents is entirely up to you. Some rely on code names to keep names short (e.g., IT_090622 for “interview transcript from September 6, 2022”) while others prefer to be as descriptive as possible. Whatever strategy you employ, make sure that you keep your names consistent and clear. Particularly if you have a project containing dozens or even hundreds of different documents, having a standard strategy for applying names to your documents will save you time by helping you retrieve the relevant data quickly and easily.
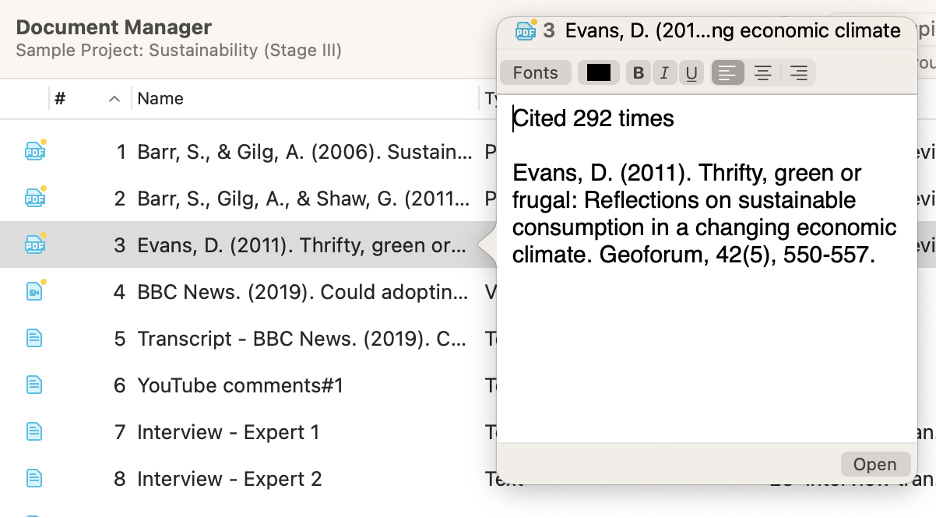
There will also be times when the names don’t help you. After all, one interview is going to blur into the next if you’ve done 30 or 40 of them! Sometimes, you need a bit more reference to quickly determine if you’ve chosen the right document. This is why ATLAS.ti provides a space for a comment associated with each and every document in your project. It’s up to you to decide what belongs in each comment. It could be a formal reference for the source, a quick explanation of the data, some notes on a possible theoretical development stemming from analysis of the document, or any other identifying information that makes it easy for you to recall what’s in your data. Like names, comments are displayed next to each document in Document Manager, or can be displayed by opening them through the chosen document’s pop-up menu.
Finally, projects of all sizes benefit from grouping documents together, whether by data type, theme, time period, or any other characteristic that suits your purposes. For this need, document groups in ATLAS.ti are useful in helping you sort your data.
In the screenshot below, you will see that we have numerous interviews, but we have created two different document groups to separate the experts from the laypeople that we interviewed. After all, an expert on sustainability is bound to talk about the subject in a different manner than would a layperson, so it might be useful to analyze the differences later on.
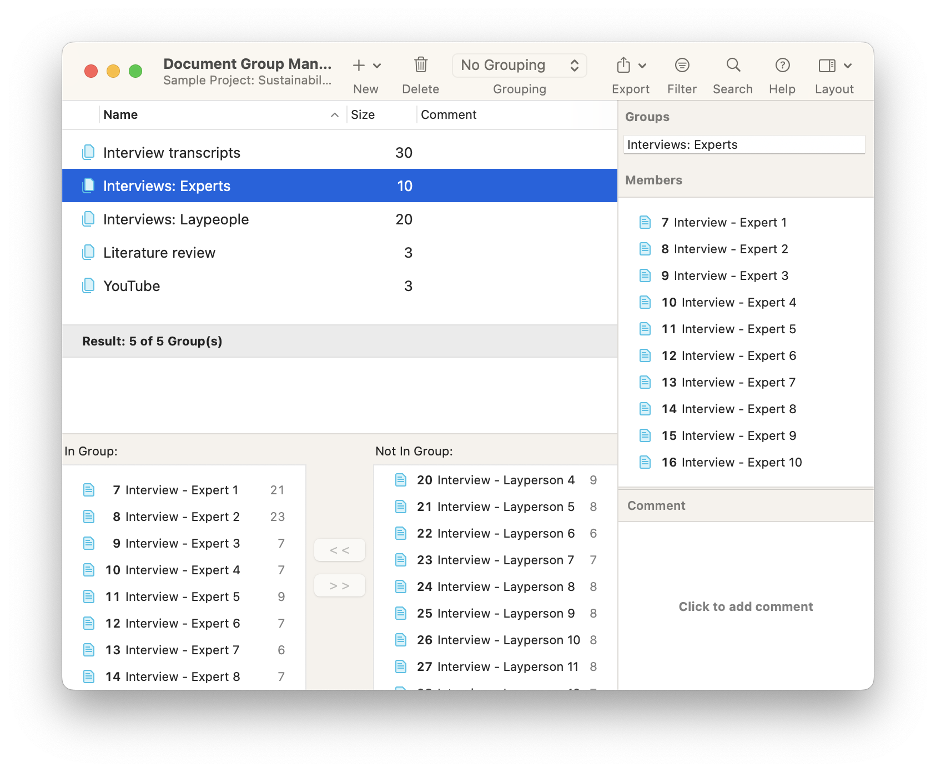
Documents can be sorted into multiple groups, giving you freedom to assign as many identifiers to a document as you feel necessary. For example, you can benefit from having a separate group for each relevant identifier (e.g., gender, age group, ethnicity, place of birth, etc.), allowing you to narrow your analysis to a particular set of documents that match the criteria relevant to your research inquiry.
Backing up your data
Stuff happens. We’ve all lost some notes that had an interesting theoretical discussion that was relevant to our study. Or we’ve realized halfway through the data organization process that the document groups we created just aren’t useful enough for our analysis and we need to start again. Or we’ve spilled water on our keyboard and need to replace the computer where our project was stored.
For these and a million other reasons we can’t anticipate, making backup copies of our data on a regular basis is essential to our research. A backup copy is something you may never have to use (we hope!), but will be infinitely valuable if stuff does, in fact, happen.
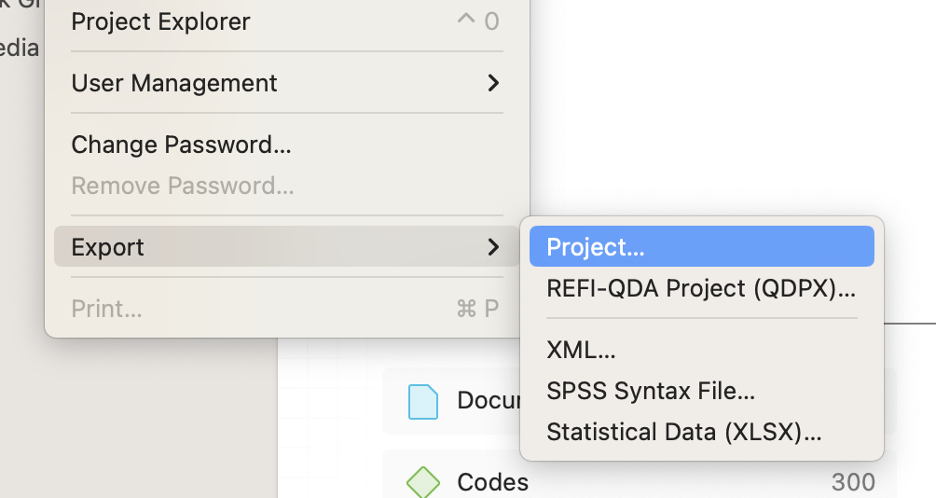
Backup copies of your project are called project bundles in ATLAS.ti, and making a project bundle is incredibly easy. In ATLAS.ti Mac, the export feature is available in the Project menu. In ATLAS.ti Windows, the export button appears when you select File in the toolbar. You can also upload your ATLAS.ti Windows or Mac project to the internal cloud storage. If you are working in the online platform ATLAS.ti Web, you can already rest assured that your project is stored online and thus not stored in any single physical device. That being said, though, it is still a good idea to regularly download your ATLAS.ti Web project to save a backup copy or maintain different versions of your project over time.
Keep a backup online, on a separate flash drive, or on another device in case you need to revert your changes. Or make backups with times and dates as names so you can have a record of how your research has developed over time. Whatever your strategy, your future self will be grateful to have a backup of your data ready in case you ever need it.