How to analyze tweets on X? A step by step guide

- Introduction
- Why is X (Twitter) data useful?
- What is the point of X (Twitter) analysis?
- What is the tool for collecting data from X (Twitter)?
- How do you analyze data from X (Twitter)?
- Using ATLAS.ti to analyze X (Twitter) data
Introduction
Twitter data analysis is a useful area of qualitative research when pursuing inquiries related to communication, culture, marketing, and many other fields. So how should you approach Twitter analysis? In this article, we'll look at social media data, how it can be analyzed, and how ATLAS.ti can be used to analyze social media.

Why is X (Twitter) data useful?
For a time, it seemed like everyone in the world had a Twitter account. A number of social media platforms have dominated the discussion over the years, but Twitter (now officially called X) is arguably the ubiquitous solution for social media users in many places in the world.

The reach of Twitter makes it an abundant resource for qualitative data collection and analysis. Different aspects of posts on Twitter can tell us a lot about how and why people communicate with one other. Social media analysis, while relatively new within qualitative research, has thus become a growing and increasingly important approach to understanding the digital social world.

Various topics can be explored through analysis of social network data:
- What is the relationship between the number of followers of politicians' social network accounts and public opinion?
- How do non-verbal language and visual communication among young people on Twitter influence language in everyday life?
- How do social network influencers interpret the total engagements from their posts when determining how to interact with their following?
Ultimately, the potential for research inquiry has grown significantly thanks to the proliferation of social networks like Twitter, requiring a thoughtful consideration of the best strategies for social media analysis.

What is the point of X (Twitter) analysis?
When interpreting data from tweets, analysis can look different from that of data from more traditional methods like interviews or observations. If you think about conversation analysis or discourse analysis, for example, there are non-verbal cues such as gestures or facial expressions, or other non-verbal utterances such as thinking words or repetitions to consider.
Twitter data, while having some visual and aural elements, is primarily textual in nature. Even the visual elements in tweets are different from visual elements in face-to-face communication, particularly when memes and emojis take the place of facial expressions and physical positioning.
In addition, Twitter analytics include likes, retweets, tweet impressions, follower growth, and other metrics that researchers and laypeople alike use to make interpretations about how people use Twitter to communicate. Taking these metrics into consideration requires researchers analyzing data both qualitatively and quantitatively.


What is the tool for collecting data from X (Twitter)?
Social media research is much more than importing Twitter data into your research project. As with any qualitative research, the best qualitative data analysis software has the tools to provide structure to your data to facilitate the identification and elaboration of key research insights.
Typically, this involves coding data to summarize larger sets of meaning into short but descriptive labels. But with a large number of tweets that you potentially need to incorporate into your research, a robust software package should also help process massive amounts of data quickly and efficiently, automating the coding process as much as possible while still allowing the researcher to thoroughly and transparently review the data structure.

How do you analyze data from X (Twitter)?
Researchers can analyze Twitter data in a number of ways depending on their research question and available data.
Thematic analysis
One of the more straightforward forms of qualitative data analysis, thematic analysis looks for recurring patterns across a data set. When data cannot be quantified, a thematic approach can identify the qualitative features of a particular discourse on social media.
Thematic analysis can look at several features specific to Twitter and other platforms. What hashtags are commonly used in conjunction with a particular topic? Are there certain emojis or shorthands used in tweets talking about a person or place? What meanings can be commonly inferred in the use of certain memes?

Content analysis
Determining which content resonates within a particular culture or subculture on Twitter is another useful research inquiry for social media. To that end, content analysis is useful for producing statistics on language employed in Twitter data to make quantitative interpretations about the patterns within the online discourse.
One of the unique features of social networks is the use of hashtags to organize information by topics. Content analysis is an ideal approach for generating statistics based on how frequently certain hashtags are used over others.

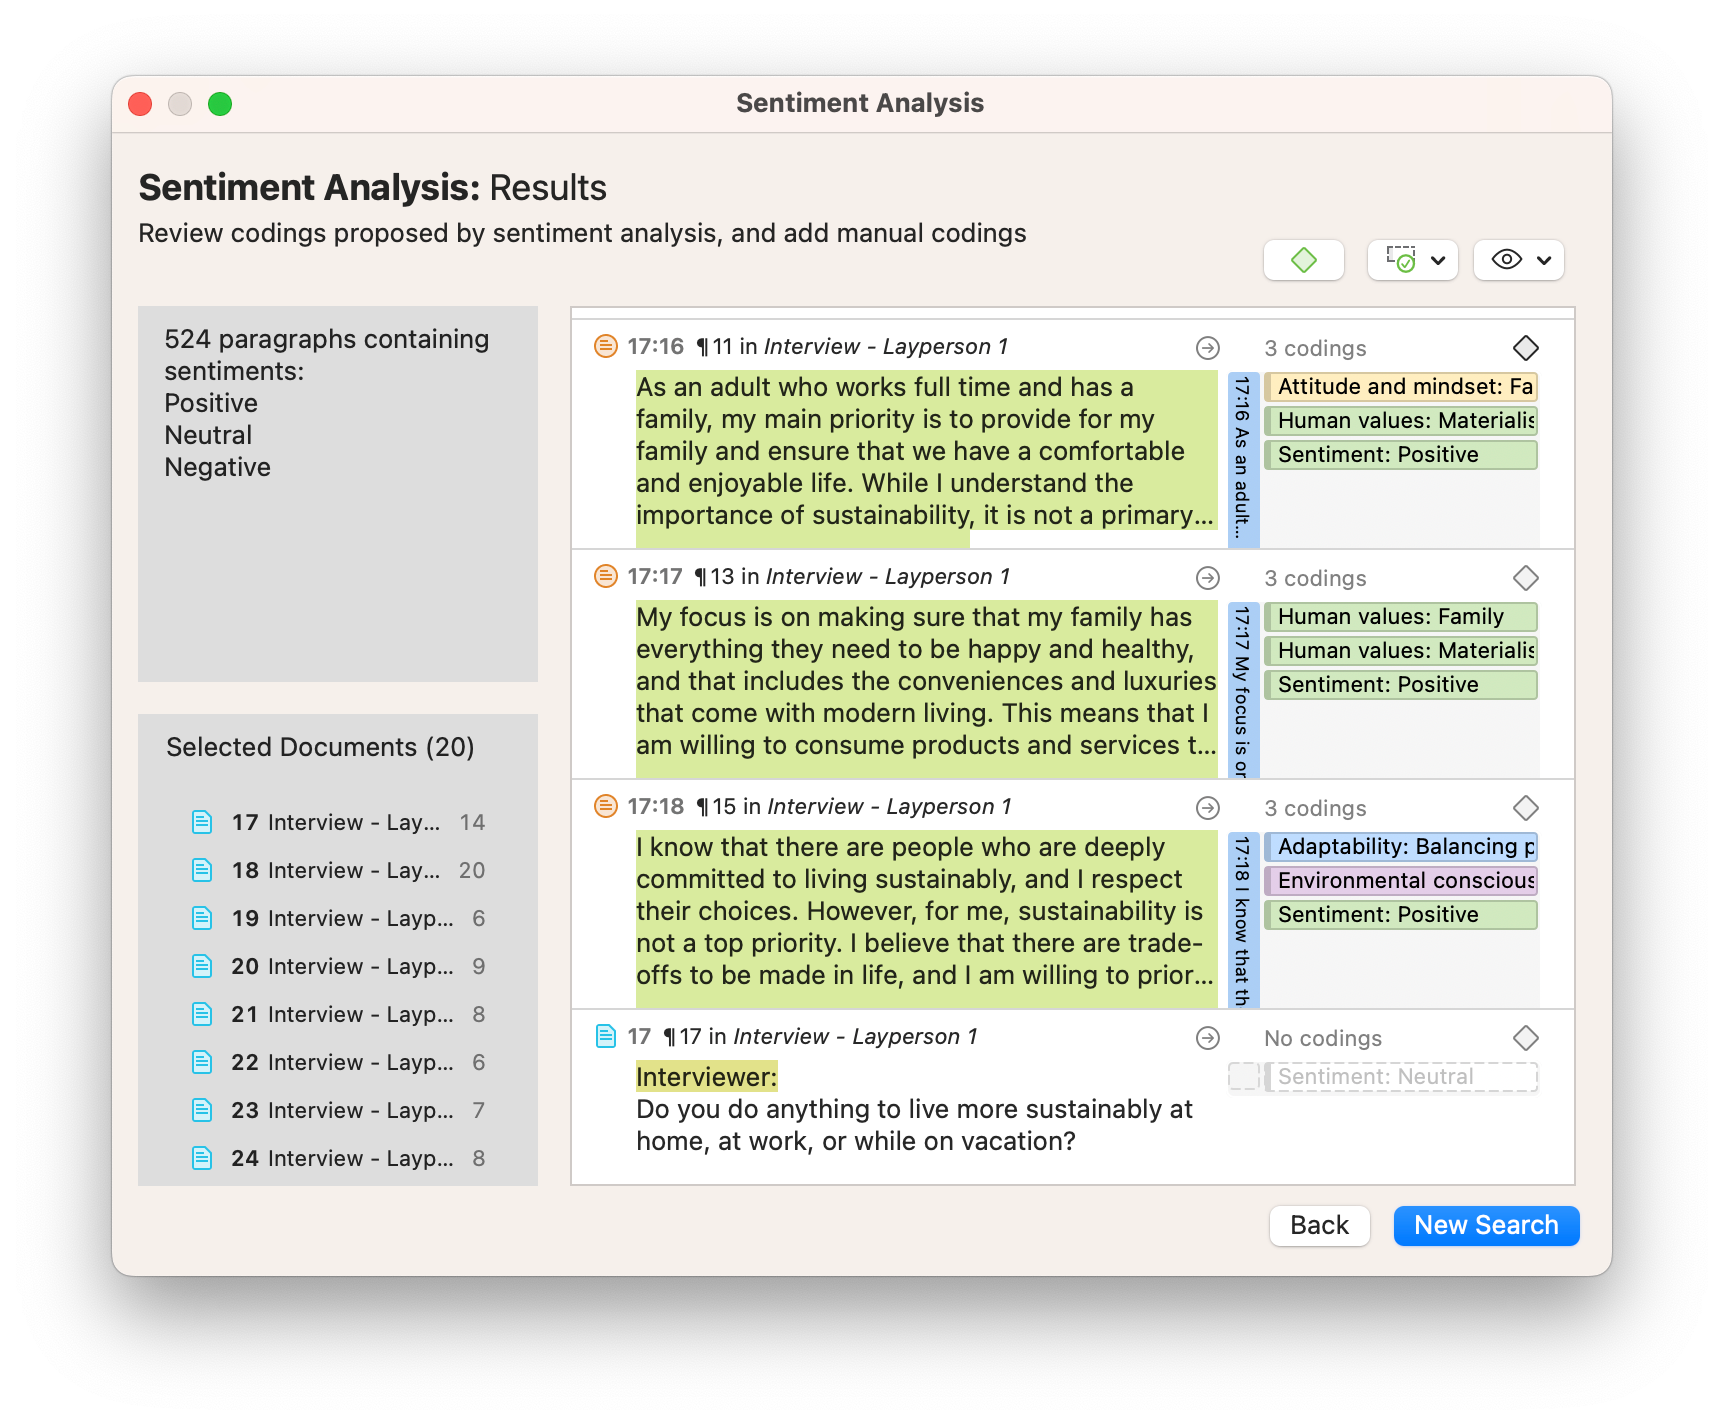
Sentiment analysis
Researchers perform sentiment analysis when they want to analyze positive and negative comments in social media. Words not only have a meaning but a nuance and emotion typically attached to them (think about how "happy" is usually associated with positive things, though in certain contexts it can bear different connotations such as sarcasm). Researchers can filter tweets to determine differences in how people communicate depending on their sentiments.
Discourse analysis
When you look at only tweets, you can get a sense of how Twitter users speak and communicate with each other. Discourse analysis looks beneath the meaning of words to allow researchers to interpret the intentions and effects of tweets and engagements.

Twitter analytics
Beyond the content of tweets, an analytics approach to interpreting Twitter data can be useful for uncovering further audience insights. Think about the following questions and how they might be useful to understanding social media culture:
- How many tweets within a certain community are retweeted?
- What are the audience demographics for a particular hashtag?
- How many tweet impressions are considered viral?

Using ATLAS.ti to analyze X (Twitter) data
Qualitative data analysis software like ATLAS.ti makes it easy to analyze any form of data, including data from social media. In this section, we will look at how ATLAS.ti can be used to analyze Twitter data.
Importing Twitter data
The most straightforward way to include tweets in your project is to copy and paste the text of tweets into a document in an ATLAS.ti project. ATLAS.ti allows you to edit your data as necessary so you never have to disrupt your coding or data organization process.
However, there are websites that can help you aggregate Twitter data and easily import data into your project. The service provided by exportcomments.com organizes tweets into a spreadsheet containing the text of each tweet as well as other important metrics such as likes, retweets, and the location of the tweet author.
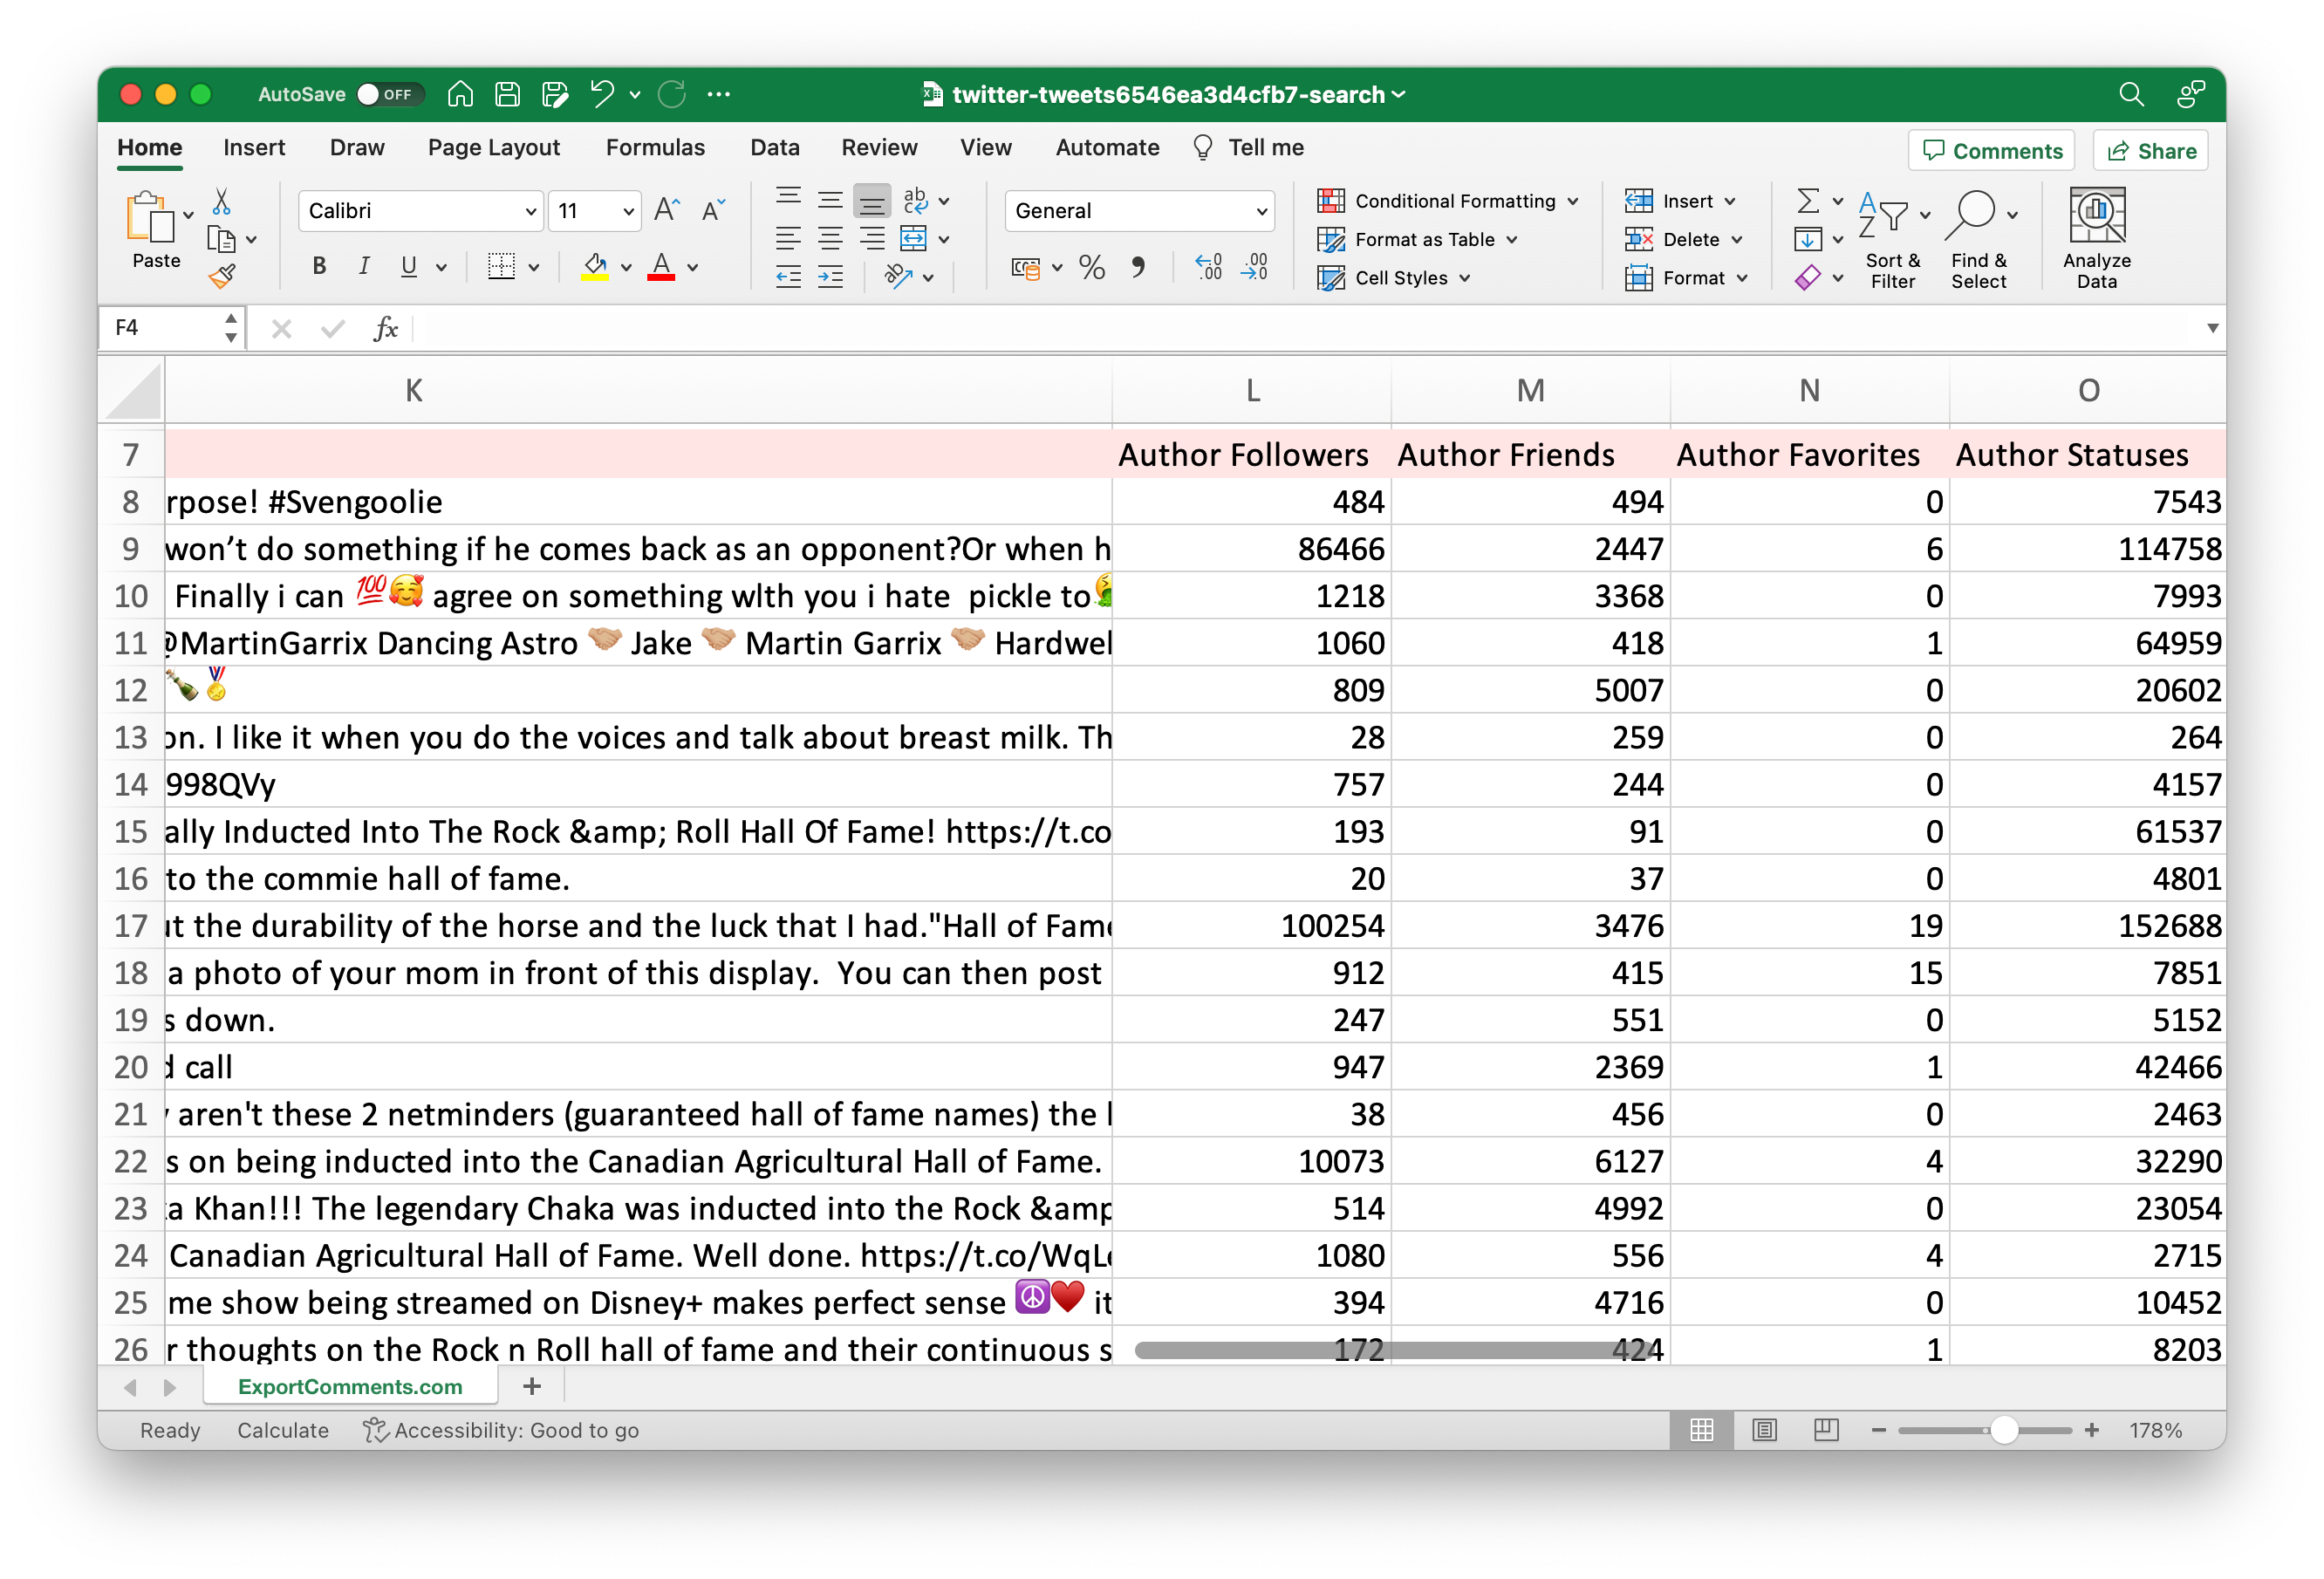
The resulting spreadsheet can be imported into ATLAS.ti using the Social Network Comments feature.
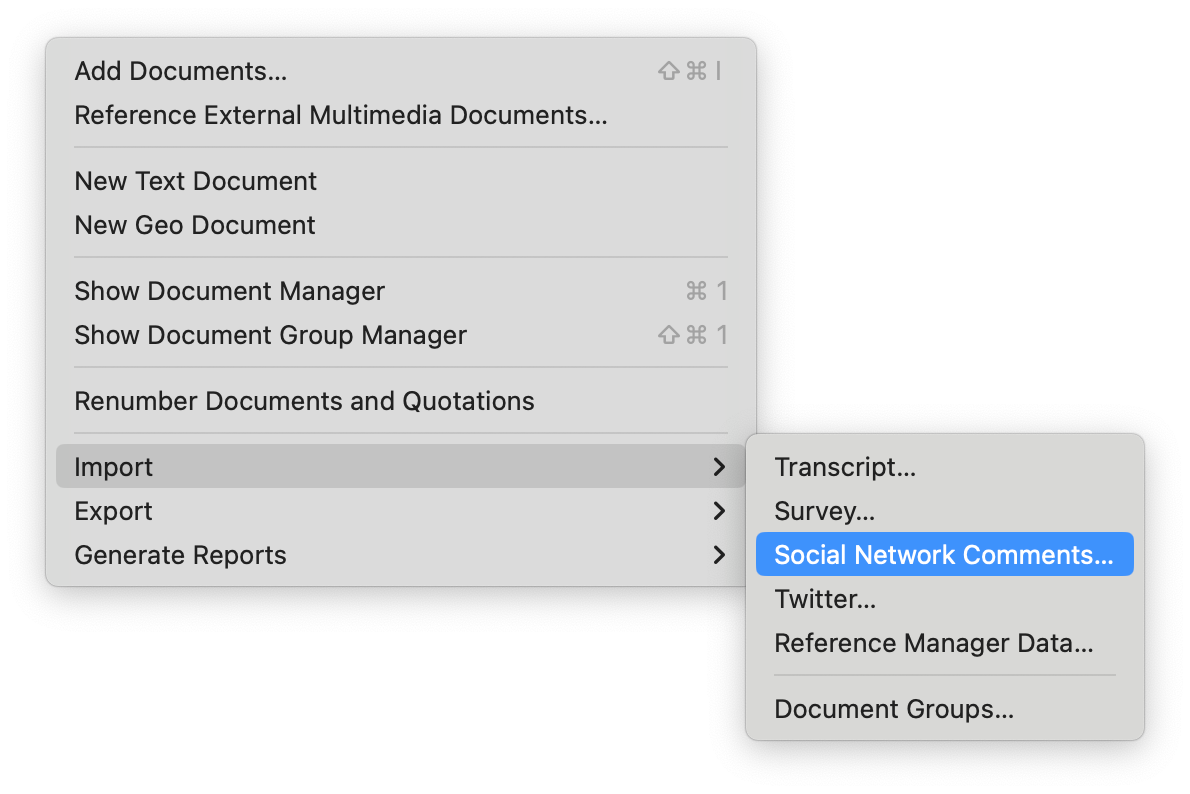
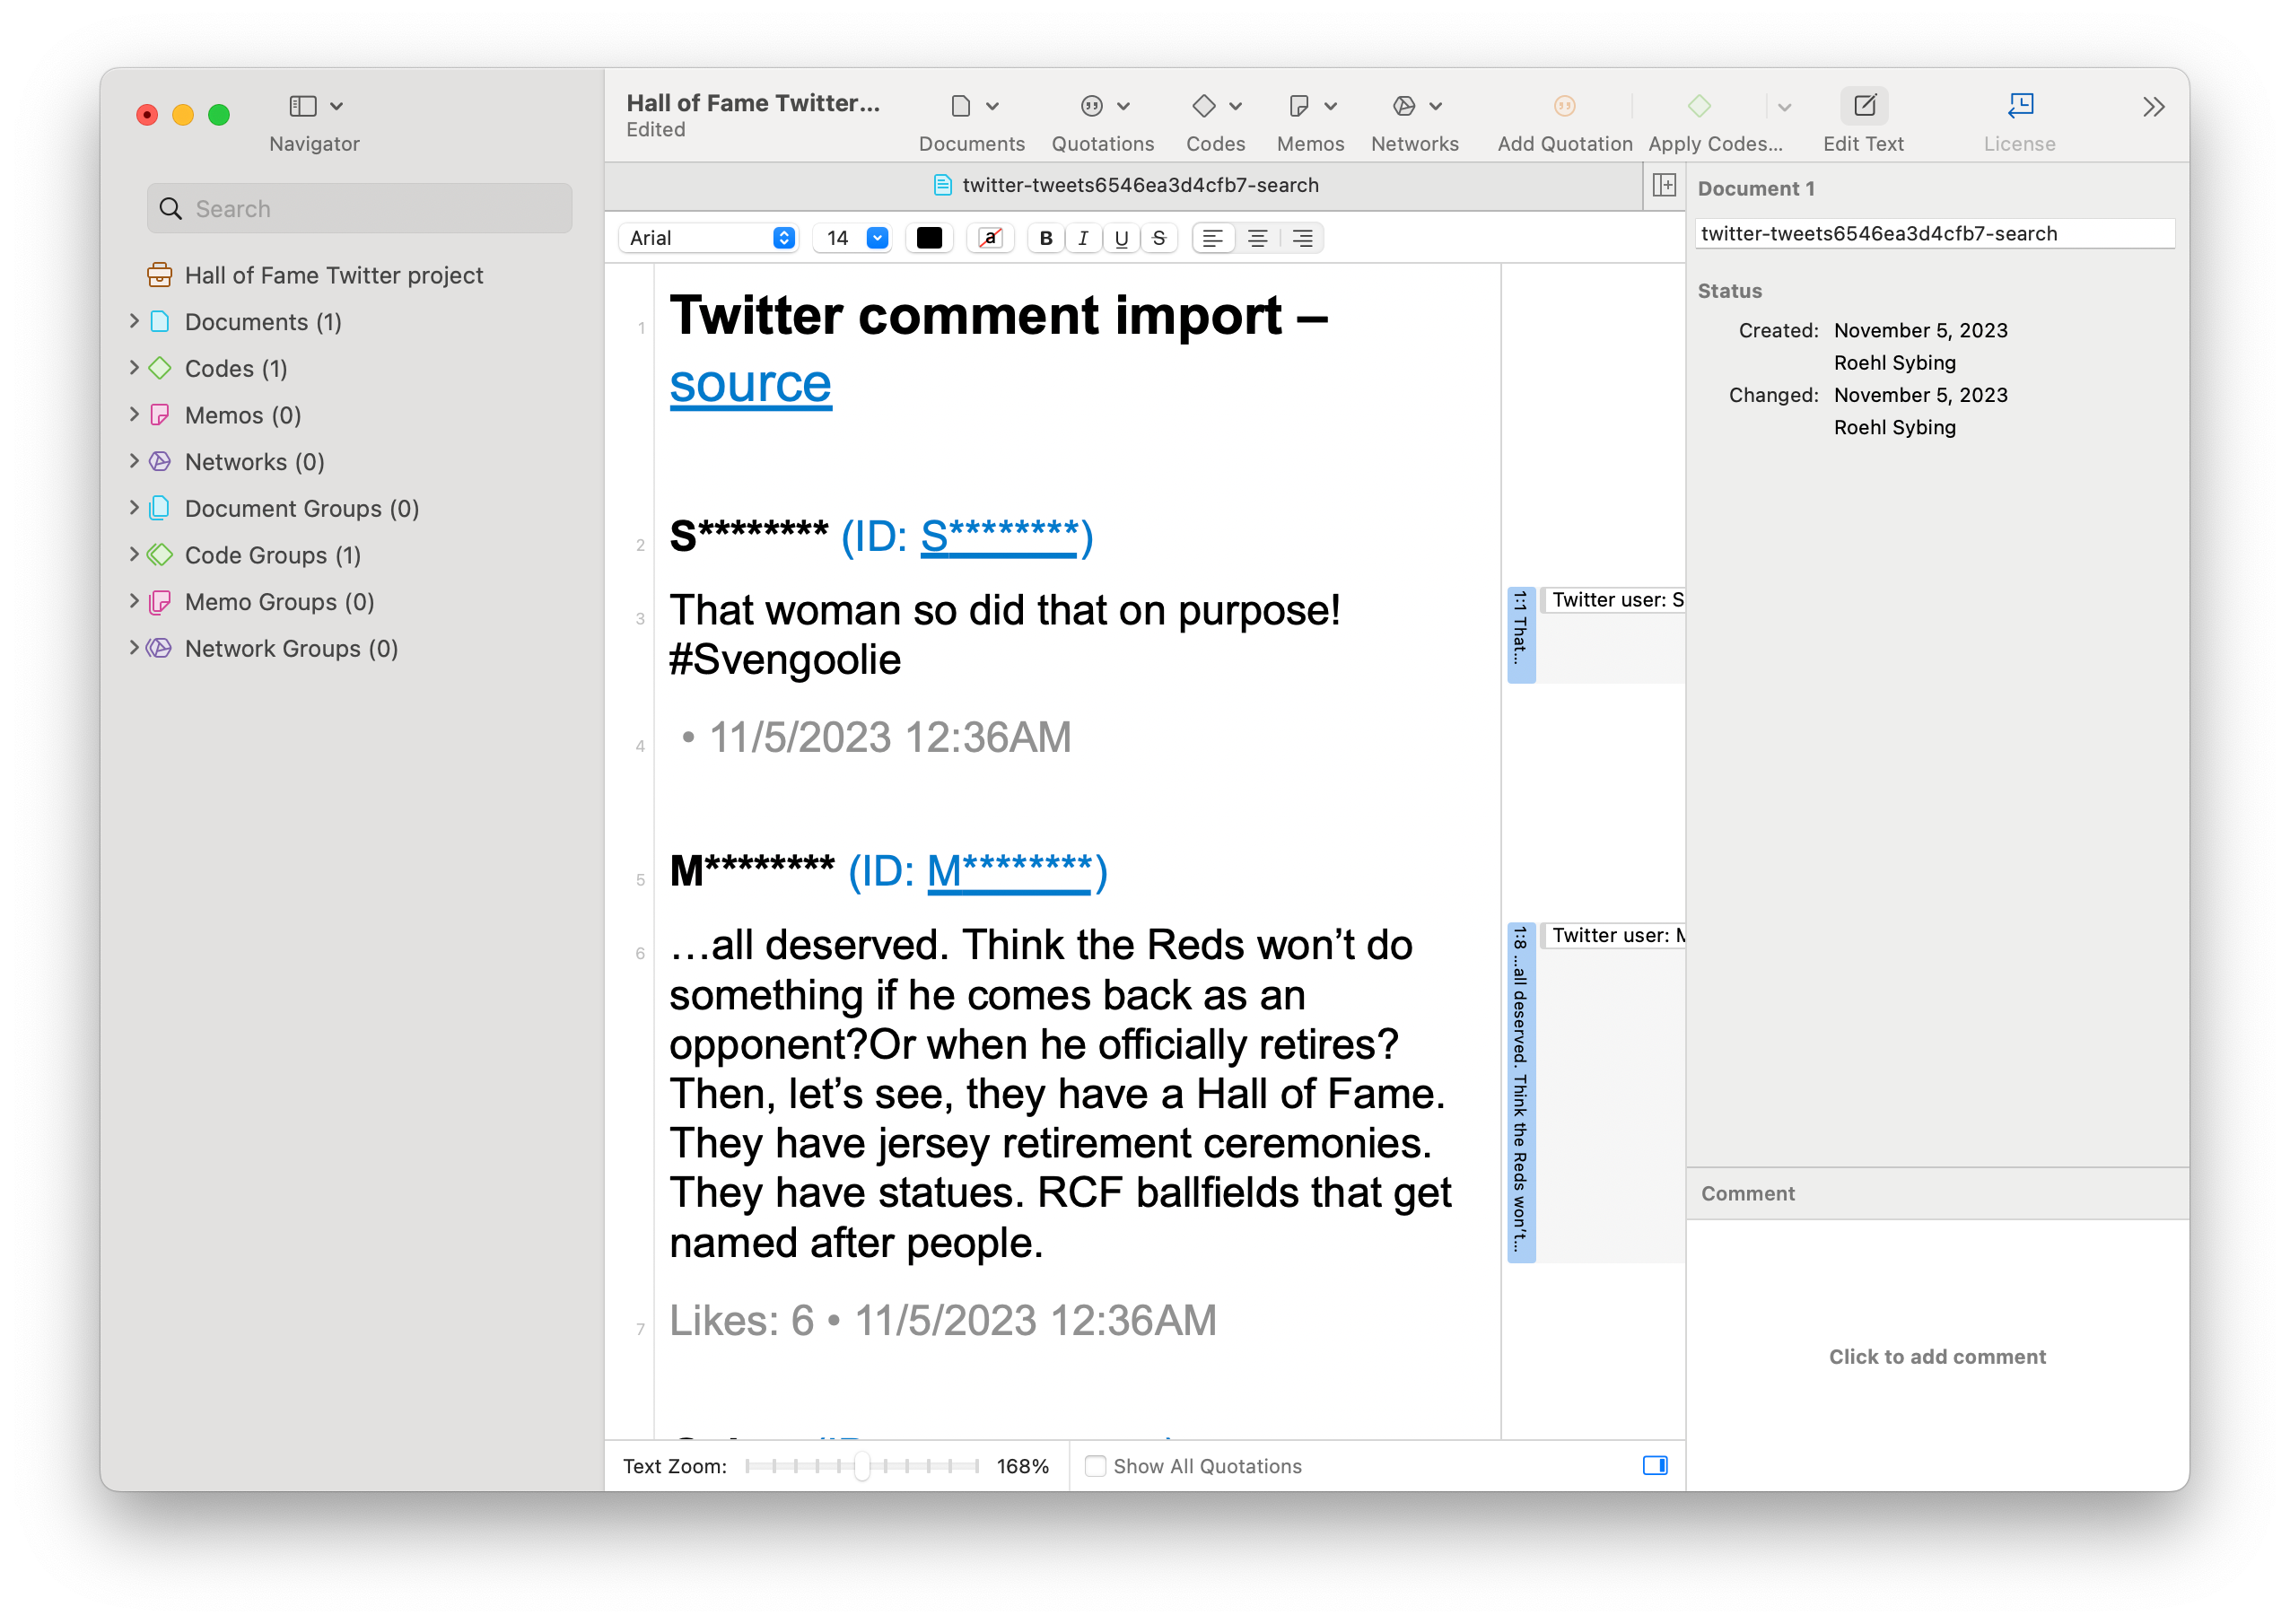
From there, ATLAS.ti takes care of the rest of the work by rendering the spreadsheet into a project document. The text of each comment is automatically coded by their author so that you can analyze what is said as well as who says it. Statistics for likes and retweets are also included in the document text to facilitate a richer analysis.
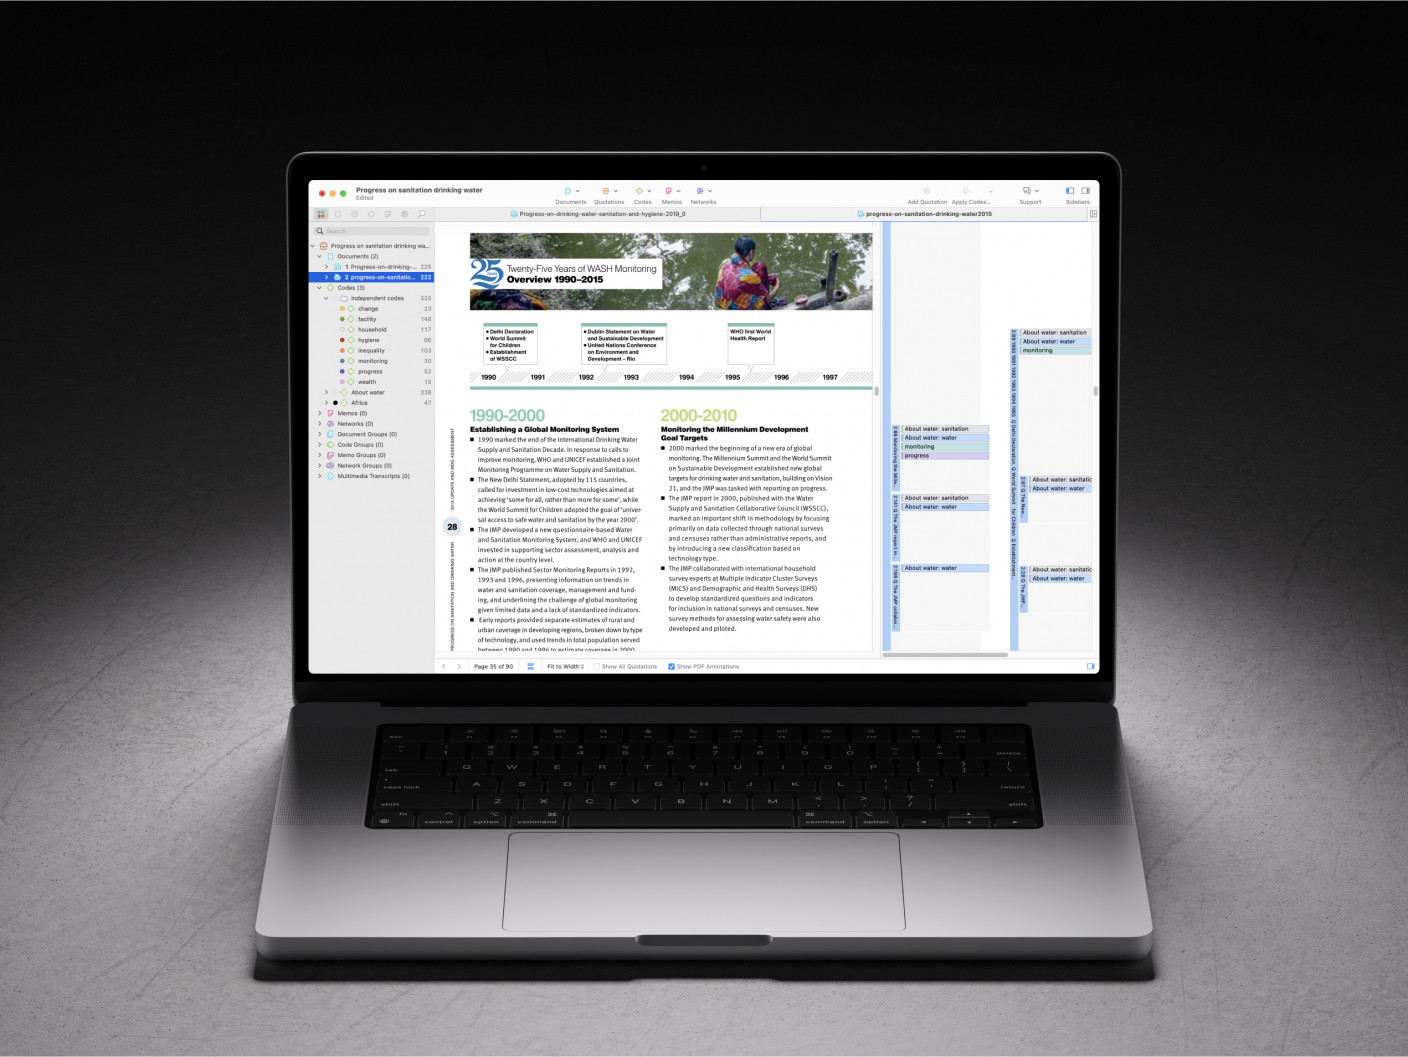
Coding data
Now that you have the Twitter data in your project, the next step is providing the structure for analysis by way of coding. Codes representing post authors are already provided by the Social Network Comments tool, but the task now is to summarize tweets with codes that capture other relevant aspects of the data, such as common topics or emerging themes.
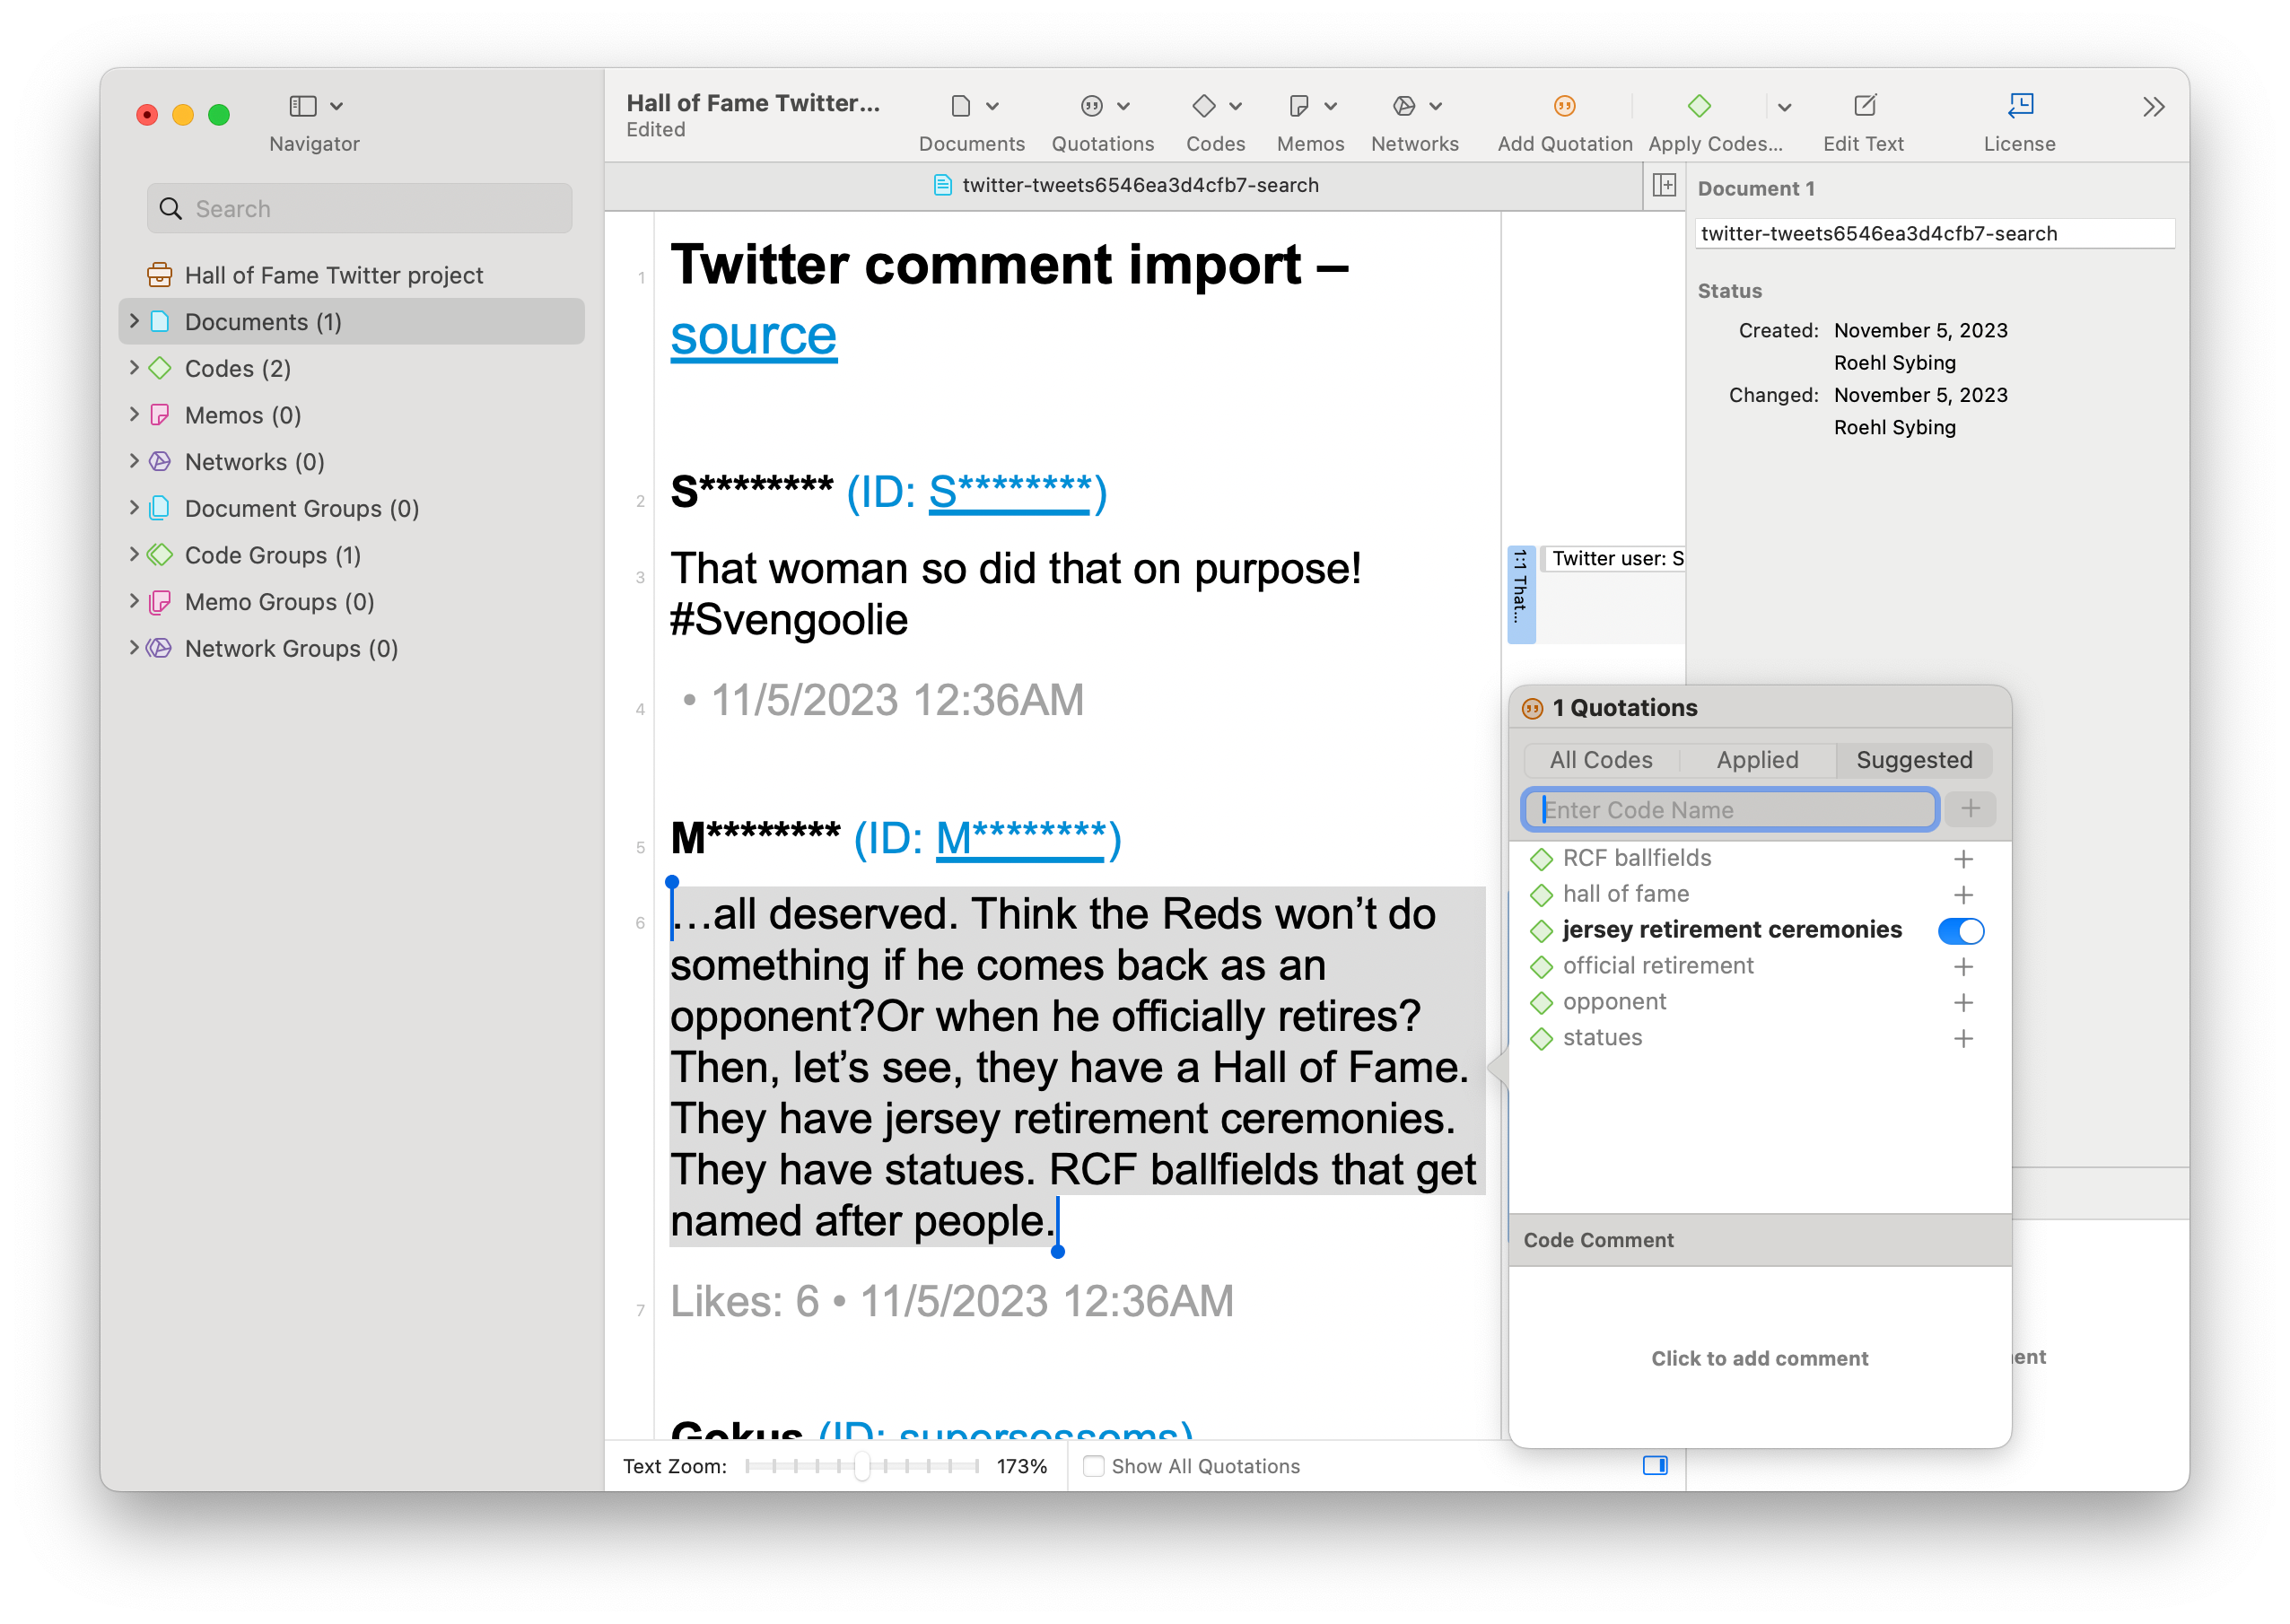
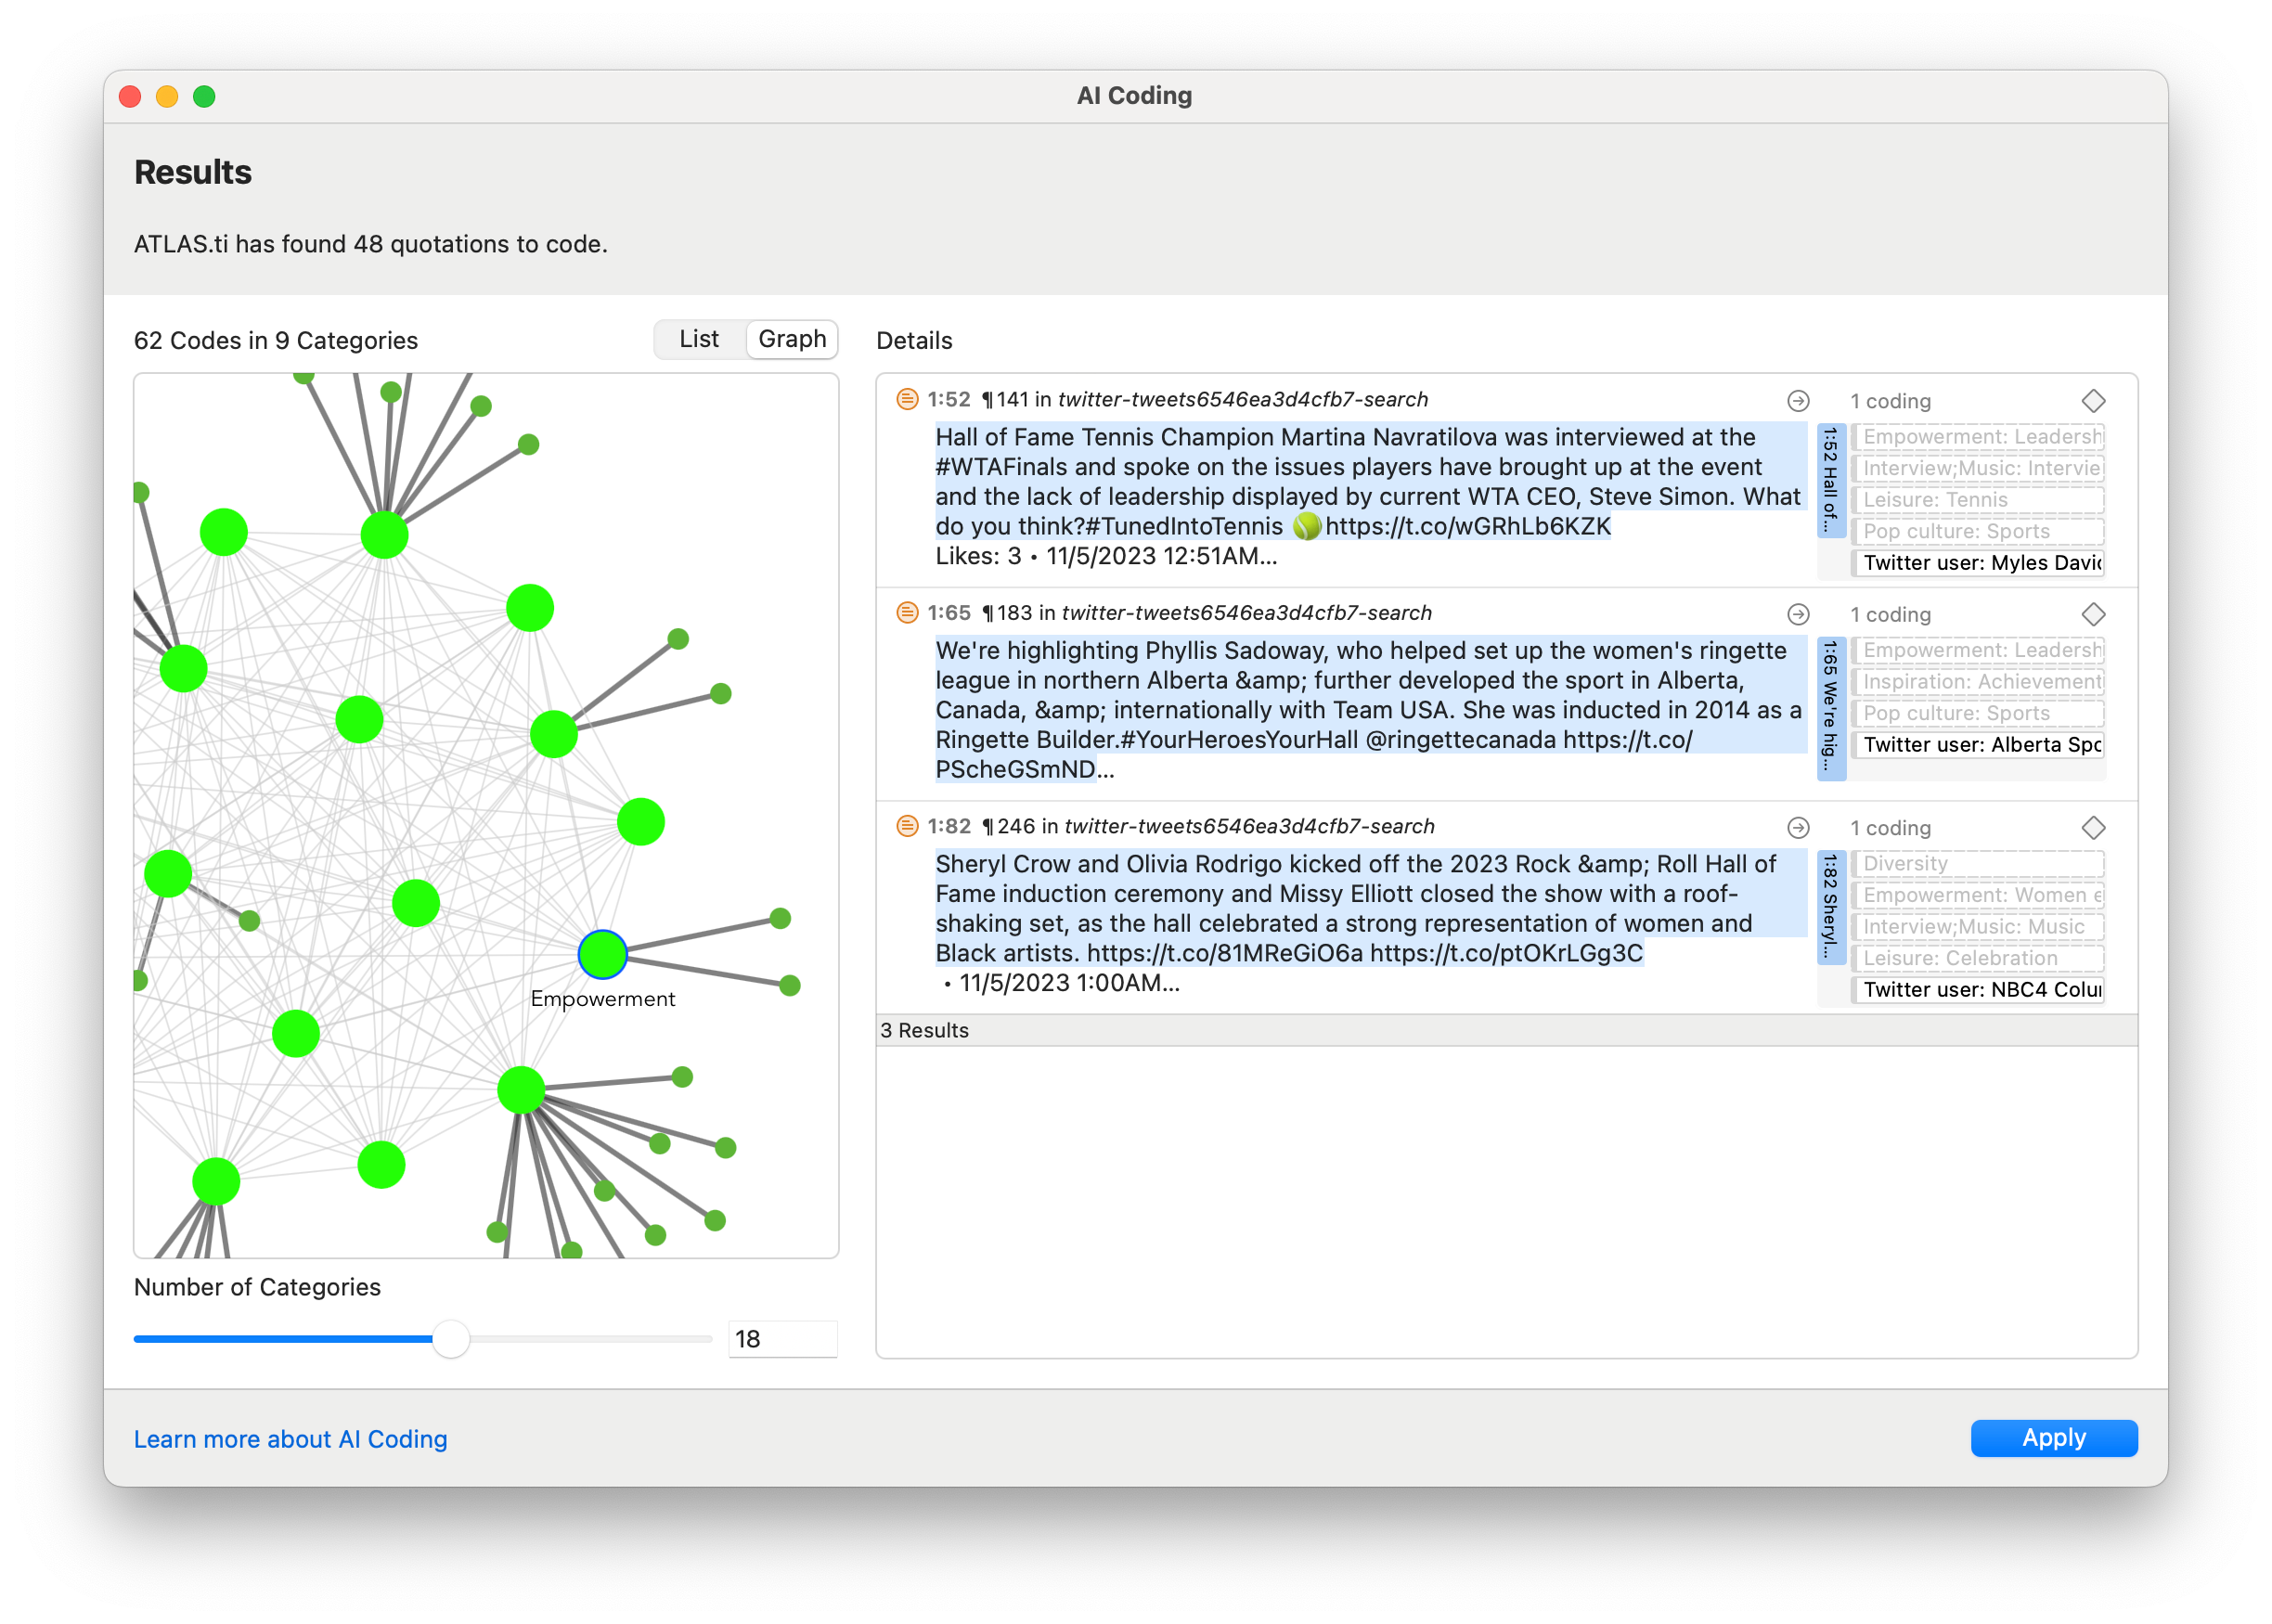
In addition to manually coding data, several tools in ATLAS.ti such as AI Coding and AI Suggested Codes facilitate coding by utilizing advanced language models to automatically apply descriptive codes and suggest codes you can use for each selected segment of text. As a result, you can potentially code a large number of tweets with the use of artificial intelligence to understand trends and patterns within social media at scale.
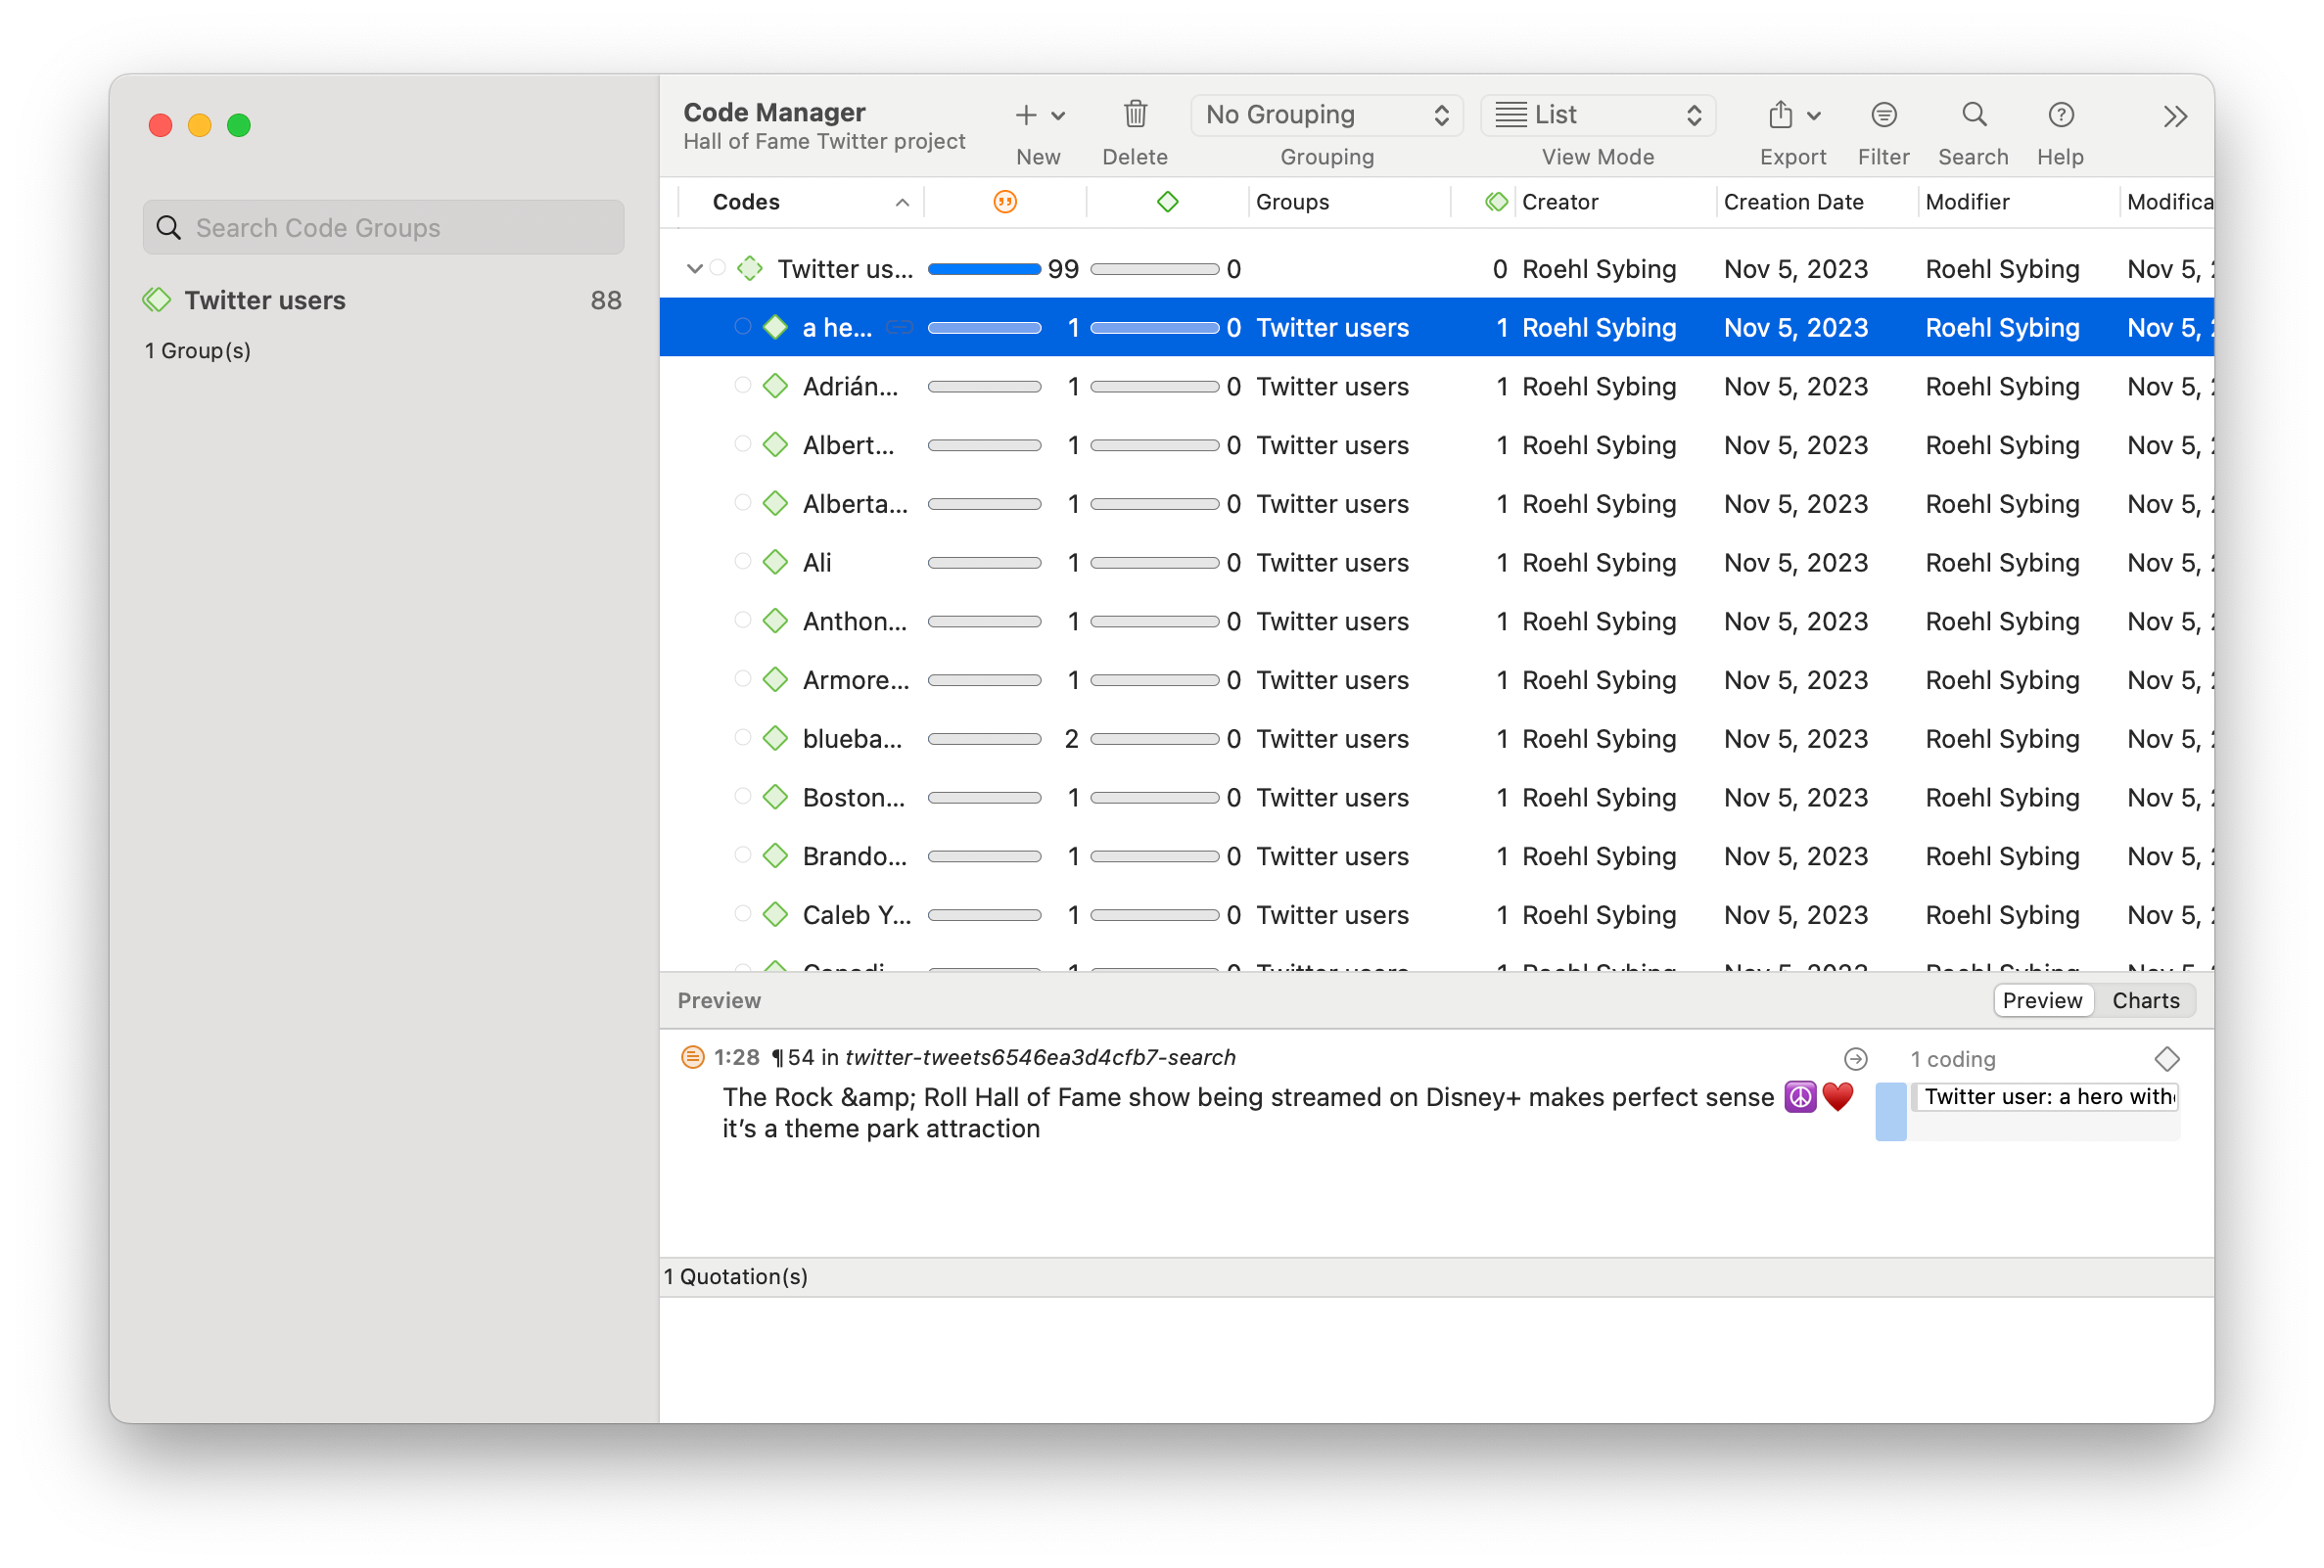
Analyzing data
Drawing meaning from codes is a simple task in ATLAS.ti with features such as the Code Manager and Code Co-Occurrence Analysis. The Code Manager displays all your codes and which ones appear the most often (as a list, cloud, bar chart, and TreeMap), and you can re-organize your codes into broader categories and themes. Code Co-Occurrence Analysis can provide a useful bird's eye look of how different interpretive codes applied to your tweets are related to each other (as a table, bar chart, Sankey diagram, or force-directed graph display).