ATLAS.ti – The ideal alternative to other QDA programs

- The Right Tool for the Job
- What's New in ATLAS.ti
- The ATLAS.ti margin area
- The ATLAS.ti Quotation
- Coding
- Coding Video Data
- Network Views / Maps / Modelers
The Right Tool for the Job
If you are searching for an alternative to MAXQDA or other Qualitative Data Analysis Software, ATLAS.ti is right for you. Compare ATLAS.ti to MAXQDA and you will see our research software offers several tools not found in other programs.
Among the key features of such tools are convenient ways to represent several competing theories and the interactive nature of building and running the models using a rigorous scenario-based language.
ATLAS.ti Windows Tour
ATLAS.ti Mac Tour
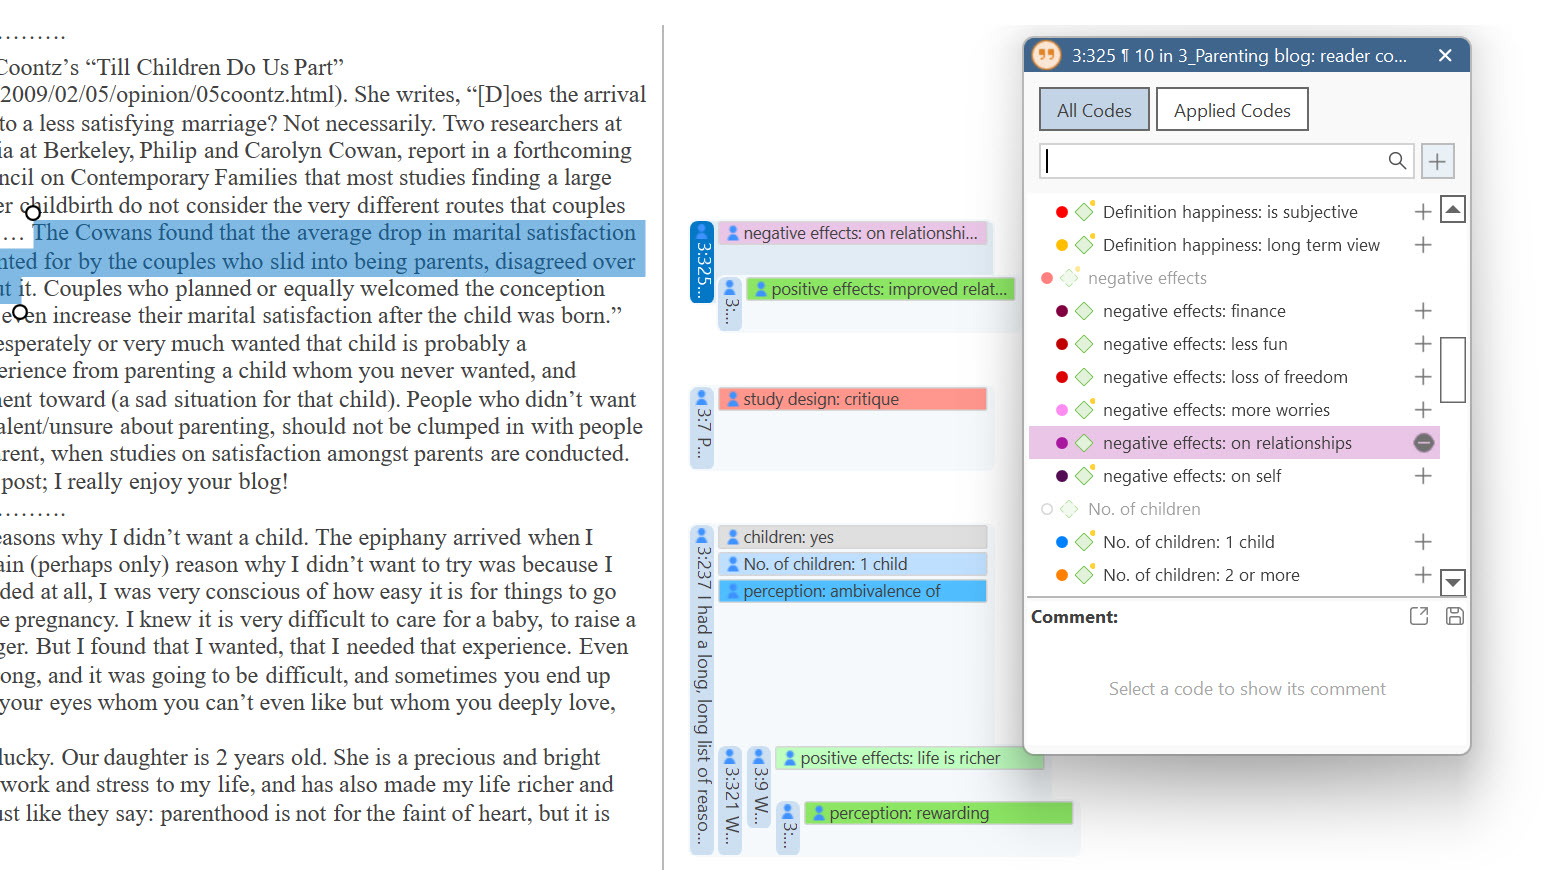
The ATLAS.ti margin area
If you start ATLAS.ti and load a document, one immediate visible difference is the ATLAS.ti margin area.
The margin area is a significant part of ATLAS.ti as it displays hyperlinks (i.e. links between data segments) and attached memos in addition to codes. And all objects in the margin area are interactive and have their own context menus.
If you click on a hyperlink, the linked data segment is displayed (or even played, in case of audio and video data). Jump directly to the linked segment and even open linked documents side-by-side. This hyperlink feature is unique to ATLAS.ti.
If you click on a code, the corresponding data segment is displayed the same way in all programs. However, there is more you can do with codes in the margin. You can easily grab it and drag it to another segment, thereby moving the code. By holding down the Ctrl-key, you can copy the code while still leaving it attached to the segment it is associated with. If you drop one code on top of another, the two will be exchanged. This is also the case for dragging code from other places like the navigator on the left hand side, or from the Code Manager. This flexible work flow cannot be found in any other software package.
To learn how to put ATLAS.ti to good use in YOUR research, visit our Research Hub
The ATLAS.ti Quotation
Another major difference between programs come in the unit of analysis. In ATLAS.ti, the smallest unit is called a quotation – a selected data segment. This allows you to work on the data level before you move on to a more abstract conceptual level. This allows you to enter a short title for each quotation and write a longer descriptive comment or interpretation. You can even begin to link segments to each other within or across documents. These are the above mentioned hyperlinks. Based on these you can begin to create network views as a way to visualize your data interpretation and the connections that you identified in the data. If appropriate for the chosen methodological approach, you can even begin to code the data to analyze it on a different level.
-
The following paper, written by Trena Paulus and Jessica Lester (2014), offers an example for how the Quotation Manager in ATLAS.ti was used for a discourse analysis: opus4.kobv.de/opus4-tuberlin/frontdoor/index/index/docId/4426.
-
A more technical take on the topic can be found in an article in our library written by Ray C. Maietta, an ATLAS.ti consultant. If you asked him why he likes to use ATLAS.ti for his own qualitative research work, his response is: “The power of the quotation. Quotations are a tremendous QDA resource because they invite discrete interaction with text or multimedia segments in a way that’s only available in ATLAS.ti.” Read more: The Life Of An ATLAS.ti Quotation/Maietta_2009-05_6-3.pdf.
Coding
ATLAS.ti offers the best workflow for coding your data as compared to all other software tools. The coding dialogue allows you to access and to apply codes quickly. You can review codes that you have already applied and it is also easy to remove a code if it does not longer fit.
The margin is also helpful when you code your data. It give immediate feedback, you can move codes around, unlink them, or write comments. In addition to the coding dialogue, you can also code via drag & drop from either the navigator or the Code Manager. Once your data is organized into folders, categories and sub codes, you can also simply drag a category code to a data segment and select one of its sub codes for coding. This allows you to work with a collapsed code list and saves lots of searching and scrolling.
Get first hands experience by downloading our demo version, or take a look at the following video:
Coding Data in ATLAS.ti Windows
Coding Data in ATLAS.ti Mac
Coding Video Data
The same unique architecture of ATLAS.ti that lets you start building a project based on quotations also works when it comes to coding video data. Video data is complex – it is sometimes difficult to immediately decide how to code a segment. As such, when working with video data, it is quite useful to start with the quotation as a first unit of analysis, then enter short titles for each segment you think is relevant, and finally describe and interpret the segment before you code it.
It is also easy to code video data directly. As you code, quotations are automatically created. In MAXQDA and other QDA programs, the logic of working with video data is mainly based on preparing a transcript. The possibility of coding video data in MAXQDA is very limited. That program allows you to roughly code interesting segments but does not allow you to fine-tune your selection or modify it. It only allows you the basic segmentation of the video without permitting in-depth analysis of the video material directly.
If a transcript for your video is available, you can import it from other sources (F4 / F5 / Transana); or create one in ATLAS.ti directly. Video and transcript are linked via time marks and can be played synchronously. In ATLAS.ti, the transcript is a separate document, which can be viewed side-by-side with the video file. Because of this, you can code both independently from each other. This lets you to work on a textual and on a visual level, allowing for an “un-mixed” approach to coding.
Also, there is no trade-off between preparing a transcript and writing comments on your video data since there is an additional quotation layer. In fact, you can write summaries / comments / interpretations on both the textual description of your video data (i.e. the transcript) and on the video material, since they are treated and stored in two separate documents.
Network Views / Maps / Modelers
In ATLAS.ti, your entire project is a network. Your data can be linked to codes, data segments might be linked to each other (hyperlinks) or to memos. Furthermore, memos might in turn be linked to codes, and codes can be linked to each other or to code families / groups. To make this easier, ATLAS.ti distinguishes between first and second class relations. First class relations are named links –these can be established between quotations and between codes. Thus, not only can you link codes to each other, you can also describe the link in the following manner: “is part of”, “is reason for”, “is consequence of”, “leads to”, and so on. Quotations might be linked using relations like ‘supports’, ‘explains’, ‘justifies’, or ‘contradicts’. ATLAS.ti offers a number of predefined relations. In addition, you can create your own relation to fit your project data, and do so in any language suitable to the project.
You can link objects while your work on the data level, either by using menu options or by drag and drop operations. You can also open a graphical interface, the network view editor, to do this work.
What you see or create in a network view editor is – as the name indicates – a specific view of your entire project. From there, you can access your data in context, or, in reverse, whatever you have linked to in the data level becomes visible in a network view editor. Thus, ATLAS.ti network views are integrative and represent your interpretive work at all levels of analysis. This makes it distinct from other programs that map or model such analysis.The handling of these tools is much smoother in ATLAS.ti than in MAXQDQ. That program’s mapping function is somewhat more difficult to use – and causes the user to switch back and forth between three different modes and an outdated graphical user interface.
ATLAS.ti is the ultimate toolbox for researchers, evaluators, policy advisers, social and health officials, educators, and students in nearly all disciplines in which "soft data" comes into play.