The application of ATLAS.ti in different qualitative data analysis strategies


- Introduction
- A base for your data
- The deductive approach
- The inductive approach
- Conclusion
- Bibliography
- Photo credit Hero: Mim-Essay
Introduction
Qualitative data analysis can follow a variety of approaches, and ATLAS.ti is a flexible and extensive tool to facilitate for different strategies. Depending on their analytic needs, researchers can impose their methodology by using (or ignoring) a variety of functions and features of Computer-Assisted Qualitative Data Analysis Software (CAQDAS) to suit their chosen analytic structure or approach (Paulus et al. 2014). Here I will discuss several of the most common applications of ATLAS.ti in different data analysis processes.
A base for your data
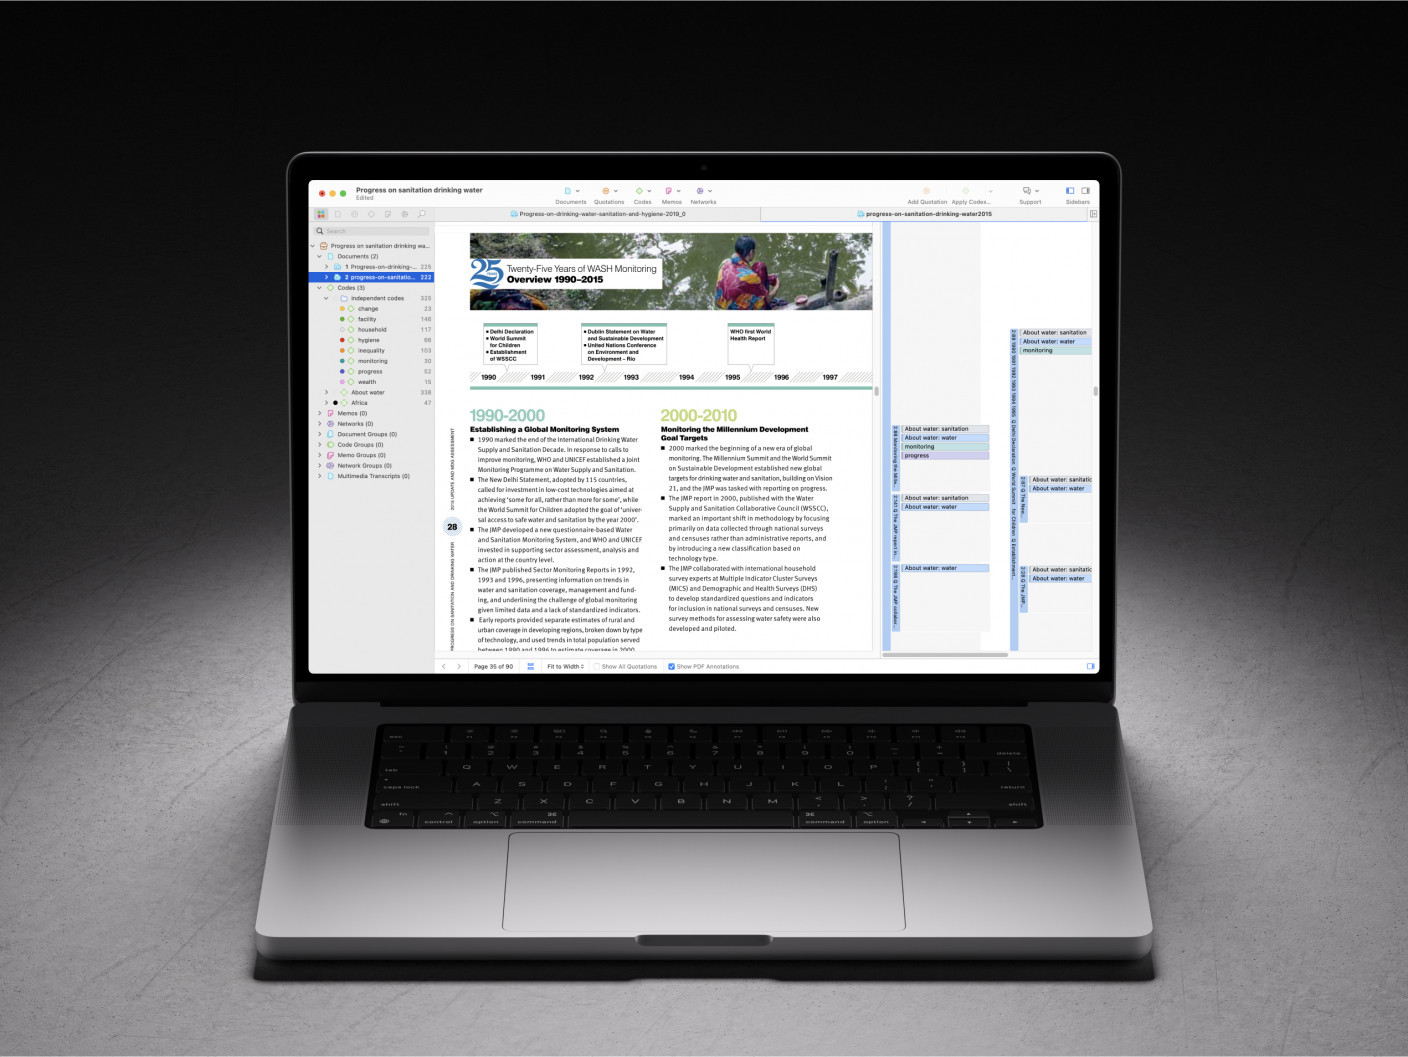
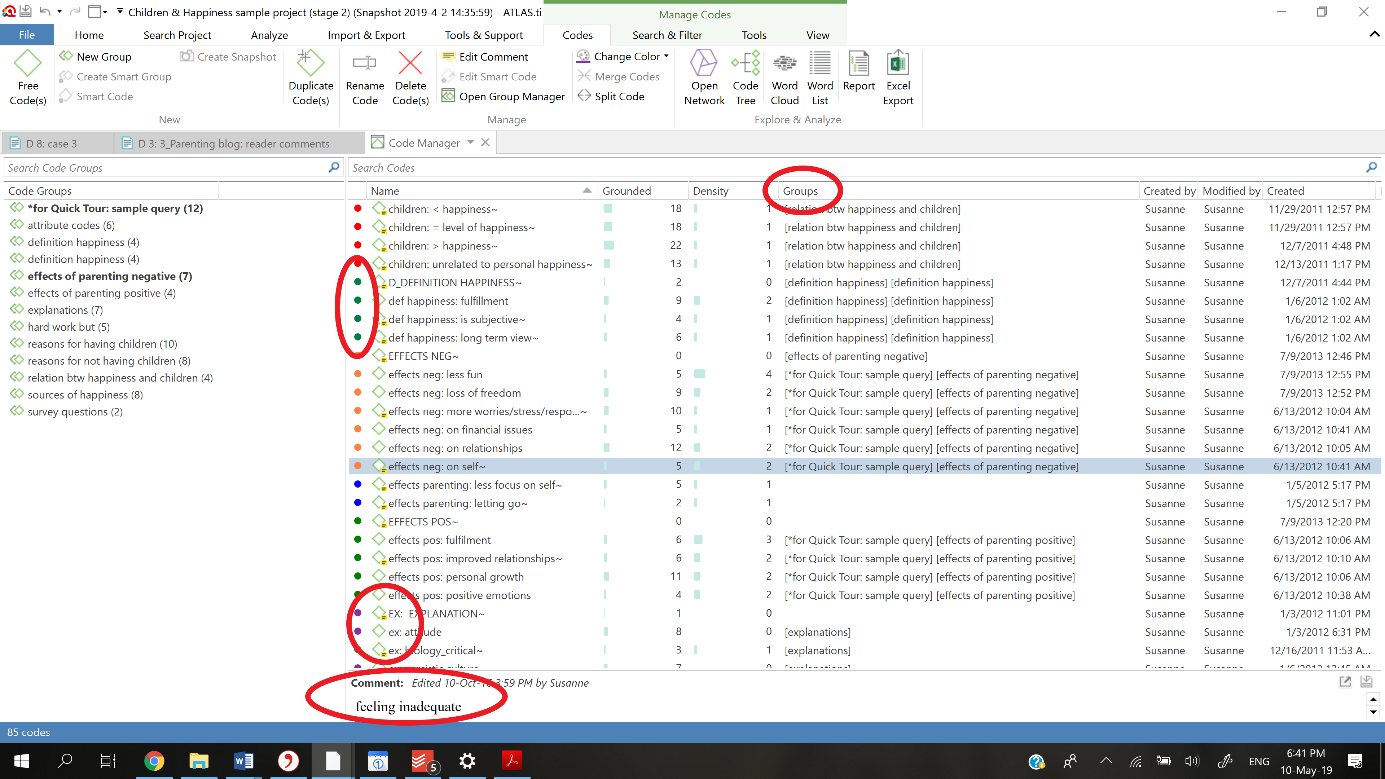
ATLAS.ti is a concept database which assists in analyzing qualitative data. That means that you cannot feed the program information and press a magical ‘analyze’ button. Rather, ATLAS.ti facilitates for you to collect, transcribe and code your data, build concepts, connect them in networks, ask your data questions and write narratives. Coding is the central activity you engage in when using ATLAS.ti, and this forms the basis for everything else you do. Coding means assigning categories, concepts or labels to segments of information that are of interest to your research objectives. It involves marking (highlighting, underlining) and annotating (adding notes, comments or instructions) to text passages or other data segments.
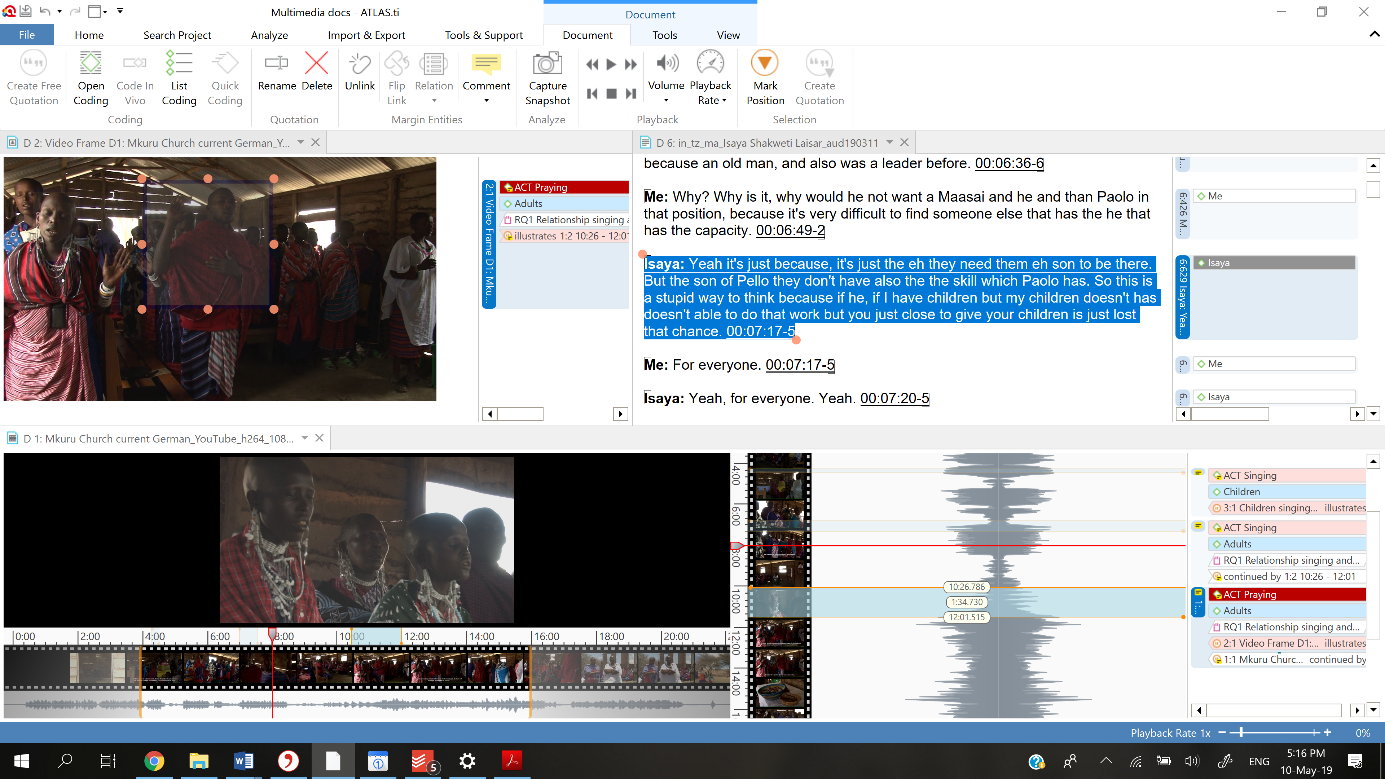
In ATLAS.ti we mark data segments by creating quotations, which can constitute of text, graphic, audio or video material.
The annotations are achieved by labeling these data segments with a code, and if required, adding comments to the segment.
The deductive approach
There are two main approaches to coding: Inductive and deductive. Deductive reasoning works from the more general to the more specific. Sometimes this is informally called a “top-down” approach. We might take a certain theory about our topic of interest as a starting point, for example borrowing from the literature. We then narrow the theory down by formulating specific hypotheses that can be tested, collecting observations to address these hypotheses. This ultimately leads us to be able to test the hypotheses with specific data – and find a confirmation (or not) of the original theory.
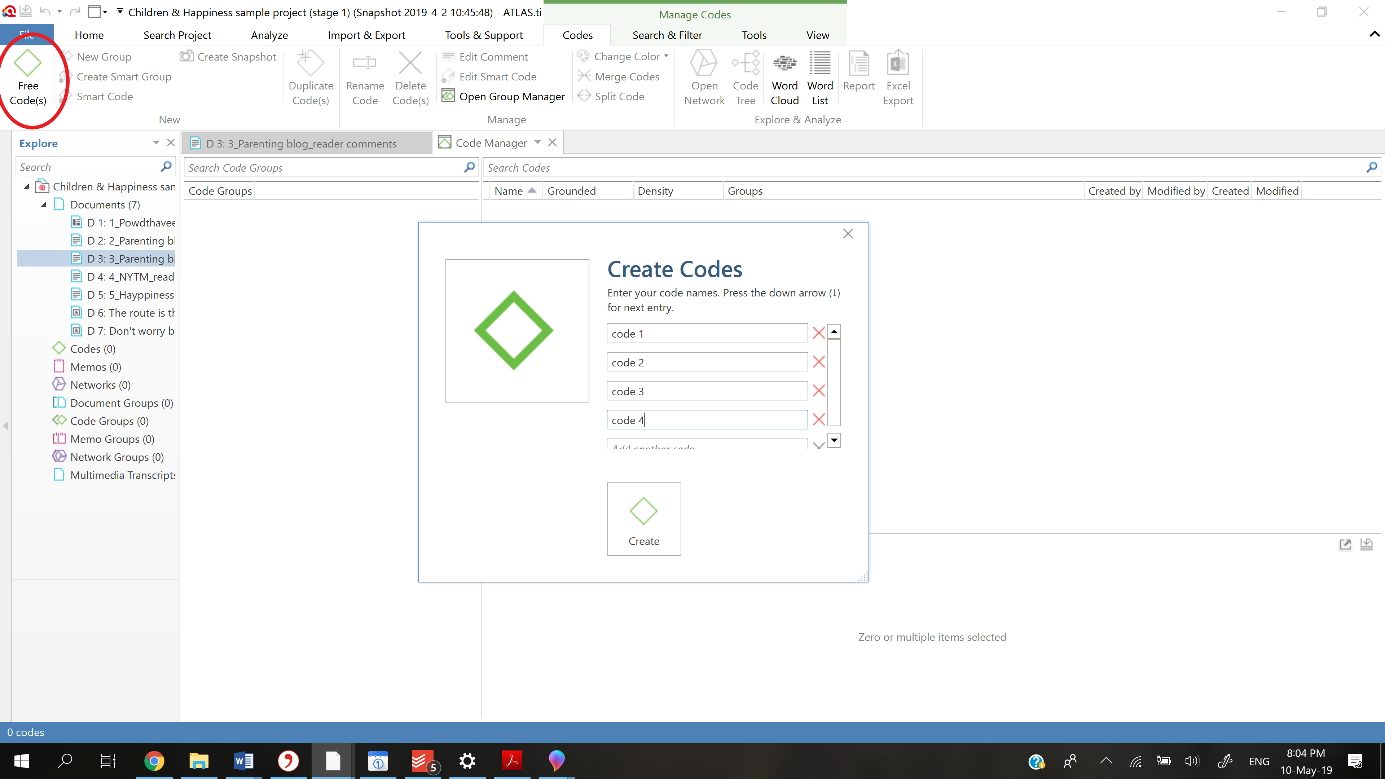
In ATLAS.ti we would use the free code function to create codes based on the concepts that are of importance to the theory we work with.
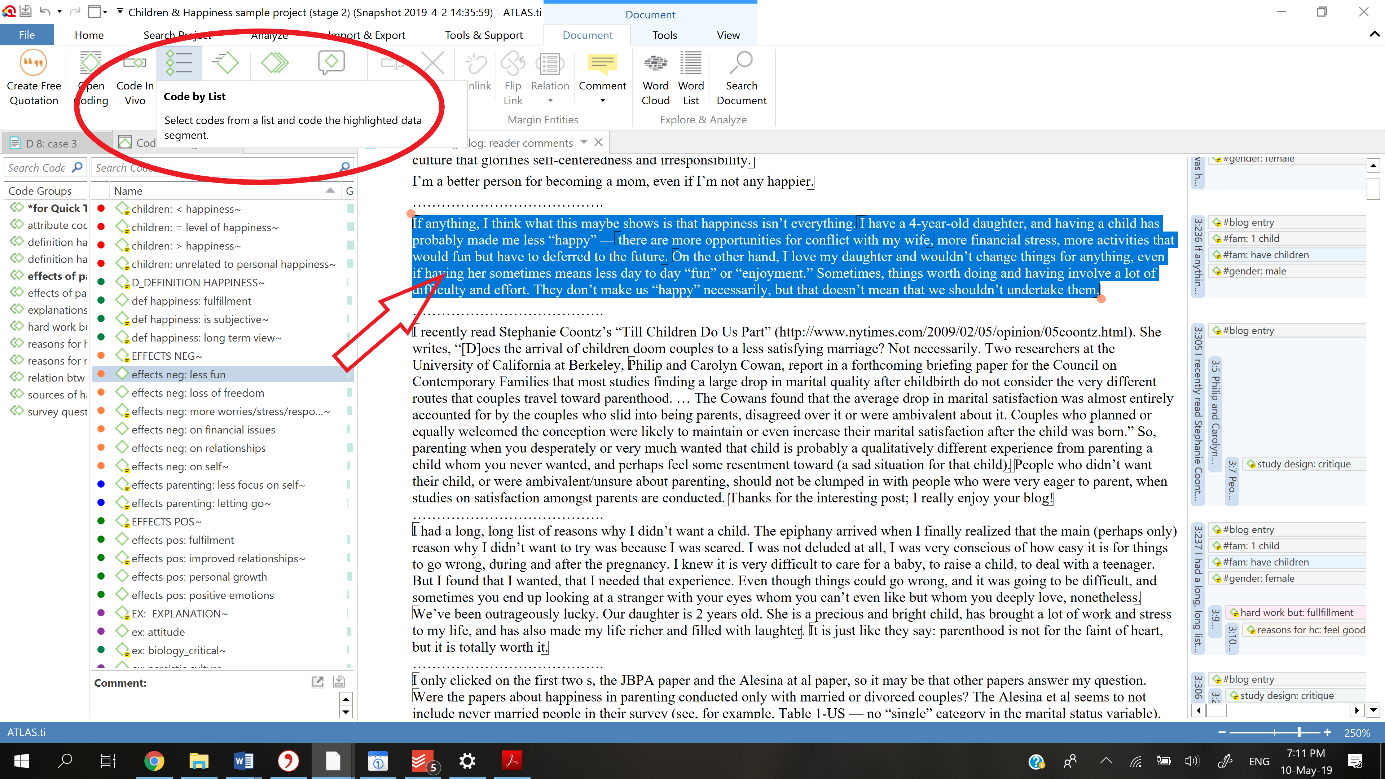
We can then use the list coding function or drag and drop codes from the navigator or manager onto the relevant data segments.
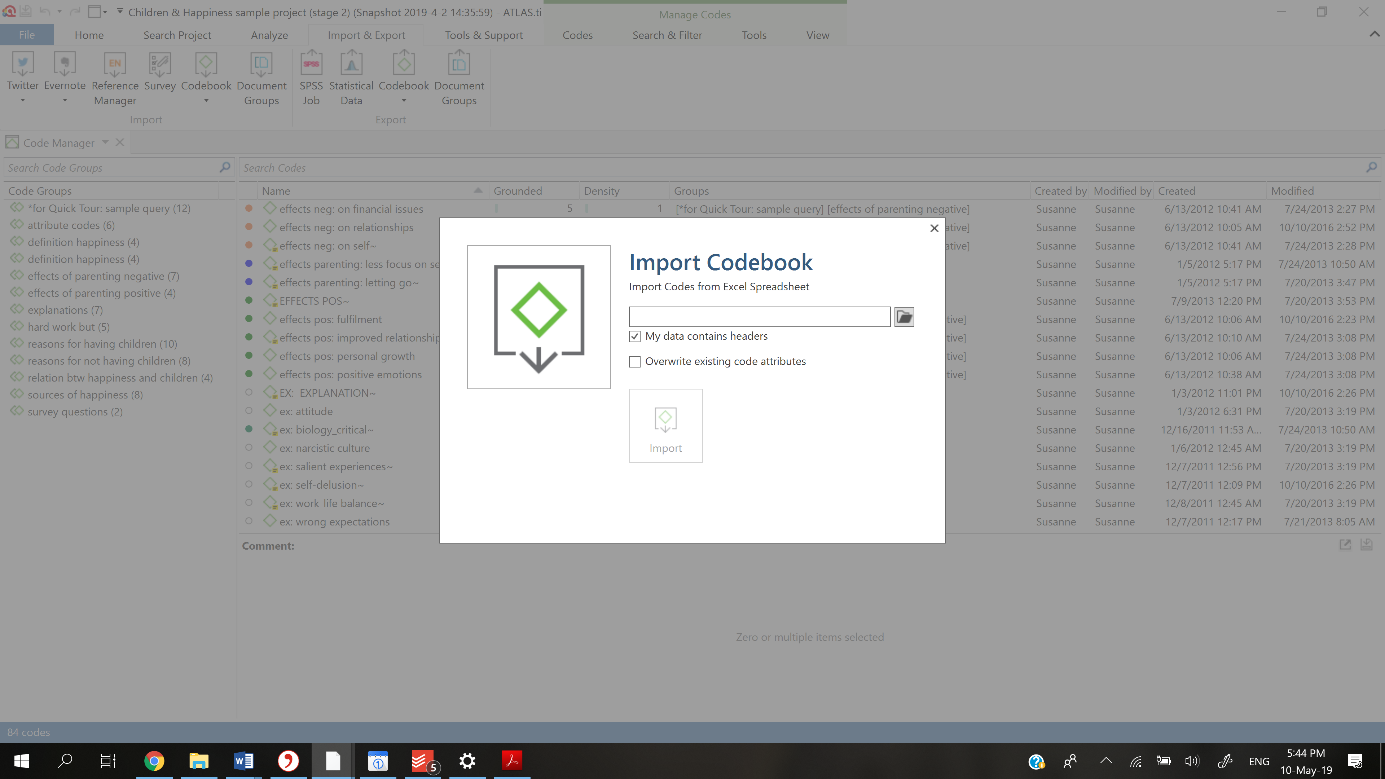
Alternatively, it is possible to import a complete code-book including codes and their definitions from another ATLAS.ti project, from another CAQDAS program, or even from an Excel sheet.
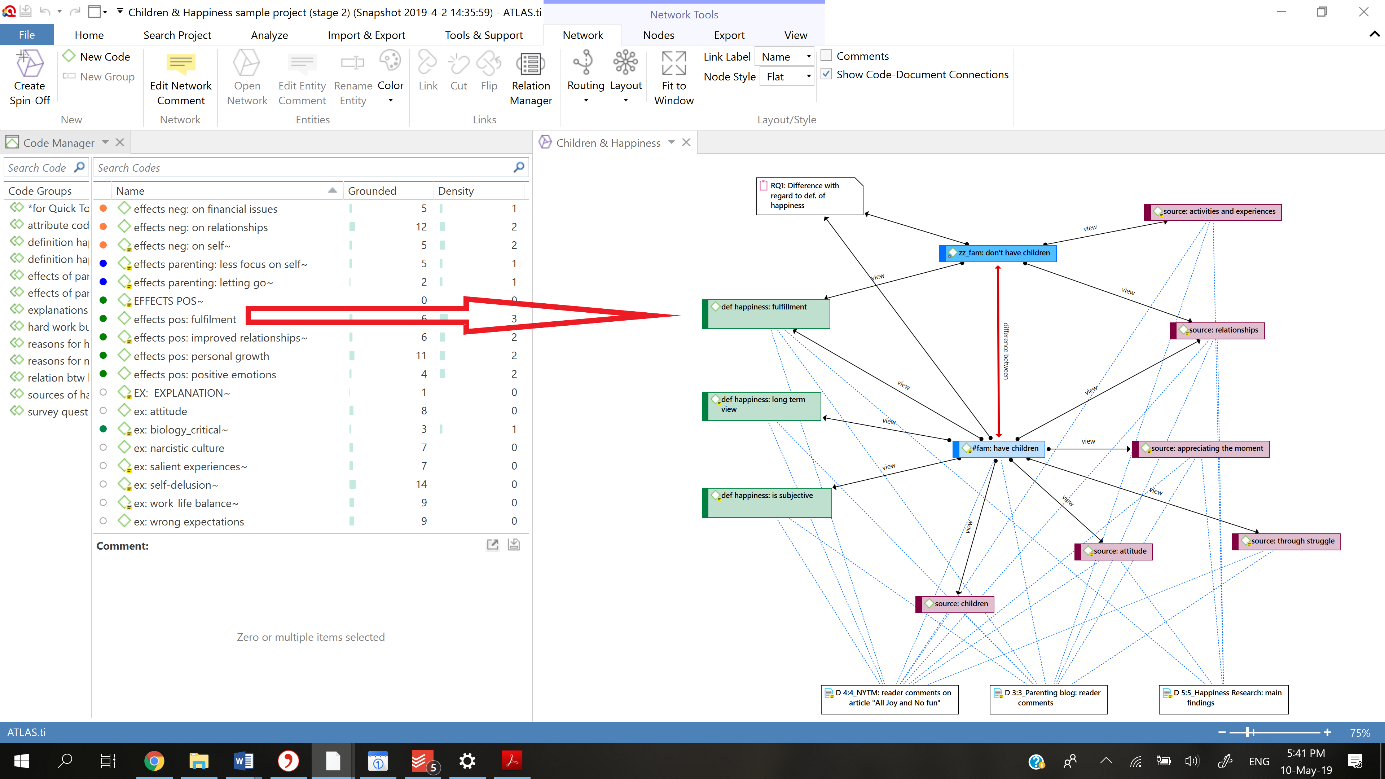
We can use networks to visualize how the imported codes (concepts) are related according to the theory, for example by dragging and dropping them from the code manager into an empty network, and creating semantic linkages.
It is important to realize that in this approach, our coding system is informed by the theory. We will apply the existing codes to the data segments we create. By coding our data we will come to know if in our specific data set the concepts are functioning as the theory predicts. This approach could for example be used to see if a European theory that specifies the modernization process also applies to a certain African context.

The inductive approach
Inductive reasoning works the other way around: Starting from our data, we work toward broader generalizations and theories. Informally, this is sometimes called a “bottom up” approach. In inductive reasoning, we begin with specific observations and measures, applying labels until we detect patterns and regularities, formulate tentative hypotheses that we can explore, and finally end up developing some general conclusions or even a theory. A good example is grounded theory. This approach is for example used by an ethnographer who tries to describe how a certain people view human-animal relationships.
In this case, we would start with reading, observing or listening to our data and fragmenting it. This is not only to identify important segments, but also gives us the opportunity to compare data with data. Moreover, if we fragment data systematically, this process helps us to refrain from superimposing our own preconceived ideas on the data and prevents us from becoming so immersed in respondent’s worldviews that we accept the information in large chunks without questioning.
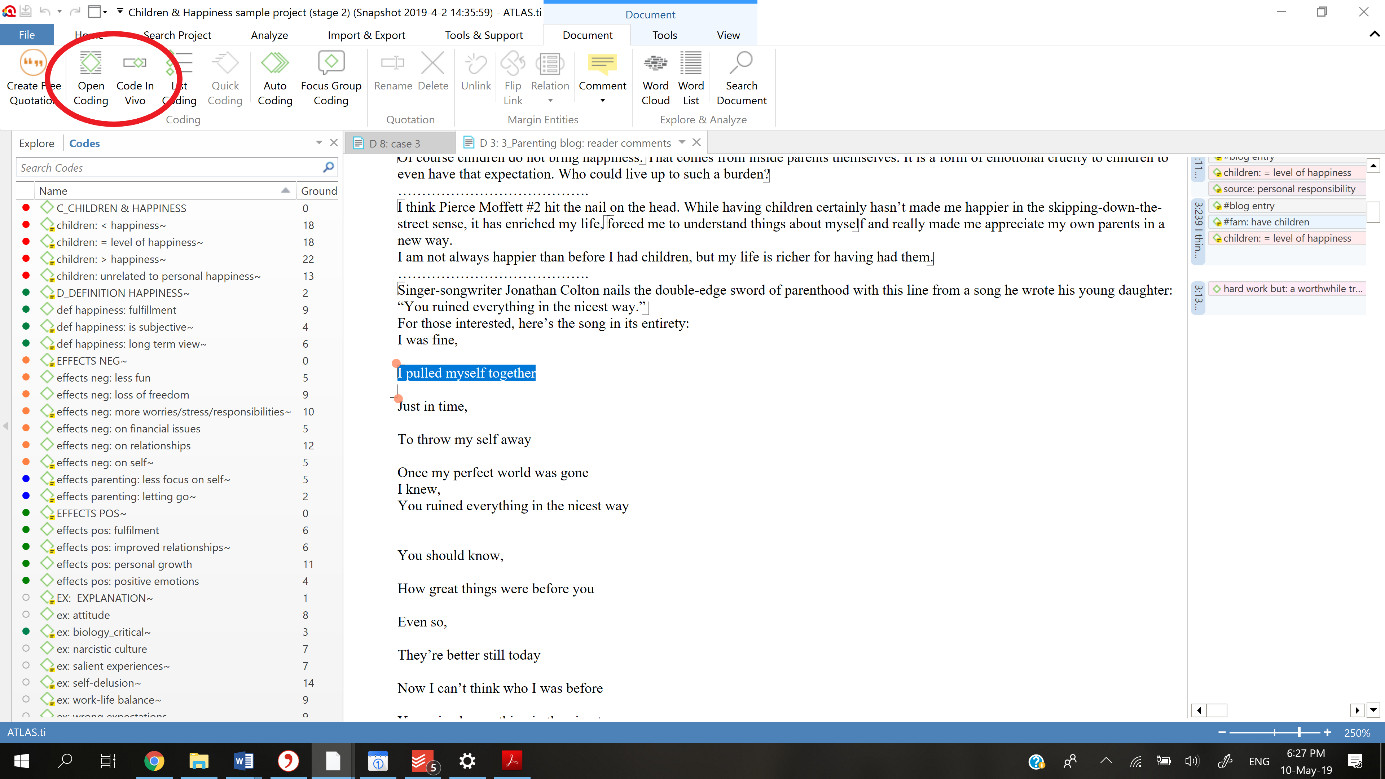
In ATLAS.ti we would use open coding (creating and naming a new code) or in-vivo coding (the selected segment forms the name of the new code) to create labels or concepts to attach to each data segment.
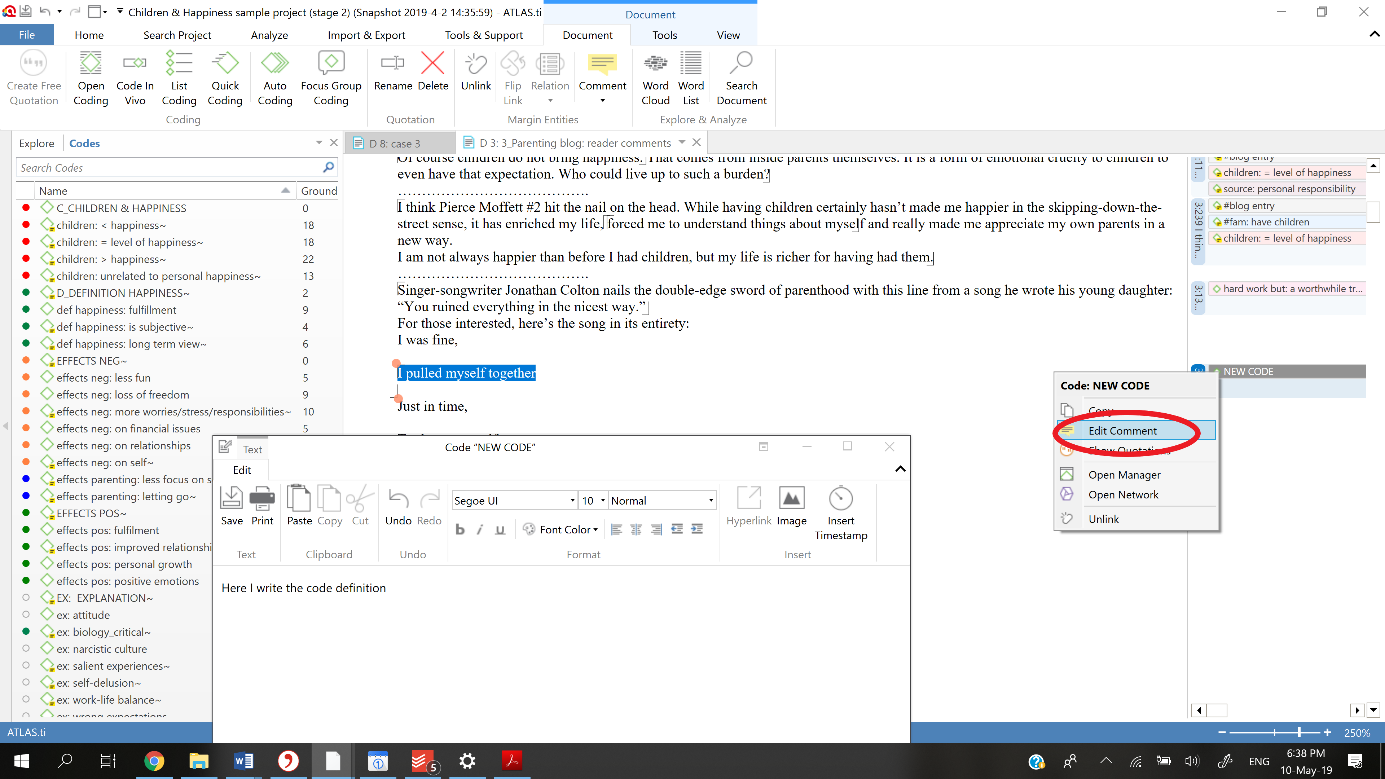
The initial strategy followed is often open line-by-line coding, and generally codes are applied staying close to the data, with an open and spontaneous approach. For almost all projects it is recommendable to try to keep labels short, simple and precise, with a focus on actions. It is important to clearly define every new code by using the comments function.
One of the most common pitfalls for beginning ATLAS.ti users is that they can get lost in the swamp of coding (Friese 2012). It is important to create an organized coding system, using prefixes, symbols and colors that define how codes with commonalities are grouped together so that categories or themes can be identified.
Grouping codes helps focusing the coding process and the interrogation of the data, and step by step the level of abstraction will rise, until we can create linkages between the different codes and code groups, and represent these graphically in networks to work towards an emerging theory.
In a typical grounded theory study, first cycle initial coding will be done until saturation is reached, after which the coding system can be evaluated, checking definitions and cleaning up overlapping or ambiguous codes. Second cycle coding uses the developed coding system to engage in more focused coding of the rest of the data. Evaluations need to be done after each phase, checking for consistency, redundancy, empty quotes and data not yet coded. The abstract level of the analysis can be lifted by reducing the number of codes and categories, which is of importance when moving from the data level into conceptualization and theory building.
Conclusion
The basics of these deductive and inductive approaches can be employed when working exclusively with qualitative fieldwork data, but also when ATLAS.ti is used in mixed method approaches (for example when surveys are imported into ATLAS.ti, or when data is exported to SPSS), when working with literature (for example importing reference manager data) or social media data (importing from Twitter or EverNote), and even when using reflexive approaches such as auto-ethnography (for example by converting memos to documents that can be coded). The coding applied, forms the basis from where the analysis tools can be used to ask the data questions. Whether working inductively or deductively, it is of high importance to record every step executed in a memo, which functions as a research diary. This is to increase transparency, facilitates for overseeing and managing the analytic processes and will help with writing-up. Although ATLAS.ti greatly improves the potential and transparency of the research process, it is the researcher who is accountable for the approach taken, conceptualizing chunks of data and organizing and relating these concepts, as well as the systematical documentation of these processes.
Bibliography
-
Friese, Susanne (2012): Qualitative data analysis with ATLAS.ti. London: Sage.
-
Paulus, Trena; Lester, Jessica; Dempster, Paul (2014): Digital Tools for Qualitative Research. Los Angeles: Sage.
Photo credit Herotext: Mim-Essay