Quantifying Qualitative Data: A Step-by-Step Guide

- Introduction
- Can you get quantitative data from qualitative data?
- What is an example of turning qualitative data into quantitative data?
- How to quantify qualitative data
- Should qualitative data be quantified?
Introduction
Qualitative research tends to focus on describing phenomena rather than measuring it. That said, any data analysis approach has its limitations, which compels us to acknowledge that both qualitative and quantitative approaches to research can go hand in hand to provide a richer understanding of the world around us. In this article, we will examine the quantification of qualitative data and explore the process of converting qualitative data for quantitative analysis.

Can you get quantitative data from qualitative data?
The straightforward answer to this question is yes: you can quantify many forms of data that aren't easily quantifiable. However, the process involves more than just counting or measuring; it requires a meticulous approach to ensure that the conversion preserves the depth and nuance that qualitative data often captures.
Many fields of study employ both qualitative and quantitative approaches, including:
- market research
- nursing research
- teaching and learning
- user research
Firstly, it’s essential to recognize that qualitative data is inherently rich in detail and context. It provides narratives, experiences, and emotions that can be complicated to capture with numbers alone. Examples include interview transcripts, open-ended survey responses, or field notes that capture observations and conversations. These are all treasure troves of insights that can reveal not just what is happening but also why it's happening.
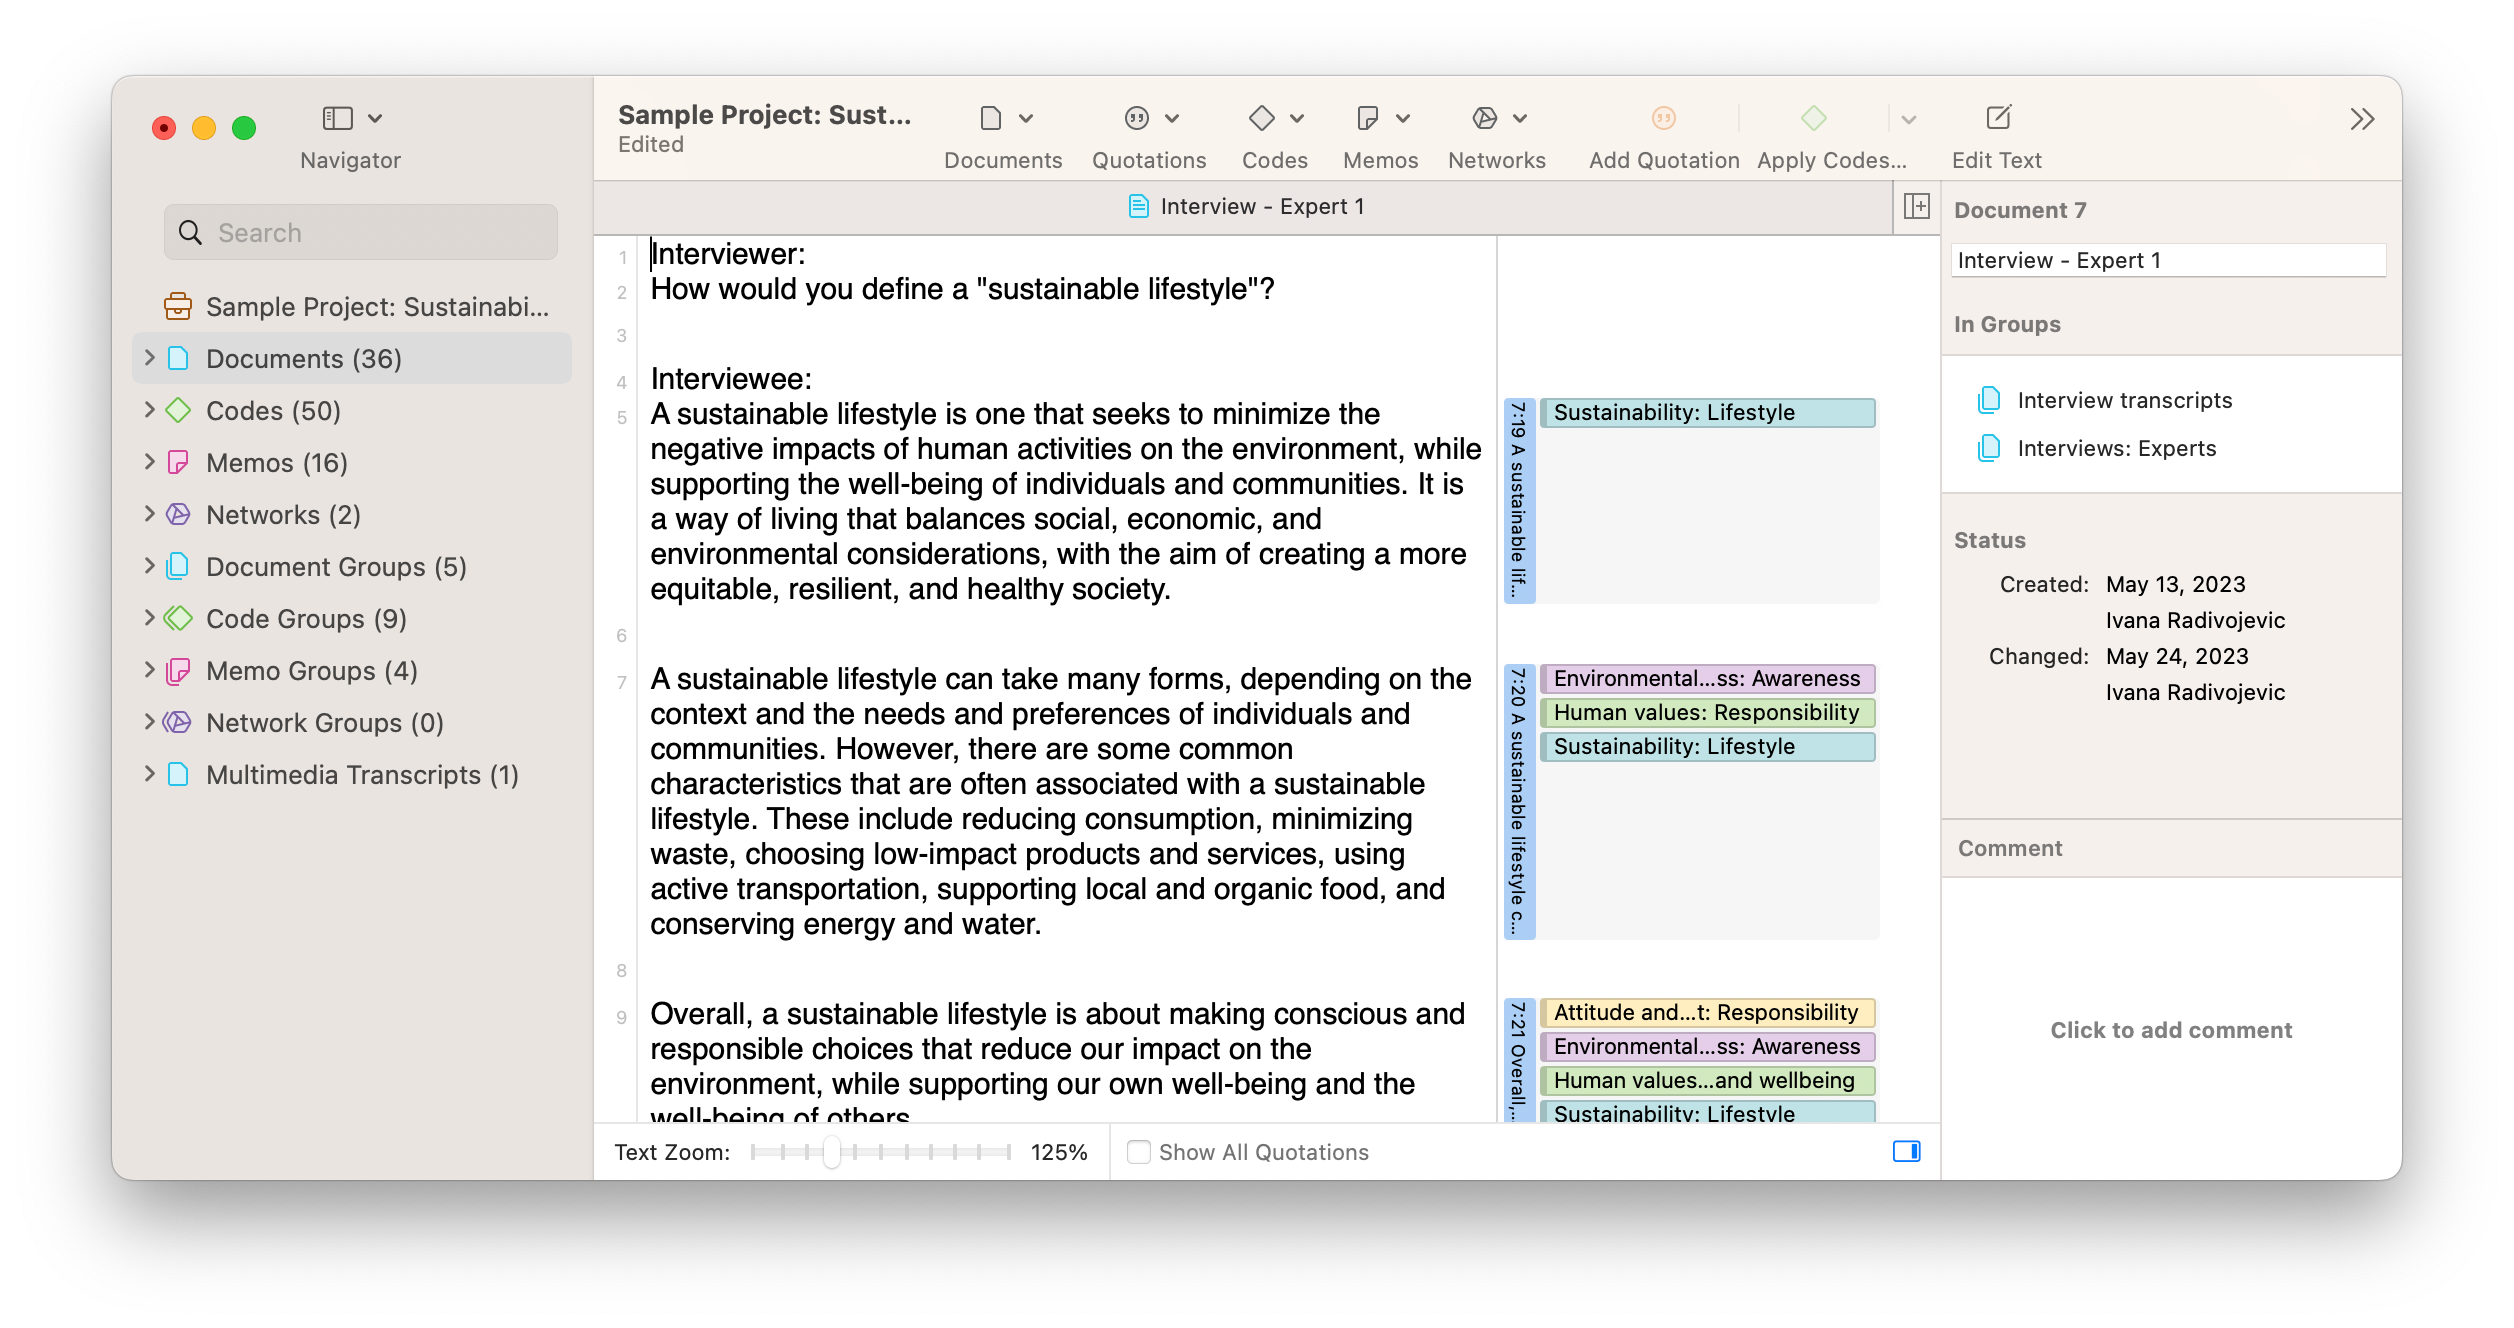
To use this data quantitatively, researchers can use various techniques and methods, often starting with coding. Coding involves breaking down the data into discrete parts and labelling these parts with codes. These codes can then be grouped into categories, themes, or patterns. Once this step is completed, you can generate quantifiable information by counting the frequency of each code, theme, or category.
For example, imagine you have conducted interviews with 50 participants about their shopping behaviors and preferences. During the interviews, you may find recurring themes or phrases like "convenience," "low prices," and "brand trust." You can code these phrases and count the number of times each phrase appears across all interviews. In this way, you can convert words and narratives into numbers and frequencies.
Quantifying data is less about diminishing its value or complexity and more about providing another lens through which to interpret it. Quantifying data can aid in identifying trends, making comparisons, and supporting arguments with statistical evidence. When you pair the quantitative findings derived from the data with the rich, contextual insights of the qualitative data, you end up with a multi-dimensional view of your research topic.


What is an example of turning qualitative data into quantitative data?
Let's look at a hypothetical research project that aims to understand customer satisfaction with a newly launched mobile application to illustrate the conversion from qualitative to quantitative data. In this scenario, researchers conduct qualitative research by conducting interviews with users and asking them open-ended questions such as "What do you like about the app?" and "What improvements would you suggest?" Additionally, they gather text-based reviews from various online platforms where users can freely express their opinions about the app.
Once qualitative research methods have collected the necessary data, the researchers begin the process of coding. This involves reviewing the interview transcripts and text reviews, then identifying recurring themes or phrases. For instance, phrases like "user-friendly interface," "frequent crashes," or "helpful customer support" could be extracted and assigned specific codes.
After coding, the next step is to group these codes into broader categories or themes. These might include categories like "Usability," "Technical Issues," and "Customer Support." Qualitative analysis can then look at these categories to generate an understanding of the key themes in the data. At this stage, researchers can also count the frequency with which each code or category appears in the data. For example, if the category "Usability" is mentioned 40 times across all interviews and reviews, and "Technical Issues" is mentioned 30 times, these numbers begin to form quantitative data points that can be analyzed statistically.
Next, researchers can now perform various analyses to answer specific questions. For example, they might use statistical tests to determine if the frequency of mentions of "Technical Issues" is statistically significant when compared to other categories. They may also correlate these quantitative results with other points of interest, such as net promoter scores, app ratings, or user engagement metrics, to provide a more holistic understanding of customer satisfaction.
However, the qualitative insights shouldn't be overlooked even as the data is being quantified. The qualitative data offer the depth and context that make the quantitative results meaningful. For instance, while a quantitative approach to analysis can tell you "what" the issues are and how often they occur, a qualitative approach can tell you "why" these issues matter to the users. In our example, knowing that "Technical Issues" were mentioned 30 times is valuable, but understanding the frustration or inconvenience caused by these issues provides a fuller picture.
By integrating both qualitative narratives and quantitative measurements, researchers can provide a richer, more comprehensive analysis of customer satisfaction with the mobile application. In this manner, the converted quantitative data serves to enhance and validate the findings from the qualitative data, rather than replace them.

How to quantify qualitative data
When you want to turn qualitative data into quantitative data, there is a series of carefully planned steps that should be aligned with the objectives of your research. It starts with a clear understanding of your research question and how quantitative analysis can complement the qualitative insights you've gained.
The first stage often involves coding, a methodical process that translates textual or visual information into a format that can be counted and categorized. Imagine you're studying evaluations from a set of online product reviews. You could start by reading through the reviews and identifying recurring themes, ideas, or expressions. These could be things like "easy to use," "poor quality," or "excellent customer service." Each of these recurring elements would be assigned a specific code.
But coding is not just about picking out phrases; it also requires interpreting the context in which they are used. For example, the phrase "easy to use" may be coded under a theme such as "usability," but the context and tone should also be considered with respect to whether this is being mentioned as a positive or a negative aspect by the reviewer.
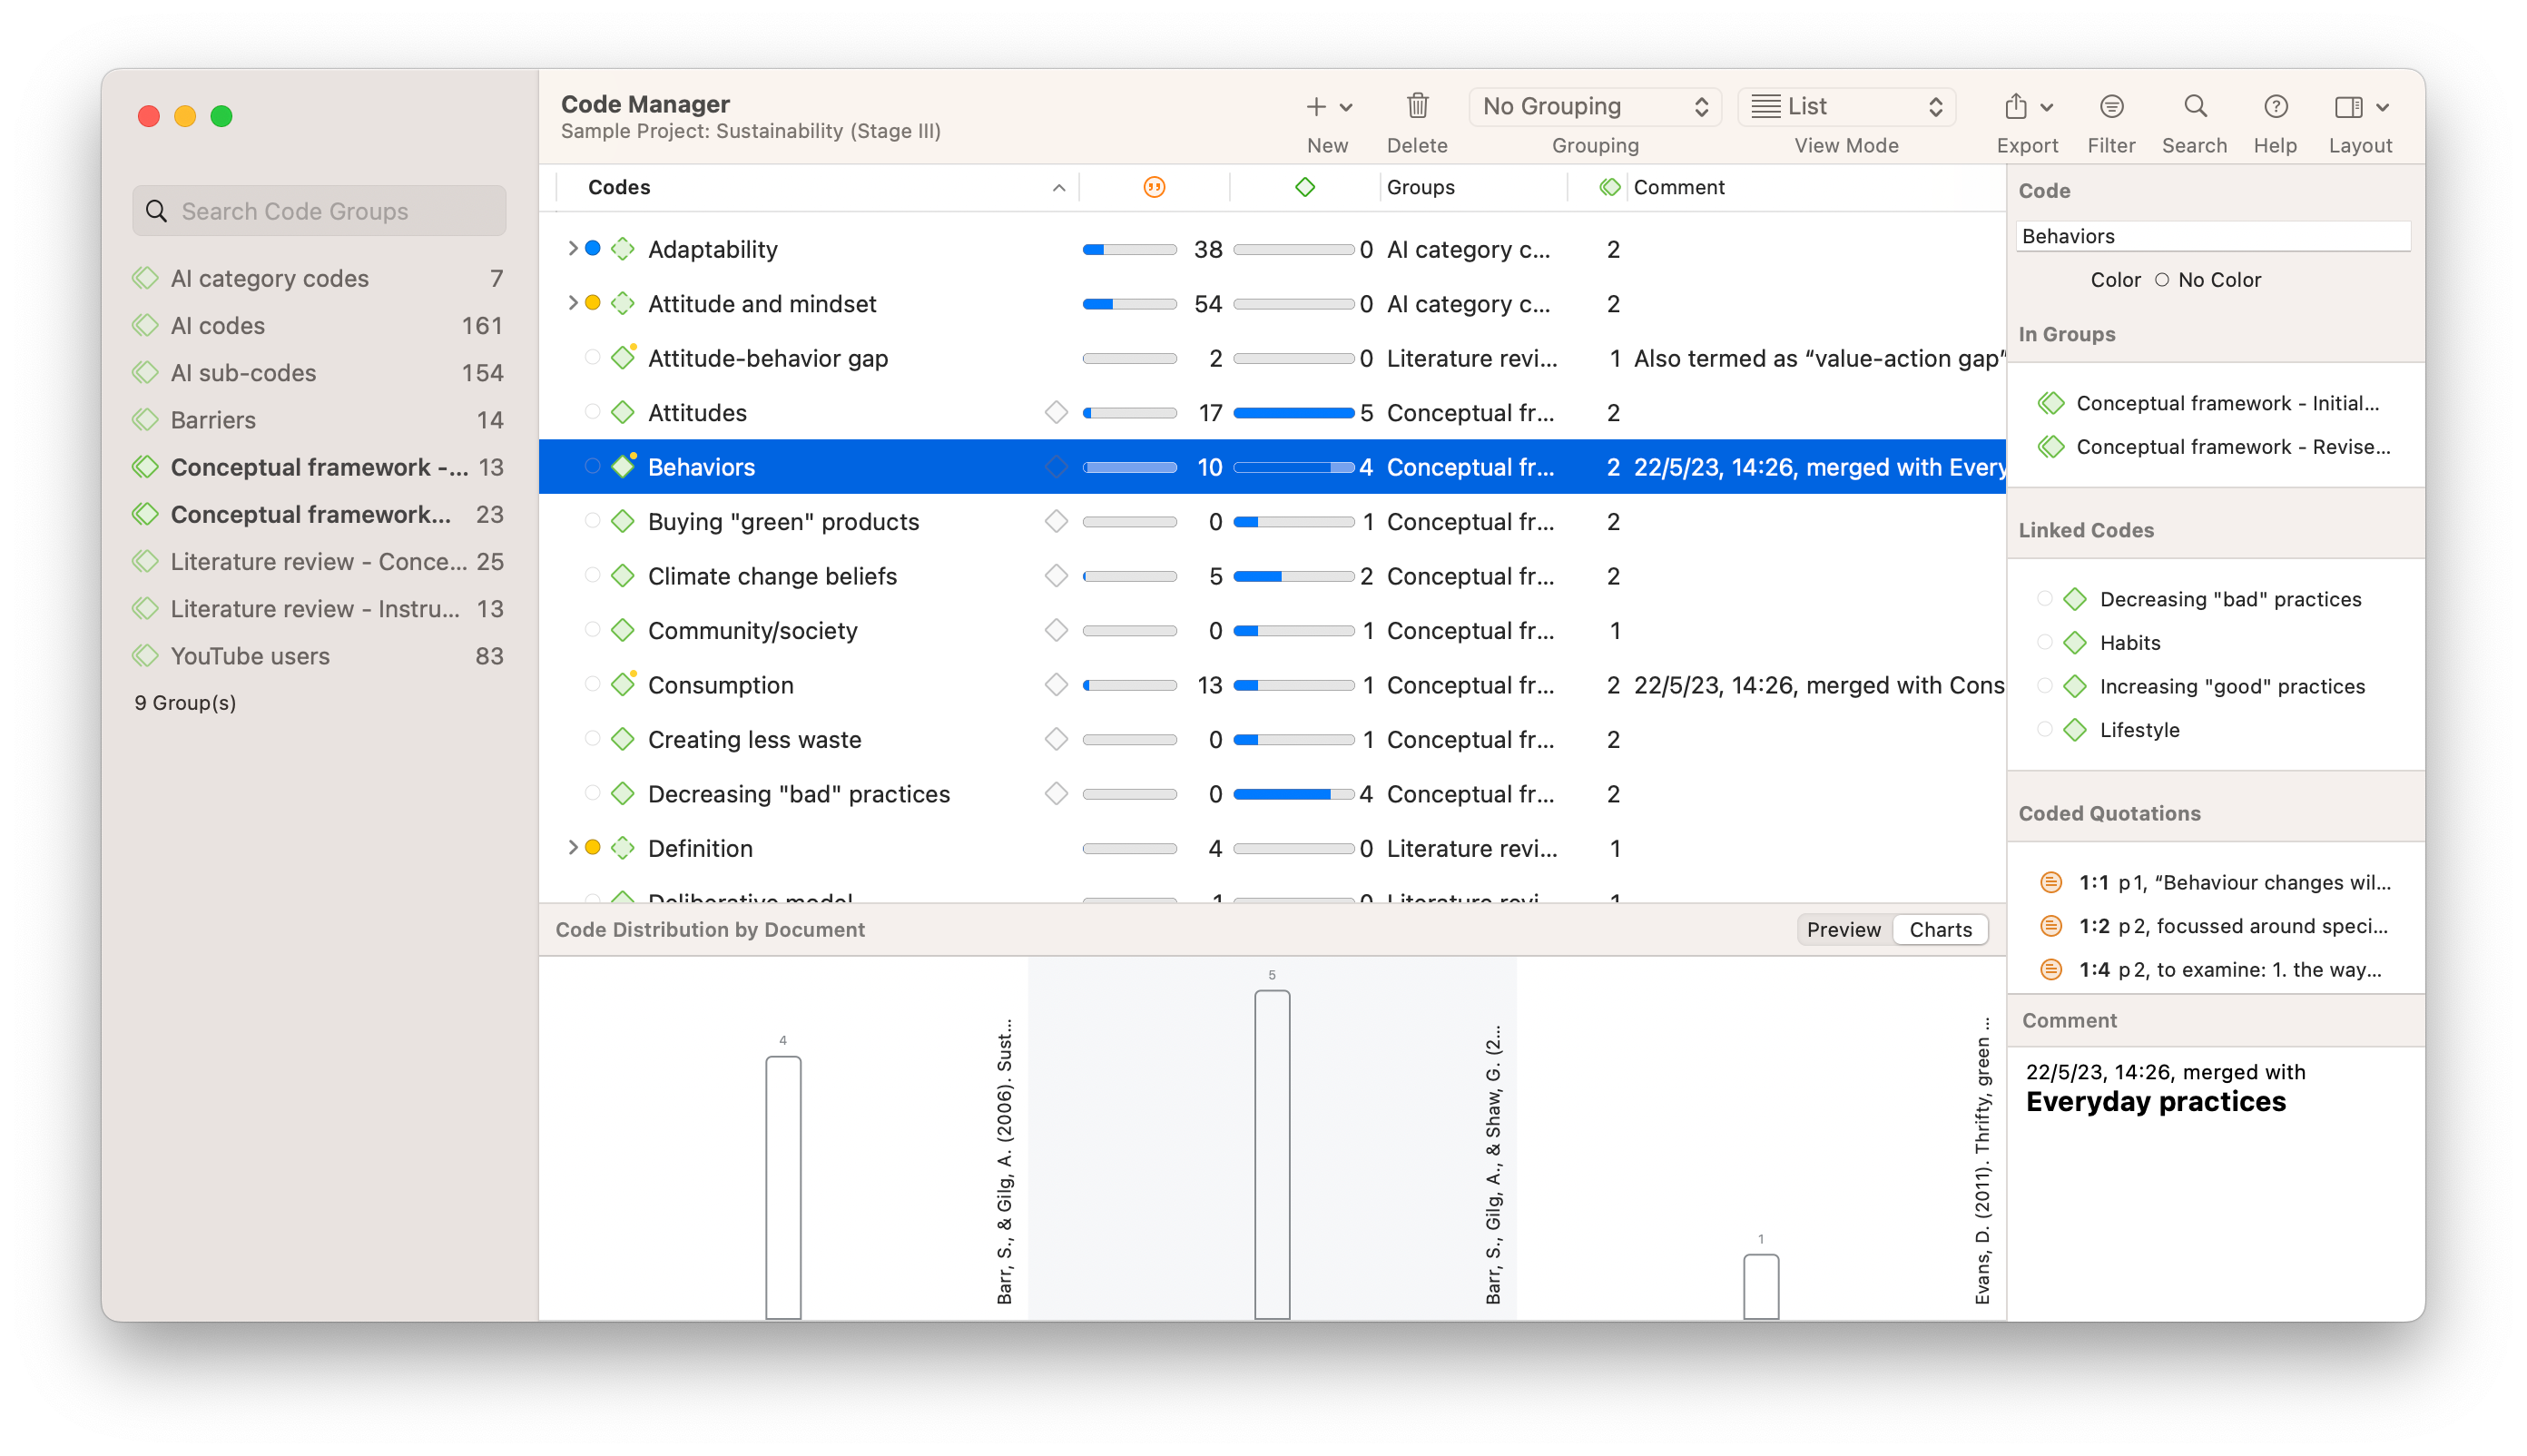
Once the coding process is complete, the next stage is often grouping or clustering these codes into broader categories or themes. The aggregation serves to simplify the collected information into more manageable sets. For instance, if you've coded phrases like "easy to use," "intuitive design," and "simple interface," these could all be grouped under a broader category like "Usability."
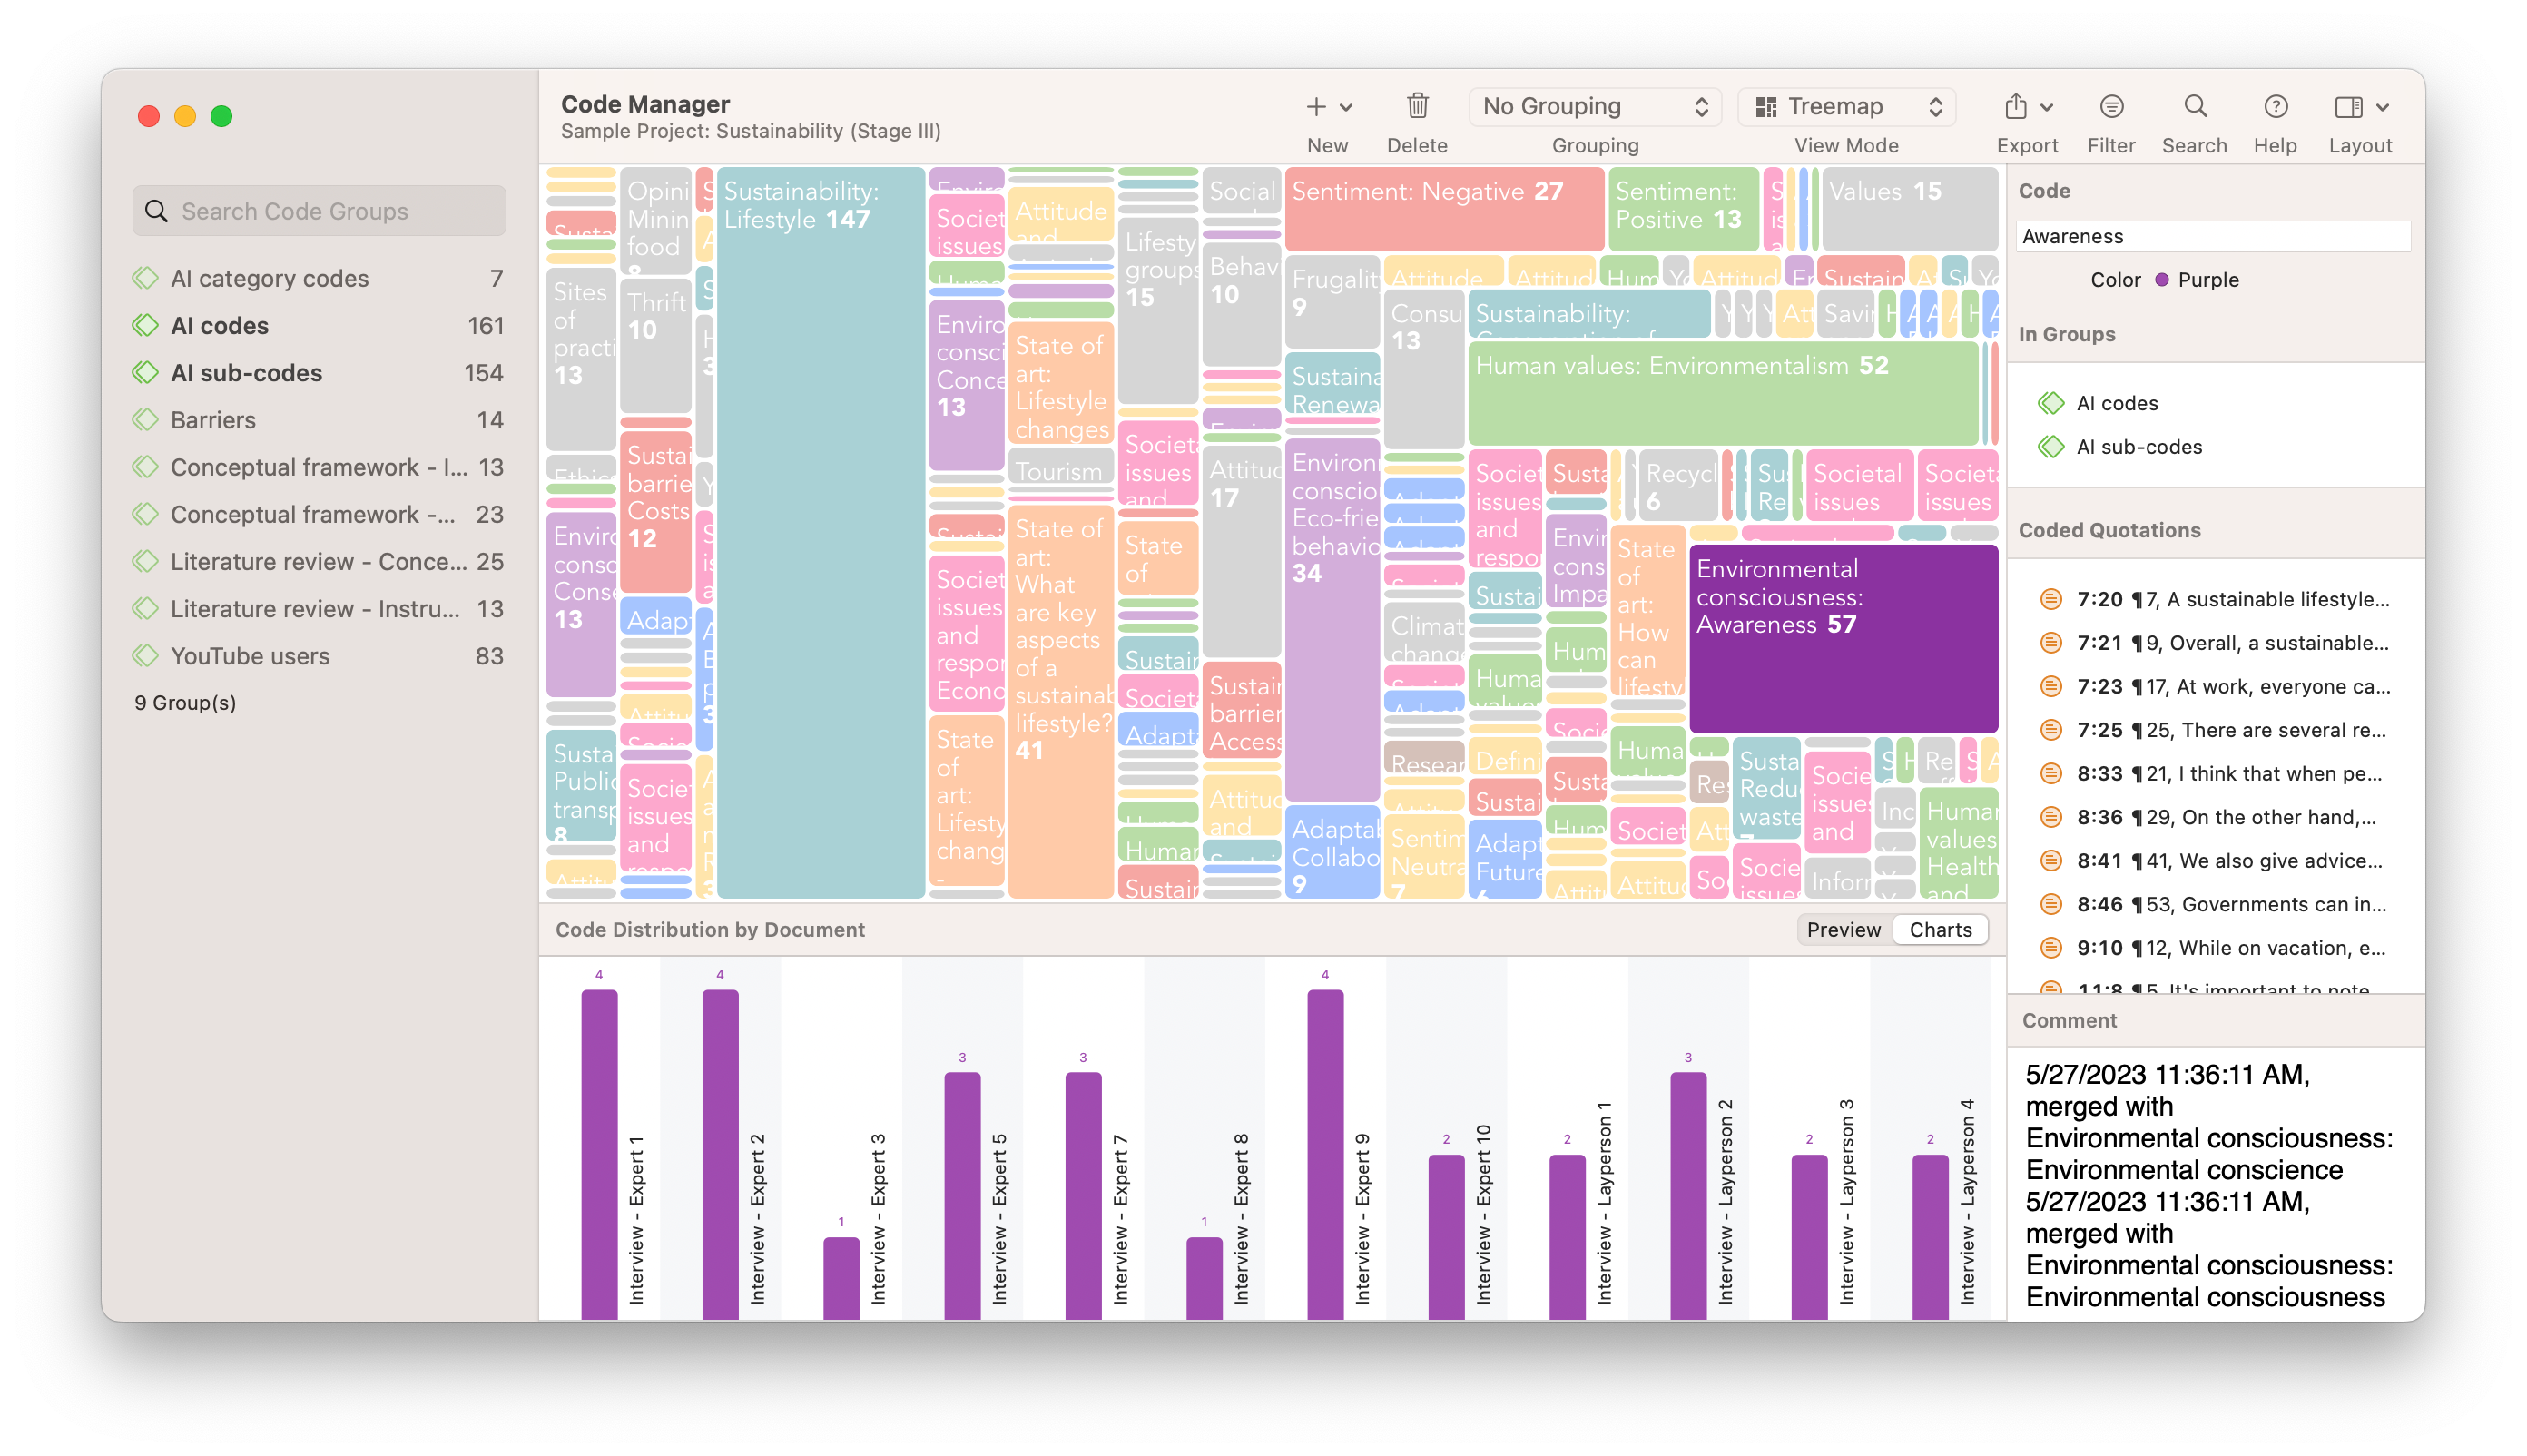
After grouping, you can then quantify your data by counting the frequency of these codes or themes. In a simplistic form, this could mean tallying how many times each code appears across your dataset. This numerical representation allows you to employ statistical methods to your findings, perhaps comparing them to other quantitative metrics you’ve gathered, such as numerical ratings or the time spent using a product.
In addition, qualitative data analysis software, such as ATLAS.ti, allows you to export your entire coded project into a format that can be imported into statistical analysis software to run regressions and other quantitative analyses.
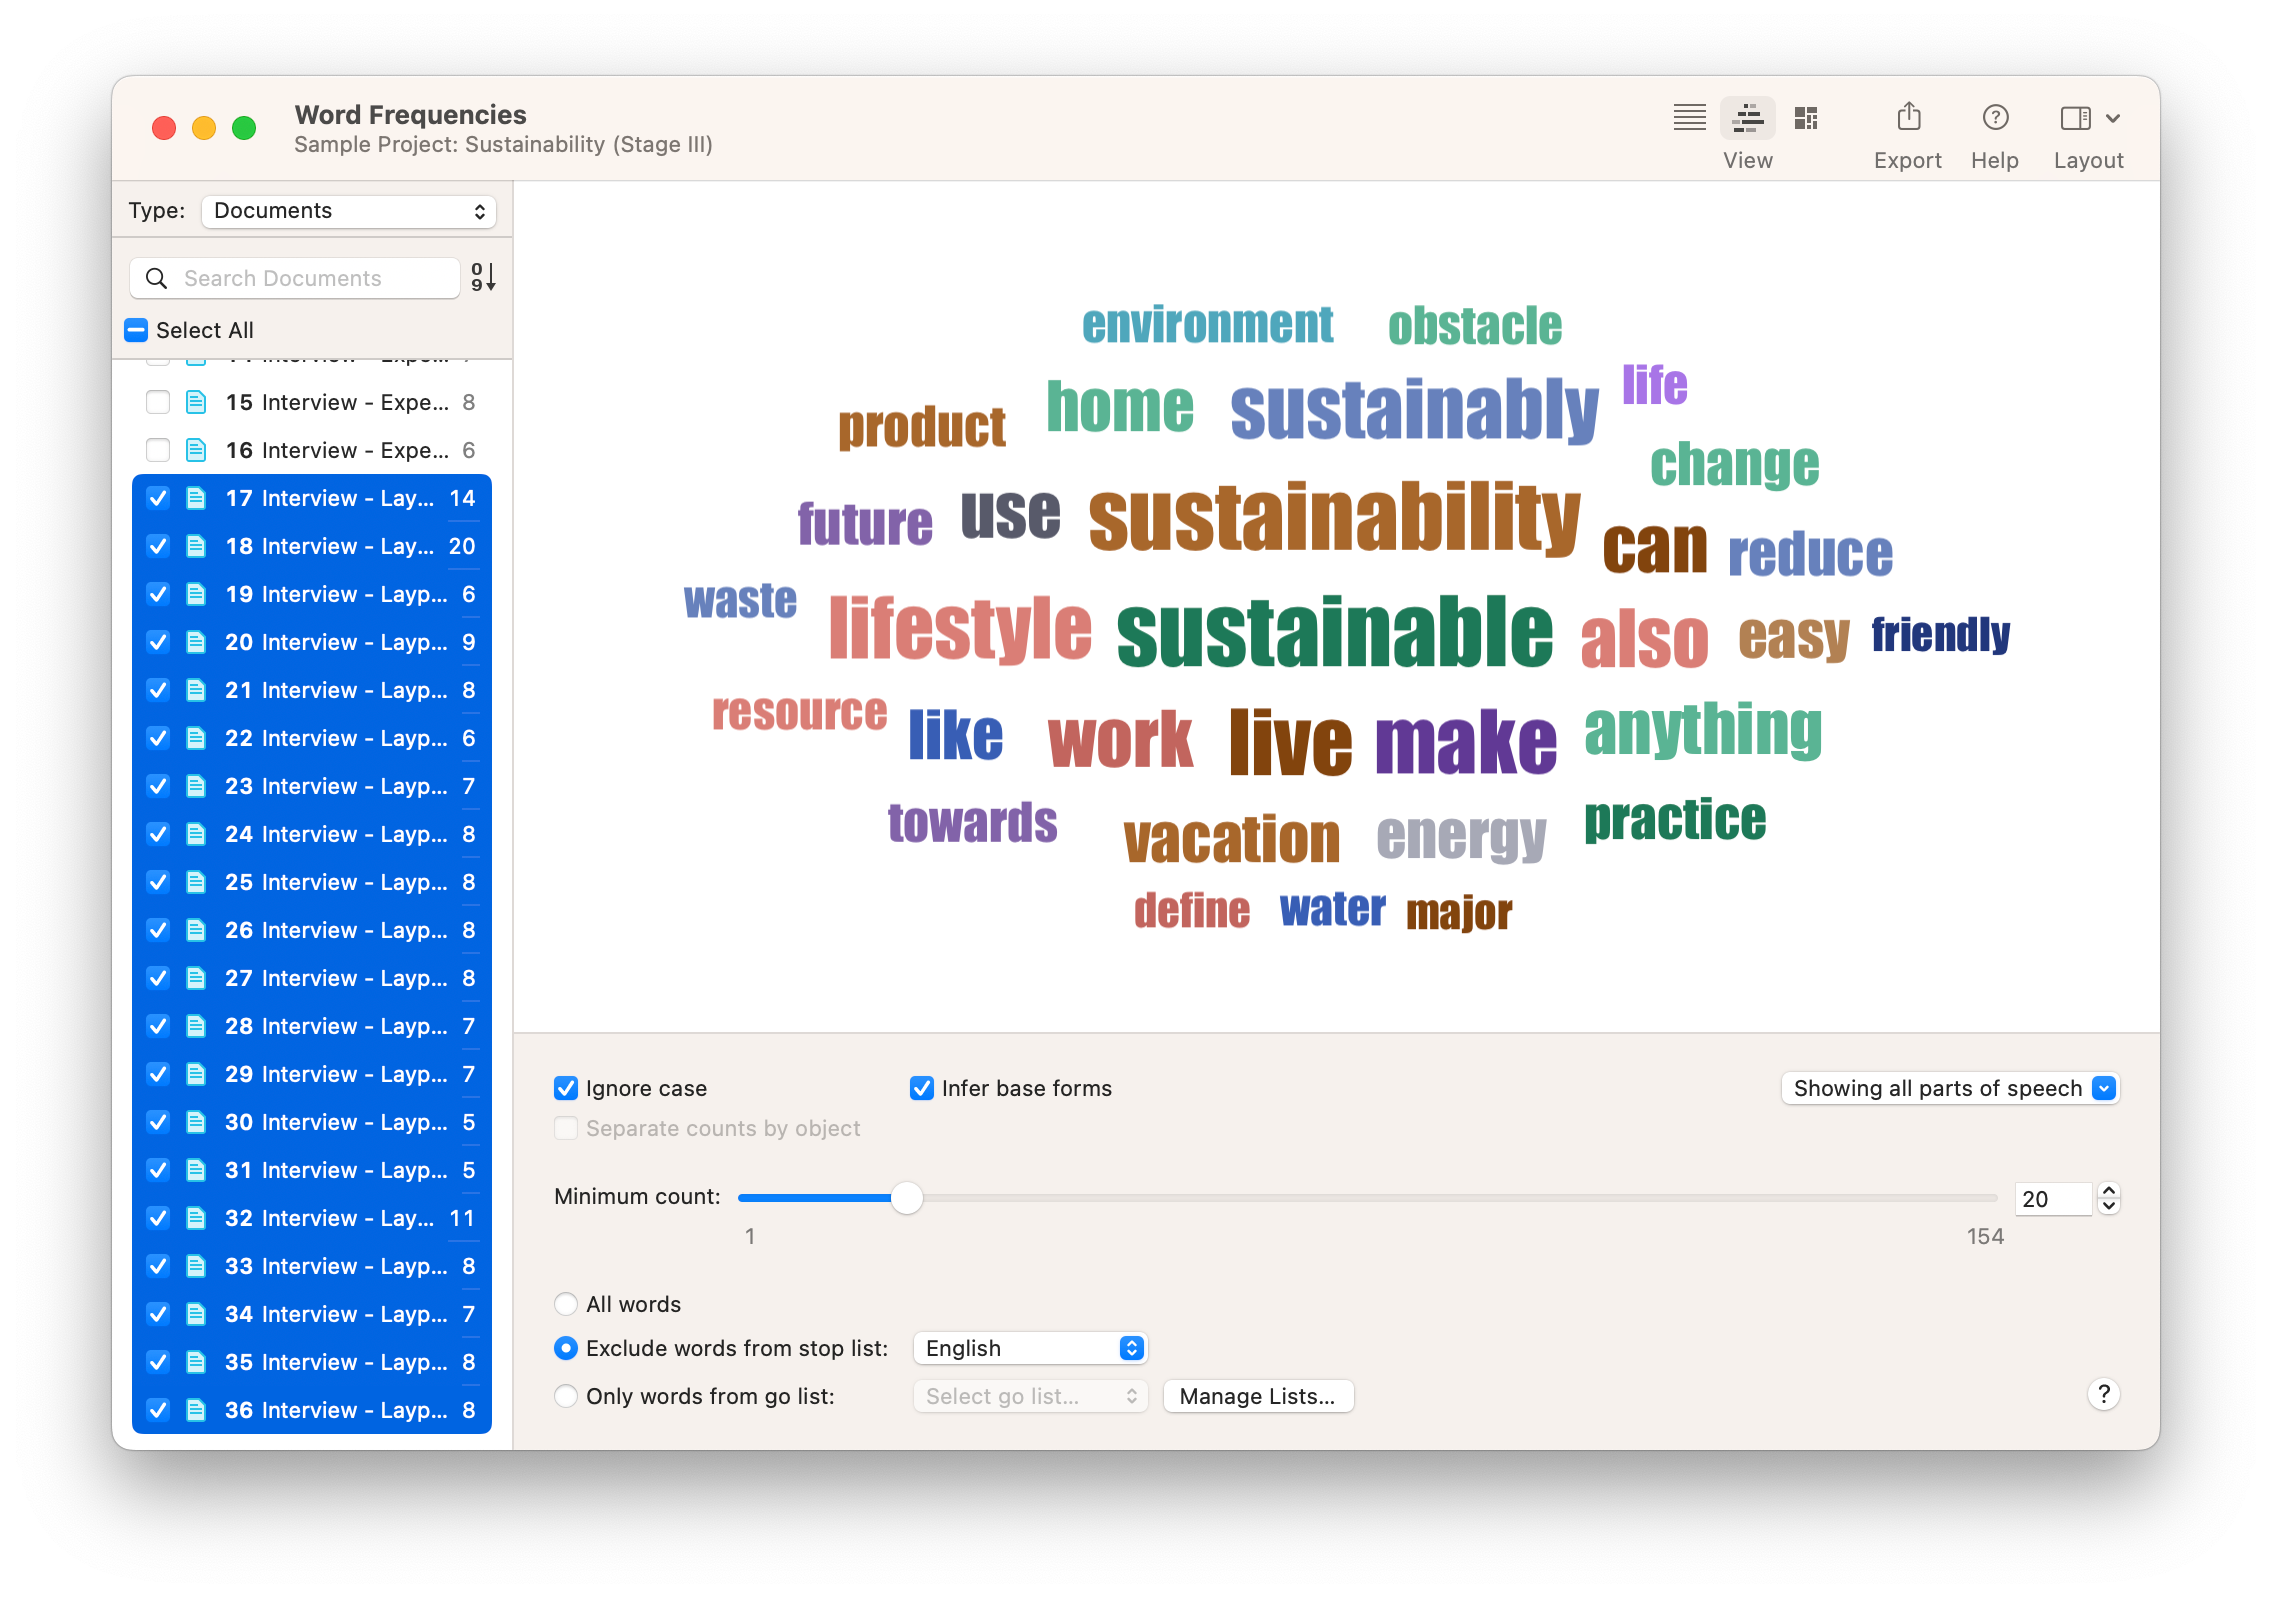
One popular method for this kind of analysis is content analysis, where the frequency of certain words, phrases, or codes can be statistically examined in visualizations like word clouds. Advanced software can also assist in this process, offering tools that can perform automated coding and thematic analysis on large datasets, although human oversight is generally recommended to ensure the qualitative nuances are not lost.
But remember, the process doesn’t end at the point of conversion. The quantitative data you generate should be viewed as a complement to your qualitative findings, not a replacement. Interpretation is the final step in this process. While quantitative data can provide a high-level view that makes it easier to identify trends or make comparisons, a qualitative analysis offers the nuanced context that gives these numbers meaning.
Should qualitative data be quantified?
The decision to quantify qualitative data is a nuanced one and depends on various factors including the research question, the type of data collected, and the intended audience of the research. But it's clear that, in the right circumstances, the conversion into numeric values can offer valuable advantages, such as the ability to use statistical tools for analysis, making it easier to identify patterns, trends, and correlations.

That said, it's worth remembering that not all research is best suited for quantification. For example, deeply personal narratives or highly complex social interactions may lose their richness if boiled down to mere numbers. The context in which phrases or themes appear may be just as important as the frequency with which they appear, and quantification can sometimes mask these subtleties.
Additionally, when converting qualitative to quantitative data, one must consider the type of quantitative data that will be most useful. Ordinal data, for example, allows for rank-ordering items but doesn't provide information on the relative degree of difference between them. If your data is rich in nuance and degrees of variation, then ordering data may not capture this complexity as effectively as other methods might. Ultimately, the decision to quantify information should be made judiciously, with a keen eye on how it contributes to the overall research objective.