
Learn What's New in ATLAS.ti 22
We listened carefully to our users and have streamlined and redesigned many areas of the program to even better accommodate users' needs and workflows. Numerous innovative new functions show the way where ATLAS.ti is further headed—and where it continues to lead the pack of similar products.
The sum total of these new features makes for an exciting and powerful new ATLAS.ti experience.
We sincerely hope you'll enjoy it!

- Learn What's New in ATLAS.ti 22
- Useful Information
- The ‘What’s New’ Document
- New Features
- Import word comments and PDF annotations
- Import Social Network Comments
- Create Code Hierarchies, Organize Codes in Folder
- Improved Survey Import
- Concept Search
- Analyze Parts of Speech in Word Clouds and Lists
- More Data Visualizations
- Analyzing Code Distributions
- Live Chat
- New License Models
- New in ATLAS.ti Web: Visualizations, Import
- Miscellaneous
Useful Information
Upgrades
If you have a license for ATLAS.ti 9, log into your account at my.atlasti.com to check on your upgrade options. If your purchase was after October 15, 2021, you qualify for a free upgrade.
If you have a license for an older version of ATLAS.ti, you can obtain an upgrade at a discount. Check for upgrade HERE .
Resellers
If you are a reseller and have questions about buying ATLAS.ti 22 and/or upgrades for your customers, write to [email protected].
The ‘What’s New’ Document
Whether you are new to ATLAS.ti, or switching up from an older program version, this document tells you everything you need to know to get started smoothly in ATLAS.ti.
Learn about your user account, how to transfer your existing projects (spoiler alert: it’s largely automatic!), and get an introduction to the central features and innovations of ATLAS.ti 22-this document is for YOU!
New Features
Import word comments and PDF annotations
When importing Word documents with comments, or PDF documents with annotations, ATLAS.ti automatically turns them into quotations. The notes you made in the documents can now be found in the comments of these quotations, so you can pick up right where you left off without having to look up or add this information manually.
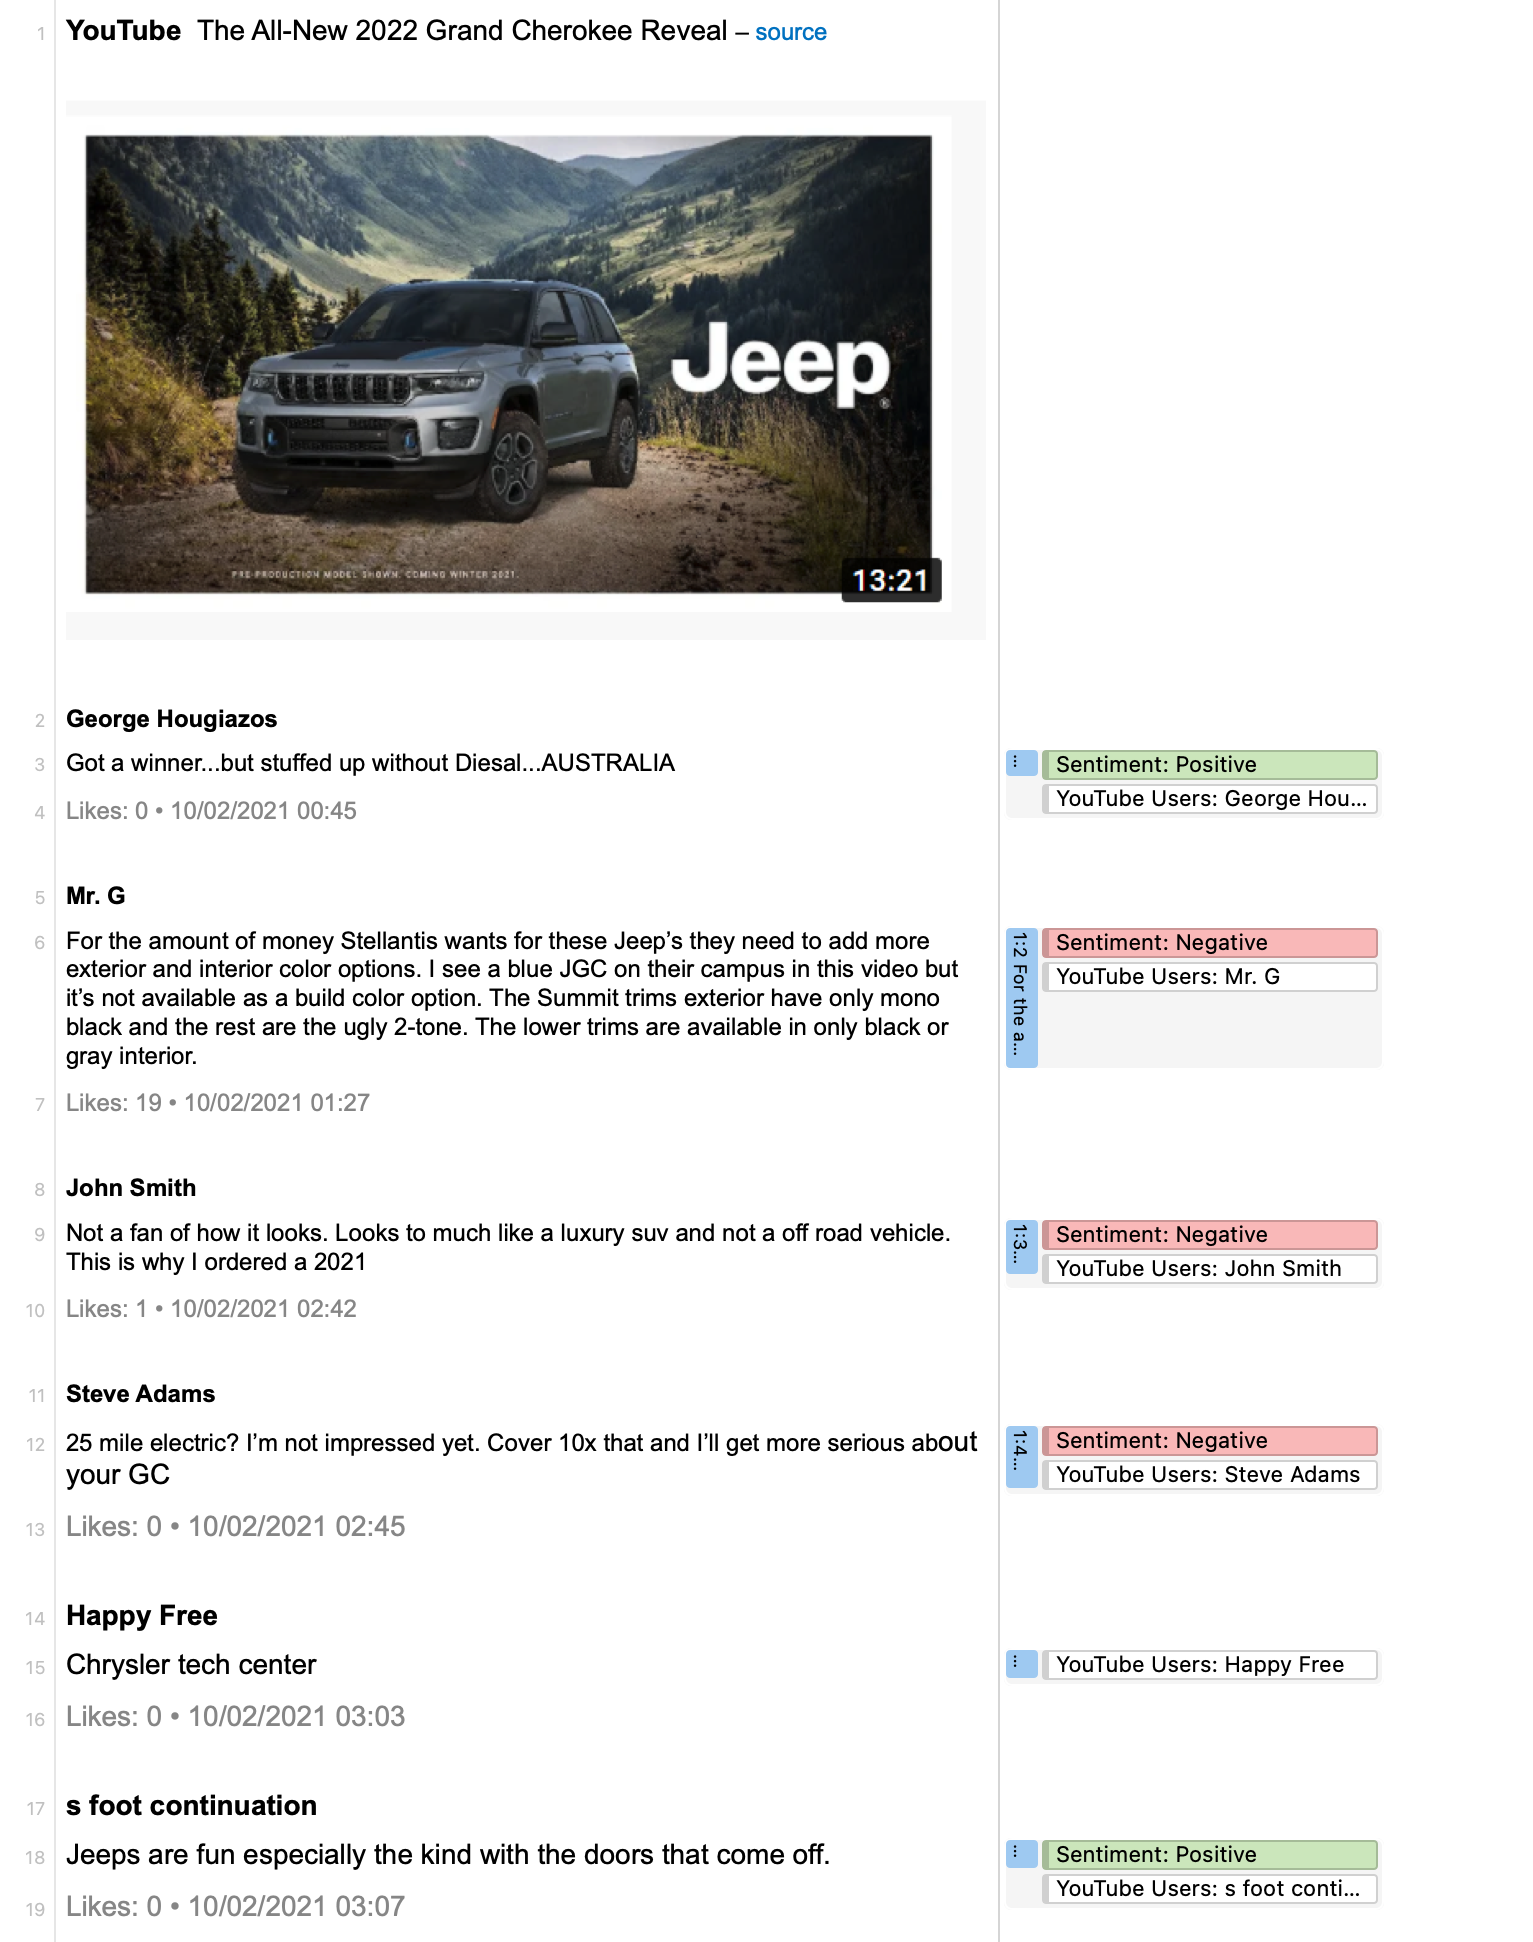
Import Social Network Comments
Social networks provide a powerful reflection of the structure and dynamics of the modern society. Often it is not a single tweet or post that is interesting, but the reactions and interactions of the social network users. There are many applications for analyzing user comments such as, social movements, brand communities, marketing campaigns, political discourse, discourses on currently relevant topics within a given community or society, understanding your audience, or even sh*t storms.
Supported social networks are Facebook, Twitter, Instagram, YouTube, TikTok, VK, Twitch, Discord, Steam. Below you see an imported social network conversation from YouTube on the new 2022 Jeep Grand Cherokee. ATLAS.ti auto-codes all users. In addition, a Sentiment Analysis has been conducted, looking for positive and negative statements.
Create Code Hierarchies, Organize Codes in Folder
ATLAS.ti 22 offers you new ways to organize your codes in the code system.
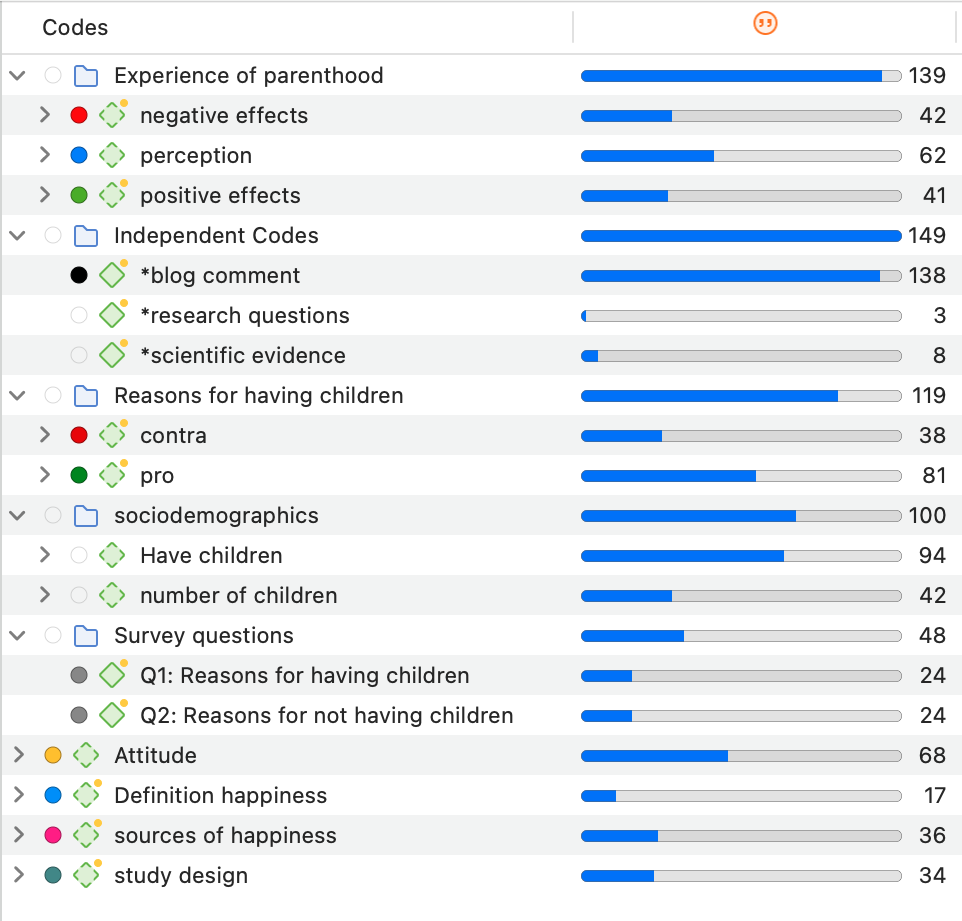
Another cool feature is that you can drag a category code to a data segment and select one or more of its subcodes for coding.
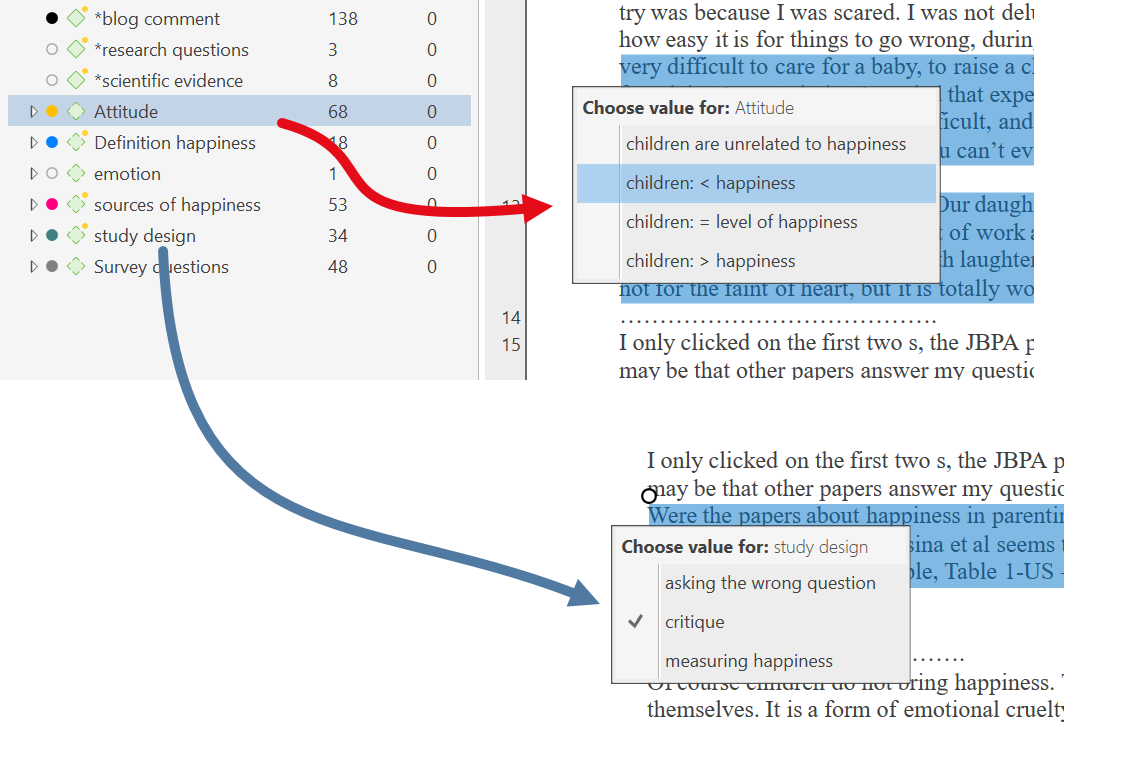
This also allows to query data on the aggregated level. You just select a category code if you want to analyze data on the aggregate level. If you want more detail, you select the subcodes. This is illustrated in the images below.
Analysis on the aggregated level
This does not only apply to all analysis tools.
Improved Survey Import
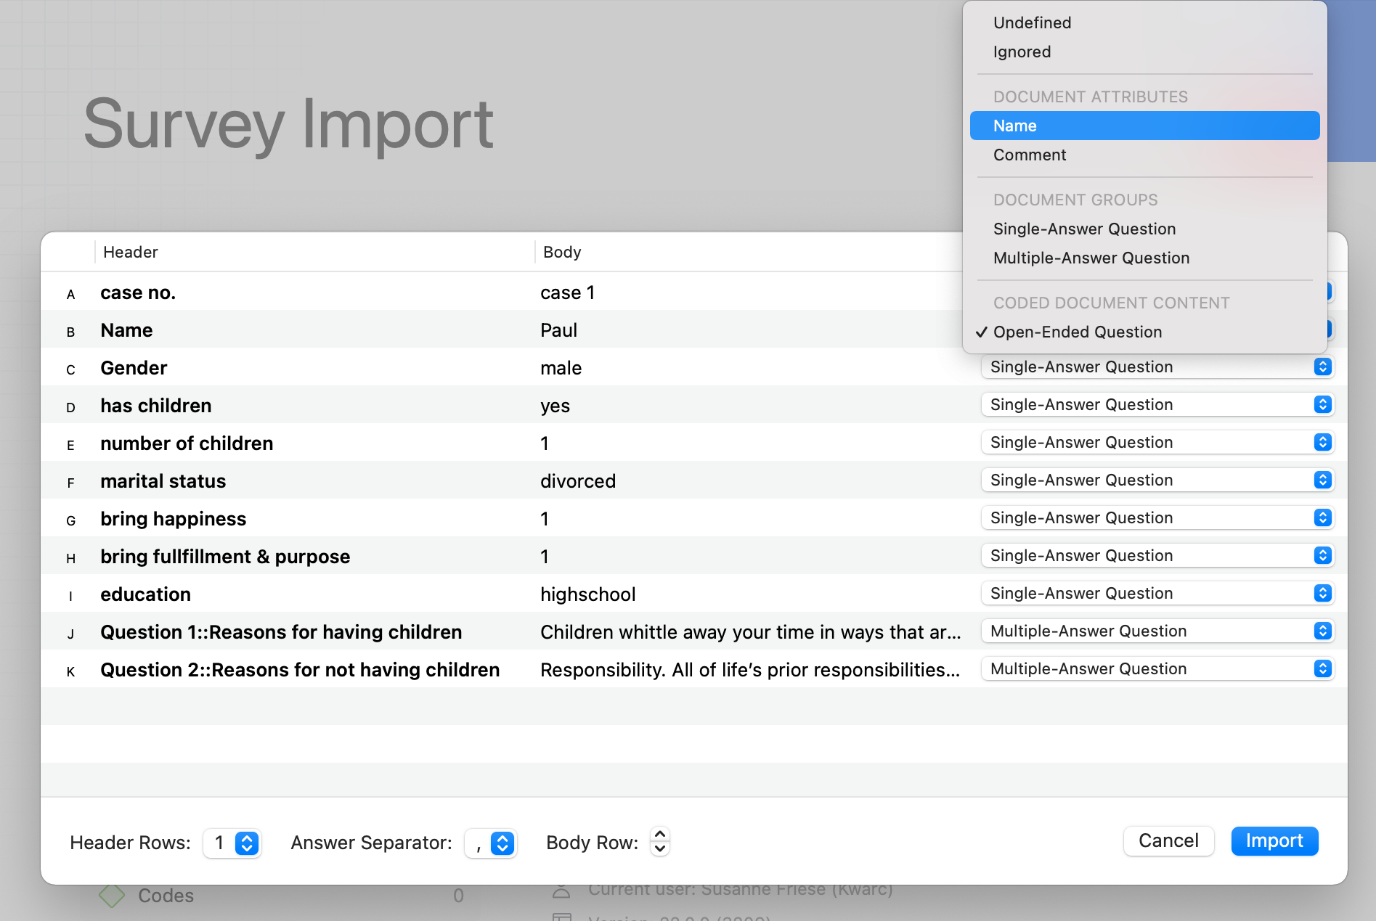
Good news for those working with survey data. We have simplified the import of survey data; there is no longer the need to add any syntax before importing. You can import data as it is exported from Google Forms, Survey Monkey, Qualtrix, and the like. With the help of a wizard, you can decide which data should be included or excluded, which data should be transformed.
Concept Search
This is a great new feature if you need to gain insights quickly. But there are numerous other applications, for instance to code literature for a literature review or to find information in larger reports. The concept search finds relevant concepts for you based on noun phrases. You can review results in context and can decide what you want to code.
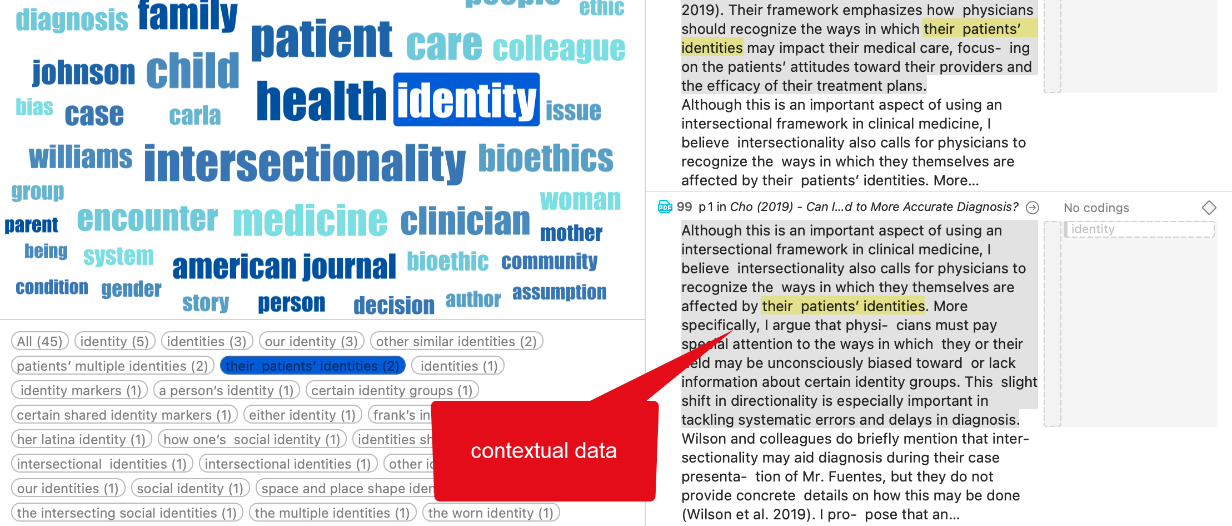
This function is available for all interface languages, and you can search for concepts in documents, document groups, codes, or code groups for concepts.
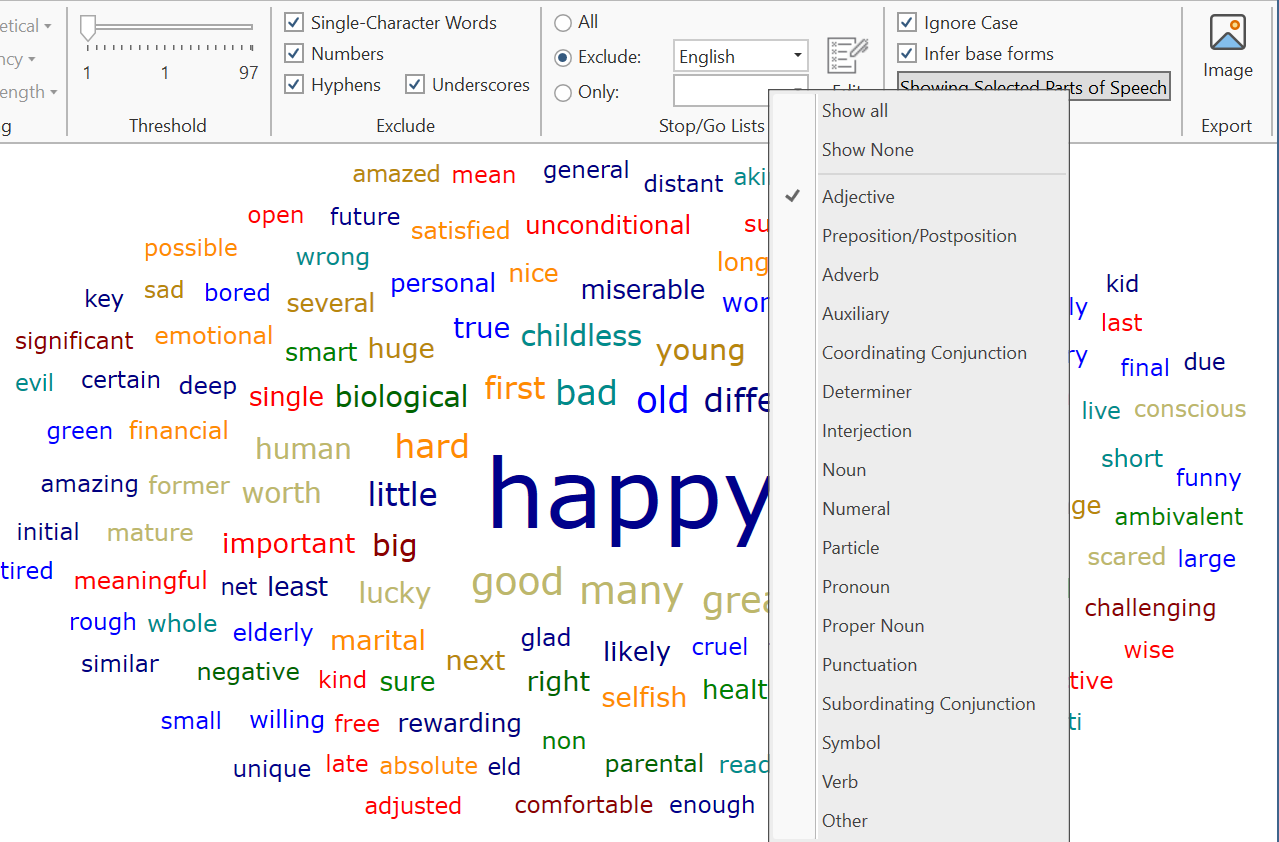
Analyze Parts of Speech in Word Clouds and Lists
The word clouds and lists received a further filter option. Filtering by parts of speech allows you to filter your data by specific grammatical elements (parts of speech) like adjectives, nouns, numerals, pronouns, etc. Below you see an example that only shows adjectives:
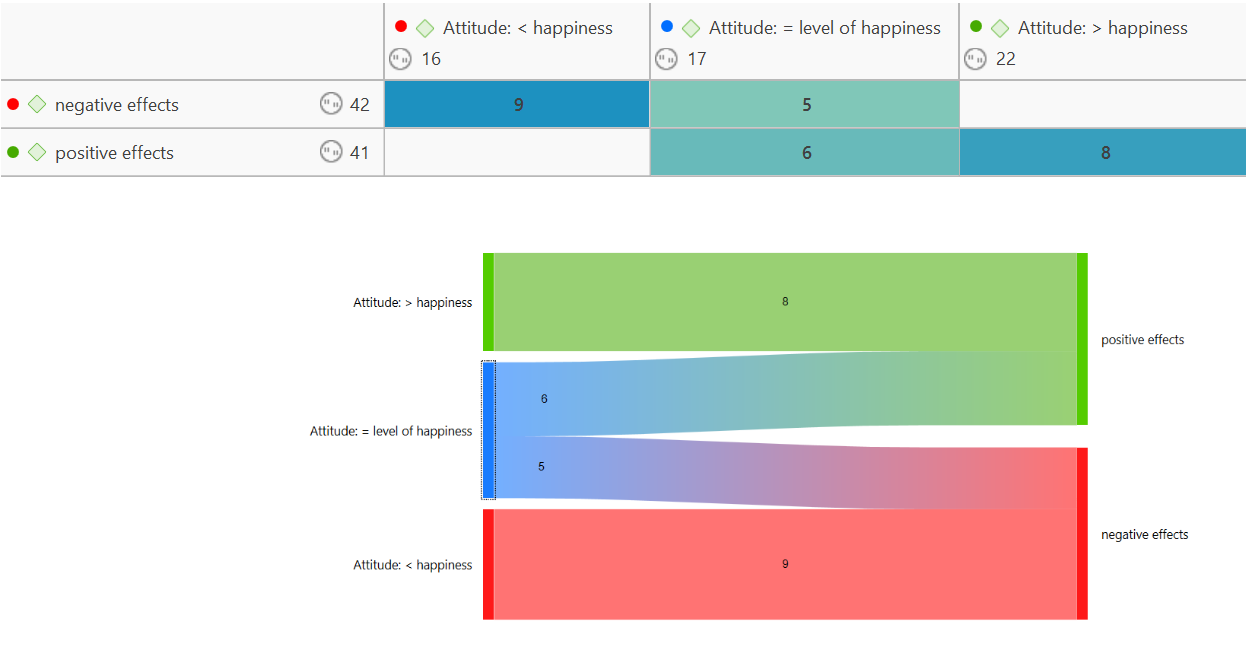
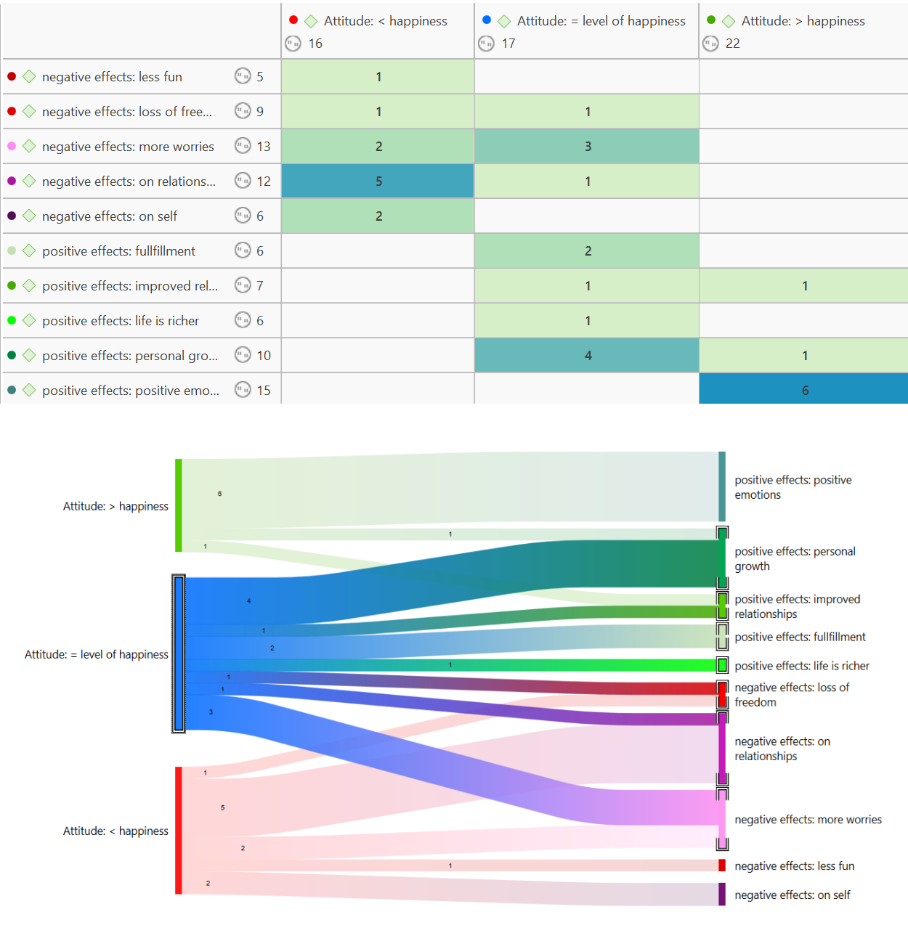
More Data Visualizations
Data Visualization is a great way to simplify the complexity of understanding relationships among data. The Sankey Diagram is one such powerful technique to visualize the association of data elements, which we introduced in version 9. In the new version you can also create bar charts as alternative views.
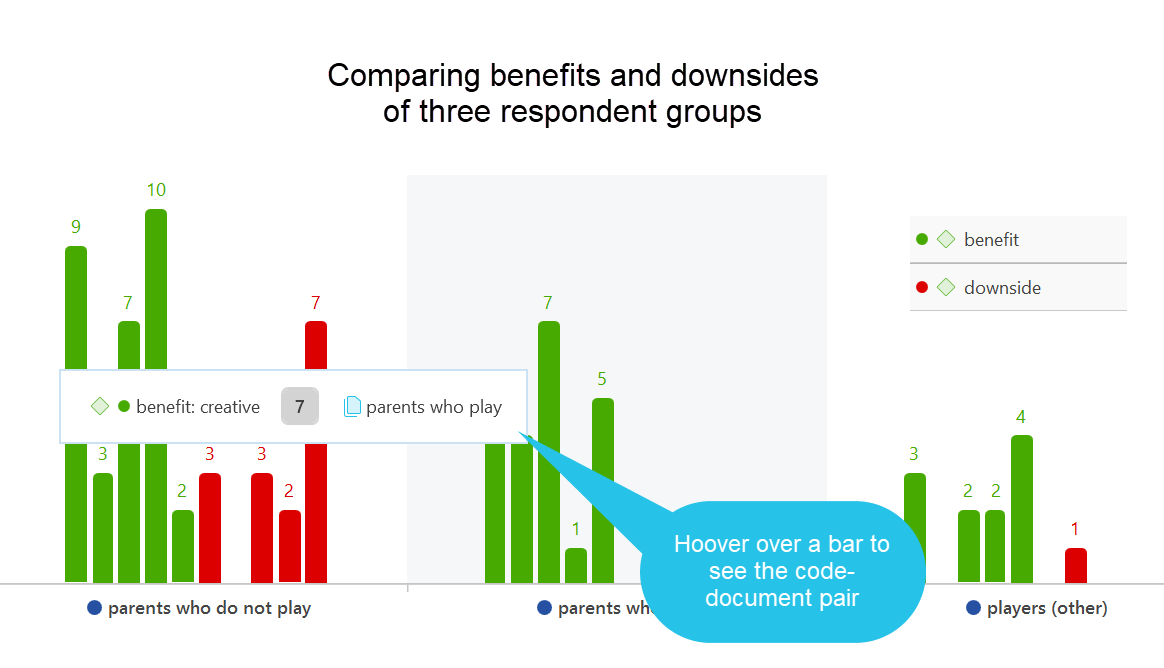
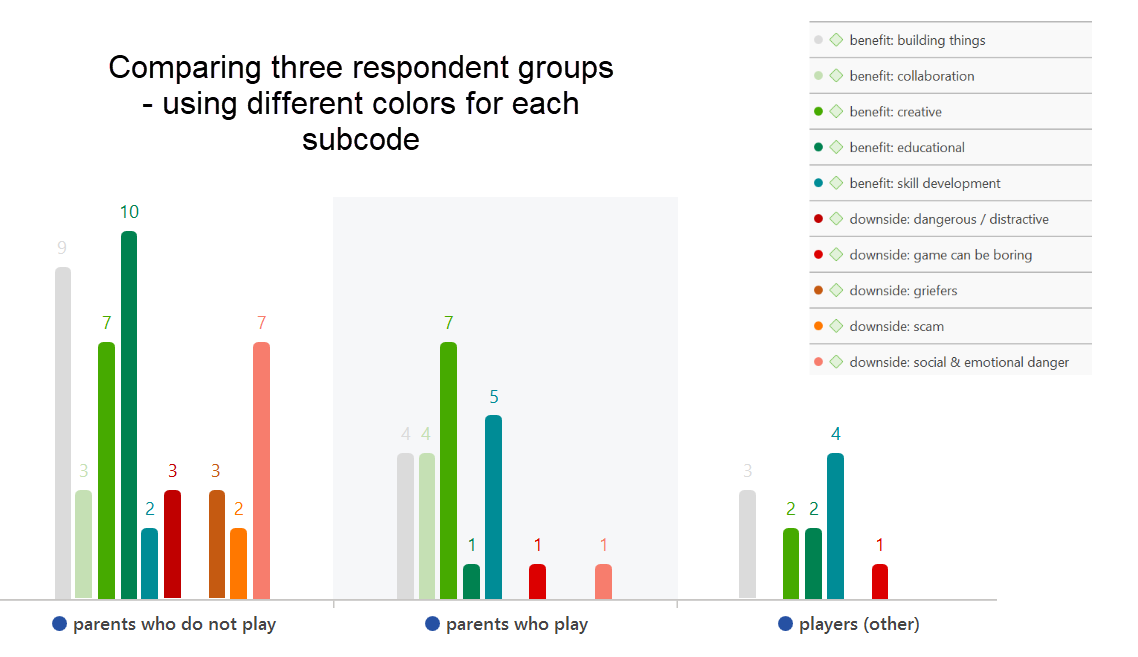
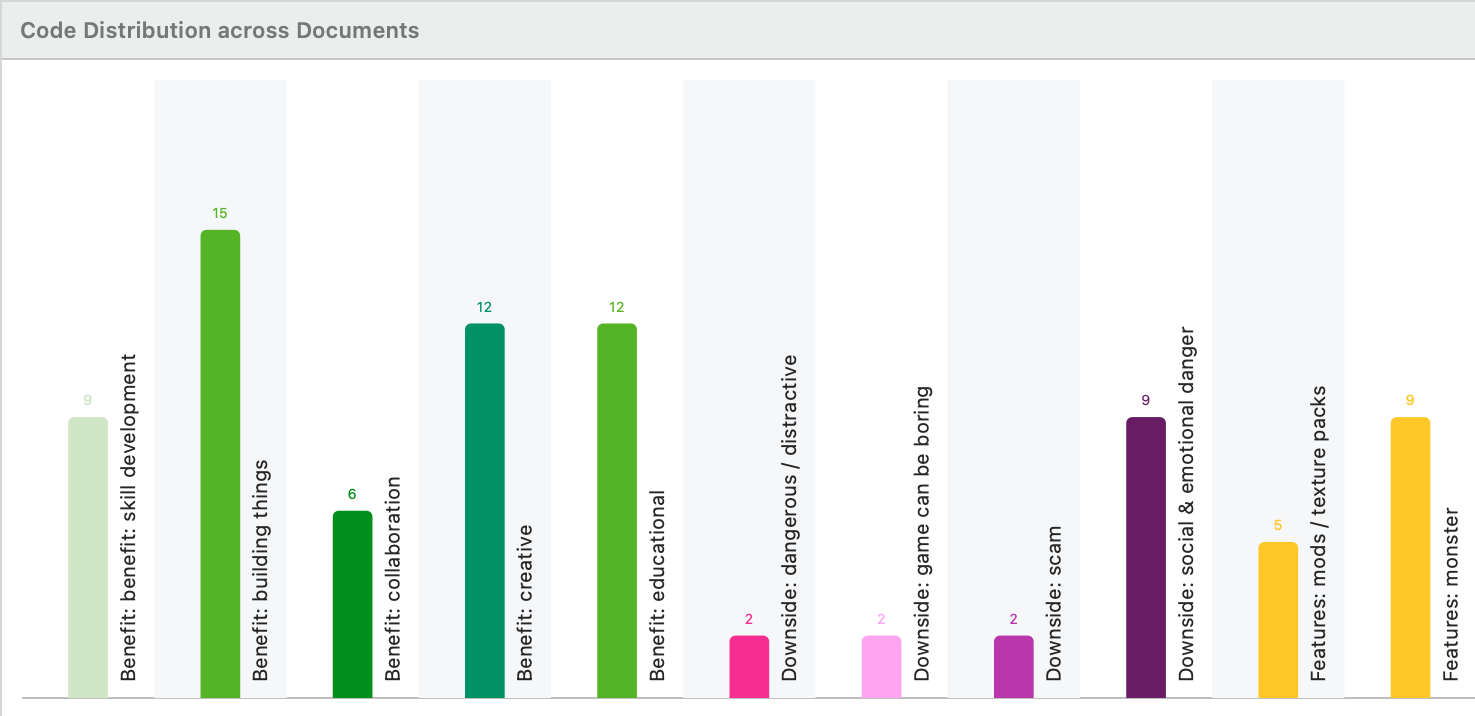
Analyzing Code Distributions
After having coded the data, a look at the code distribution gives you a feel for the data. Which topics were mentioned more or less frequently, by whom, is there a difference between different groups of respondents? How are the topics distributed? Code distributions are displayed in the Document Manager and in the Code Manager.
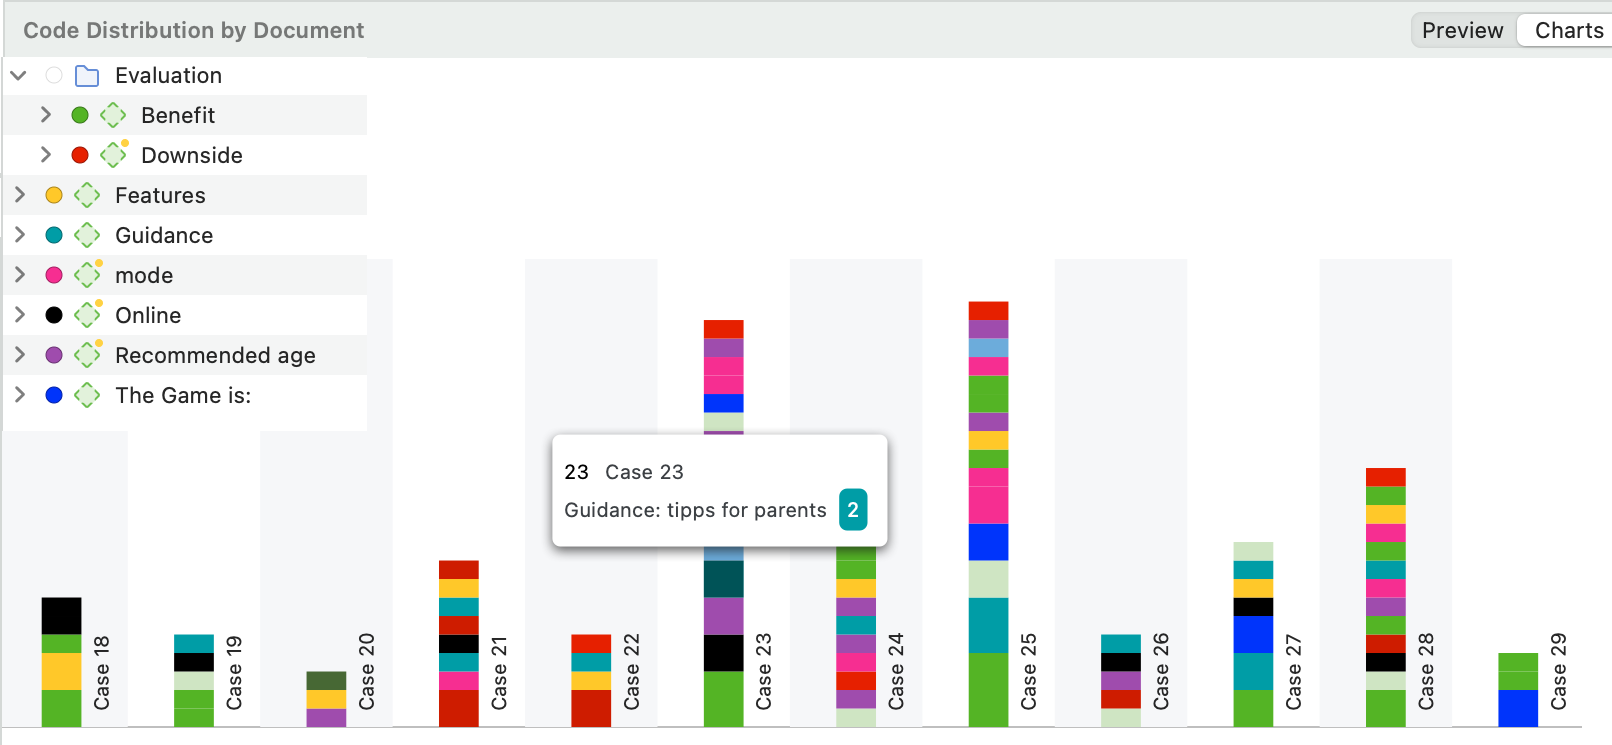
If you hover over a bar, the code label and its frequency is shown. If you double-click on a bar, the Quotation Reader opens, and you can read the data coded by this code.
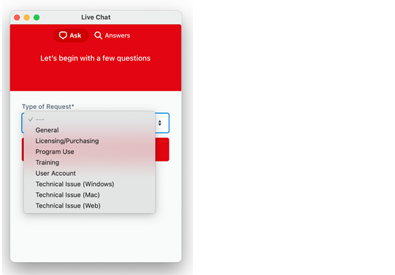
Live Chat
In addition to our email and telephone support, you can now also chat with us if you have a question or a problem. In ATLAS.ti Windows, you can access the Live Chat via the Help menu. In ATLAS.ti Mac, you find the Live Chat option in the toolbar.
New License Models
We introduce the 3-year subscription model. It gives you absolutely great value for the money: Receive all major version upgrades during the entire duration of lease, a lower lease price compared to the annual lease, the possibility to prepay for multiple years, thus being able to meaningfully invest available budget moneys, and a lower annual rate.
We are switching to subscription licenses to ensure that all users always have the same program version. In the past it has been shown that the cooperation of users with different versions has led to problems, which can be avoided if all have the same version.
This became more and more important since the ATLAS.ti Windows and Mac desktop versions are fluently compatible with each other, so that projects can be moved between them at any time forth and back and like that everyone can work in a mixed team and also since projects from the Web version can be imported to the desktop versions and vice versa. All this would be very complicated if our users would work with different versions.
Perpetual licenses, i.e. licenses that included a version with unlimited use, was purchased mainly because institutions and companies did not have certainty about future budgets. To accommodate this need, we have therefore introduced a three-year subscription that is paid in advance to solve this problem. An institution can now spend what it currently has in its budget and purchase a license that is valid for a minimum of three years.
New in ATLAS.ti Web: Visualizations, Import
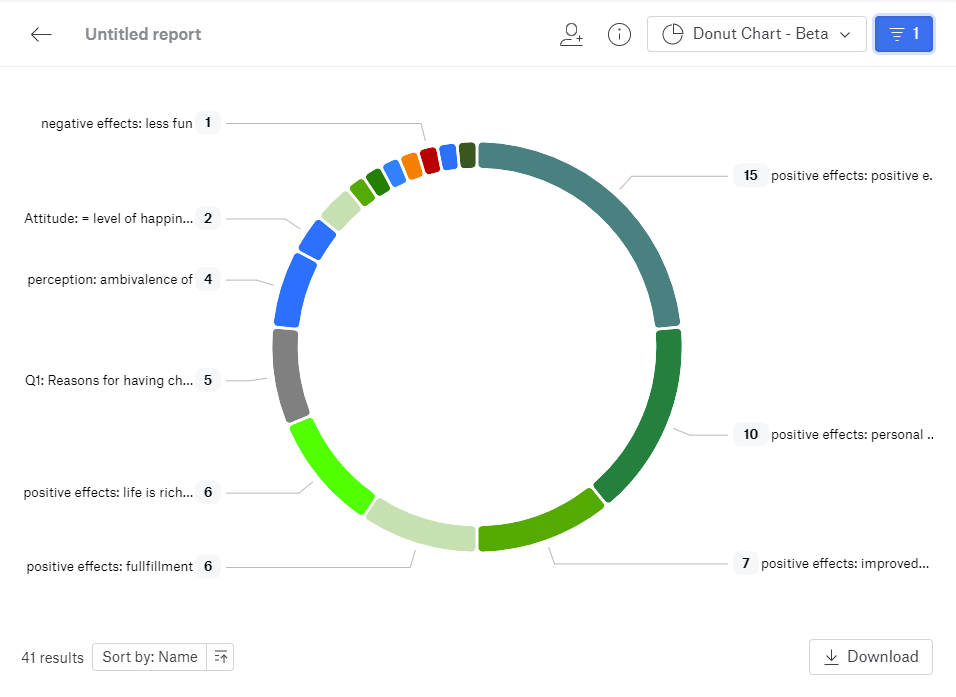
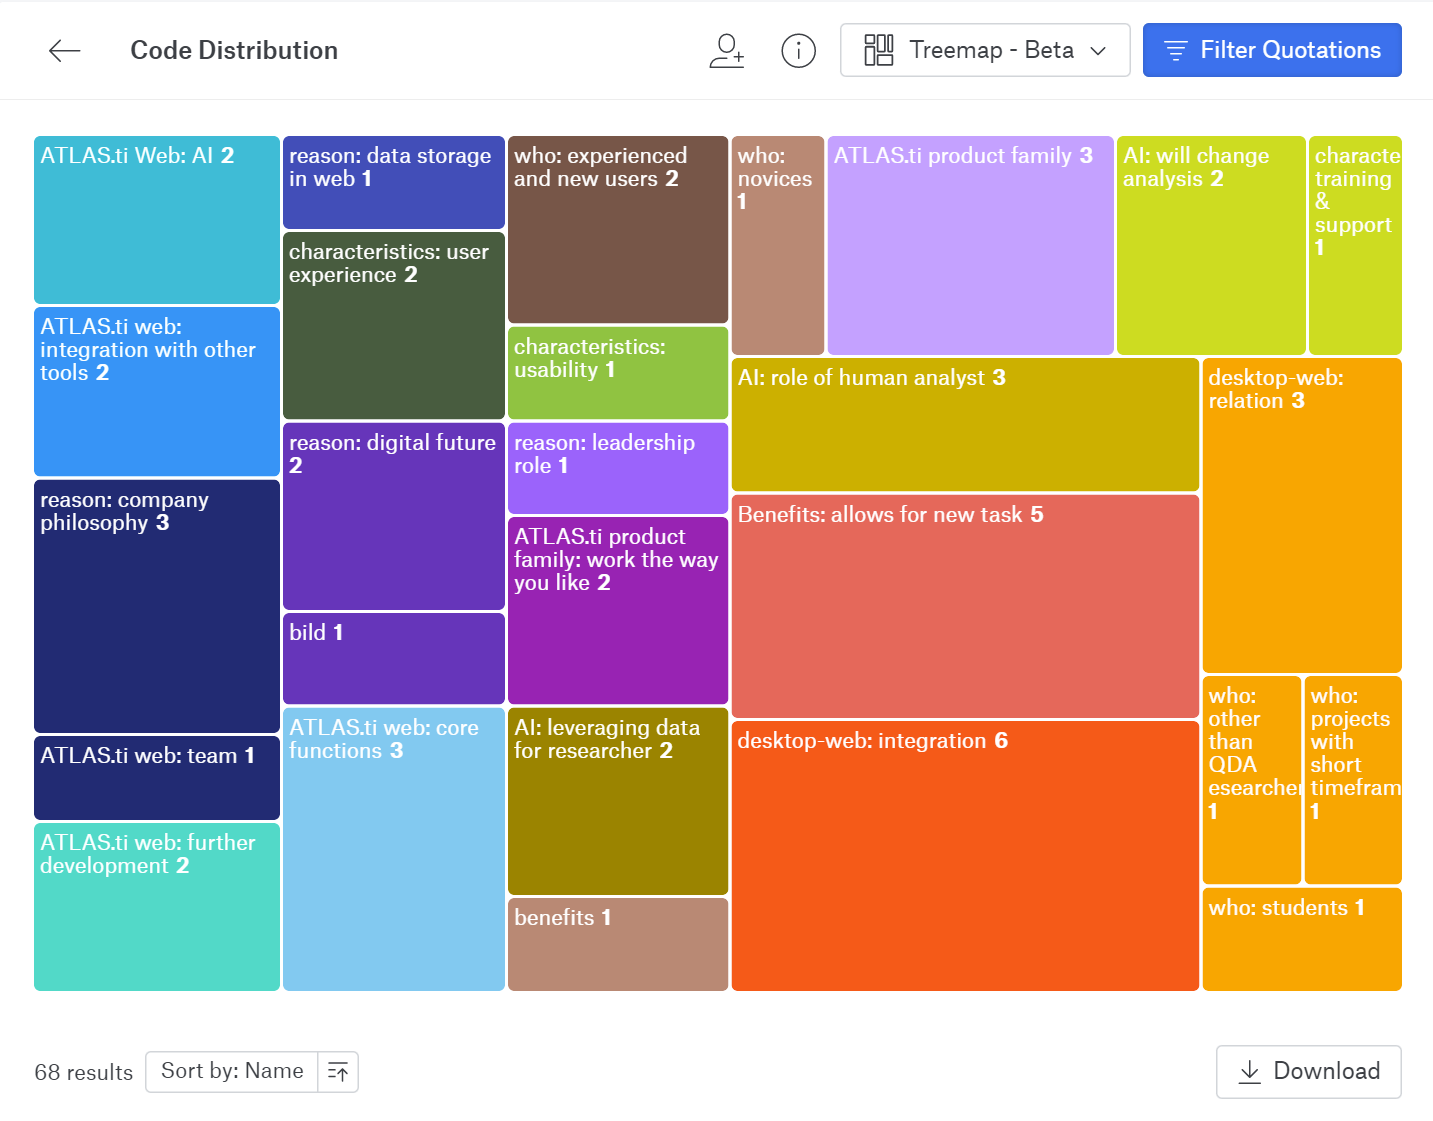
We have added great new visualizations in ATLAS.ti Web (see above examples of a Donut Chart and a Tree Map), as well as the possibility to import ATLAS.ti 22 projects from the Windows and Mac versions.
Miscellaneous
We have added synonym lists for all interface languages and improved the database so you have more and better choices.
For data import from reference managers, we now also support the .bitTex format. Combined with the Endnote .xml format, this gives you an almost 100% compatibility with all reference managers.
We have extended the range of file types that ATLAS.ti Windows can read. The following file types can be imported and transformed into PDF documents:
-
eBooks in. epub and .mobi formats
-
Microsoft Visio and Libre Office / OpenOffice Draw
-
PowerPoint slides
The interface has a fresh new look. When you open a project, information about your project like its comments, number of documents, codes, etc. will be displayed on the screen:
We have reorganized and extended the context menus. For instance, adding code colors is available from the code context menu.
In the Windows version, you can now also merge codes via drag & drop. Further, you can edit a comment in the Apply Coding window and in the comment area of the project navigator and the browsers. Previously you could only view them.
We have simplified number functions, like removing the code tree and code forest, transitive relations in the Relation Manager, and semantic operators in the query tool. All of these are now no longer necessary, as a true hierarchy for codes is available. Being able to simply select a category to retrieve all the quotations of its subcodes has made the semantic down operator obsolete. Selecting multiple subcodes and retrieving their quotations has made the sibling operator obsolete.
And last but not least, a secret favorite for at least some of us on the team - the new project bundle icon in the Mac version. Isn't it adorable?