Using the quotation manager in ATLAS.ti Web to answer your research questions

- Introduction
- What does the quotation manager have to do with answering research questions?
- An applied example
- Wrapping up
Introduction
What are “quotations”, and why are they important for qualitative data analysis in ATLAS.ti? To begin condensing and making sense of all the rich information in your qualitative data, you can select each and every relevant or interesting bit of data – these are your quotations. Quotations thus form the most basic unit of analysis from which you can build your coding and analysis of the patterns and themes underlying your data.
In this best practice article, we will share some practical tips for querying your data in ATLAS.ti Web to find the answer(s) to your research question(s). In any piece of research, the most important thing that drives the whole research process is the research question. The research questions you pose serve as a crucial guide for deciding which qualitative methodology to utilize: what data to examine, how to collect it, and how to analyze it in order to provide an answer to your research question(s). Thus, once the data has been coded, you can query your quotations and codings to explore the relevant data that will help you answer your research question(s). ATLAS.ti is a flexible tool that can be adopted within just about any qualitative approach and facilitate your journey from conducting a literature review to analyzing your data to elaborate answers to your research question(s).
What does the quotation manager have to do with answering research questions?

The quotation manager makes it easy for you to see and explore all of the quotations in your project. You can save stand-alone quotations, and you can associate codes to your quotations to organize and index your data. You can examine all your quotations, their associated codes, any comments you wrote, and you can query your data by applying a variety of flexible filters. You can find more advice on using filters in the quotation manager in our best practices article here.
A typical workflow may proceed as follows: a researcher notices there is some phenomenon in their field that lacks a coherent explanation or framework, so they pose a research question regarding this phenomenon of interest. The researcher then needs to decide which methodology is best suited for helping them answer this research question (e.g., should a deductive or inductive approach be used, should data be collected from a specific case or a broader group of people experiencing the phenomenon, should data be analyzed to identify perceptions or processes, and so on). There are a great variety of qualitative methodologies, data, and analysis strategies, and we strongly encourage researchers to consider the range of approaches that may be helpful for them in their particular studies. On the other hand, we also understand the difficulties of navigating through all this information and making sense of which approaches are appropriate or not. For those interested in seeing an overview of different qualitative methodologies, you can find more information here. Once the research design has been laid out, the researcher then begins collecting and analyzing the data. This data can be imported to ATLAS.ti Web and coded to condense and synthesize the rich array of qualitative information. A code can be a word or short phrase that captures something in the data – a code is essentially a “tag” that you can attach to quotations to organize all the different bits of data. You can find more detailed information on coding data here.
A very common dilemma qualitative researchers experience is figuring out how to make sense of all of the different segments of data and growing list of codes. After getting immersed in the data and extensively coding all of the different characteristics, concepts, patterns and so on that are present in the data, it is all too easy to feel one has lost their way along this winding path of qualitative analysis. If you ever find yourself in this situation, this is exactly when we recommend going back to your research question(s) and methodology – “take a step back” from your analysis and think about how your codings and data analysis are leading to an answer to your research question(s). With your data coded and research question(s) in mind, you can open the quotation manager and begin querying the data. Filter your coded data to contrast the different findings so that you can more easily identify the answer(s) to your research question(s).
An applied example
When you create your account in ATLAS.ti Web, you can see the Demo Interview Project, which is an already-coded project that you can explore to try out the different features of ATLAS.ti Web. In this project, we interviewed three of the main people who are behind the creation of ATLAS.ti. Some of the research questions of interest were:
- How do members of the top management team and members of the training team perceive the benefits of using online qualitative data analysis software?
- How are the characteristics of a good CAQDAS (computer-assisted qualitative data analysis software) related to an online CAQDAS?
Once the data has been coded, we can “ask” our questions using the quotation manager and explore the data that can help us answer these questions. Thus, to examine the different perceived benefits that were mentioned by members of the top management team and members of the training team, we will apply some filter rules to compare and contrast the identified quotations:
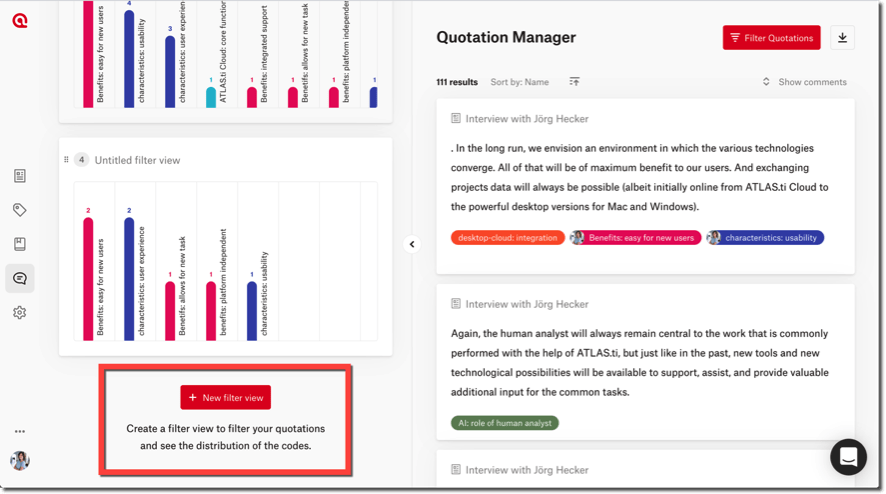
- Open the quotation manager
- Click on “New filter view”

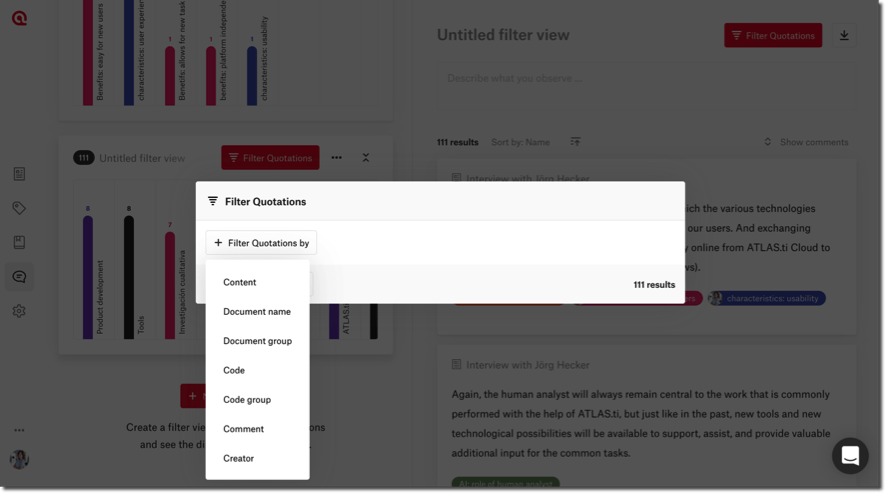
- Click on “Filter quotations” to add some filter rules
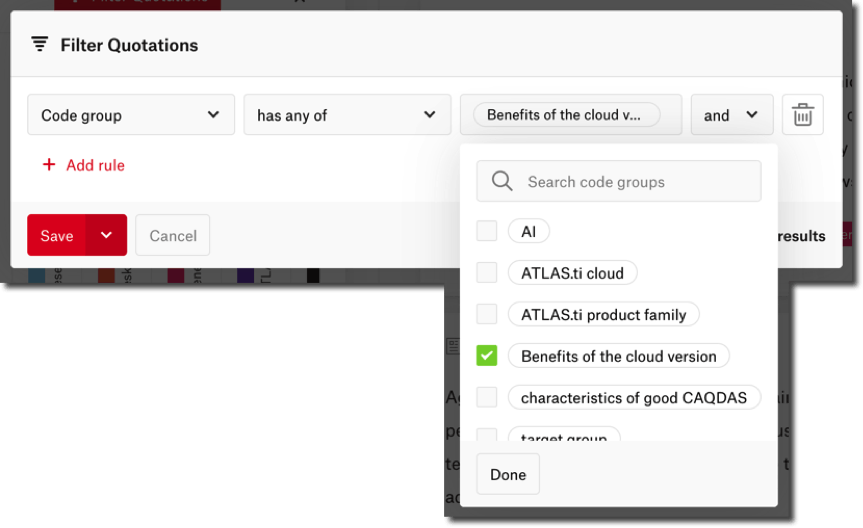
- You can filter your quotations based on a variety of parameters: by the content of the quotation, the document name (from which the quotation comes), the document group (from which the quotation comes), the code (that is attached to the quotation), the code group (that has a code attached to the quotation), the comment (written on the quotation), and/or the creator (of the quotation). For this example, we first want to see what participants said about the benefits of ATLAS.ti Web. We have several codes about these benefits, and we grouped them together in a code group called “Benefits of the Web version” (you can find more information about creating groups here). Since we want to see everything we found about benefits, we will select the parameter “Code group”.
- Then, we select the code group we are interested in: Benefits of the Web version
- However, we do not just want to see all of the data we have on benefits; rather, we want to particularly see what members of top management said. So, we will add another filter rule by clicking on the “Add rule” button.
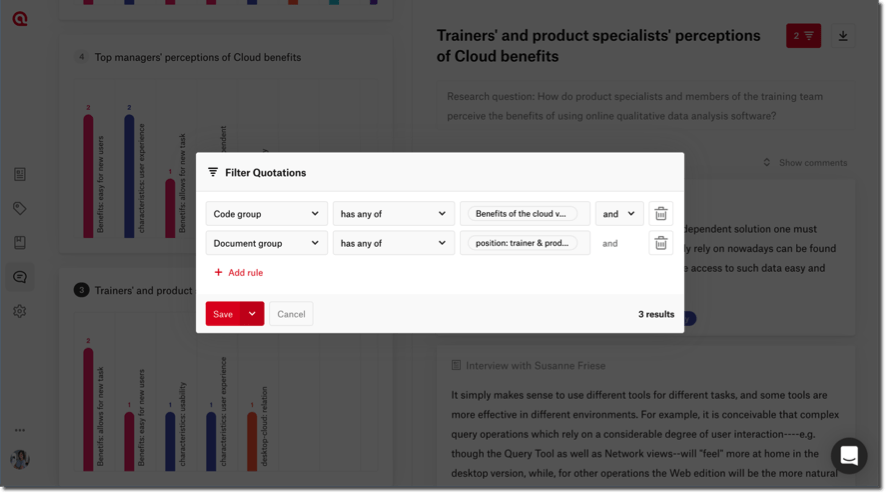
- Once again, we can specify what we want to filter the quotations by; now, we will select the parameter “Document group” and we will select which document group we are interested in. Here, we want to see the quotations that come from any of the documents (i.e., interviews) that were done with the members of the top management team. So, we will select the document group “position: company CEO”.
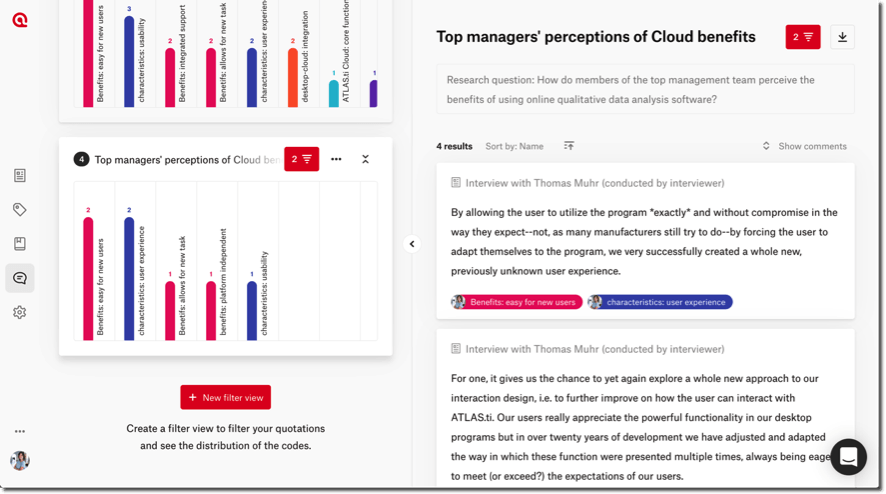
Click on the “Save” button. Now the filter view is saved, and we can see this new filter view on the left-hand side of the quotation manager along with a nice bar chart visualization of the frequencies of these codes. The resulting quotations that match the filter rules appear on the right-hand side.

- You can now add a title and description to your filter view. In this case, we put a descriptive name (“Top managers’ perceptions of Web benefits”) and we put our research question in the description space below the title. You can thus view all of the resulting quotations, which documents they come from, which codes are attached, and any comments that you wrote on the quotations. You can also easily download this list of quotations as an Excel file by clicking on the download button in the upper right-hand corner.
Now we can easily see all of the relevant data which will help us describe the CEO’s perceptions of the benefits to the Web version of ATLAS.ti. We can reflect on what was said and write our analytic notes in a memo. To continue answering our research question, we will repeat the above steps, but this time we will gather the data from members of the training team (i.e., we will select the document group “position: trainer & product specialist”). We can thus save another filter view to capture their perceptions.

You can save as many filter views as you want, so you can take advantage of the interactive quotation manager to filter and organize your developing insights. We now have two saved filter views, and we can easily switch between them to see what the CEO said and what the product specialists and trainers said.
Any combination of filter rules can be applied to query your data. For example, our second research question was “How are the characteristics of a good CAQDAS (computer-assisted qualitative data analysis software) related to an online CAQDAS?” To find the data that can help us answer this research question, we will create another filter view. This time, we want to see the data from all of our participants, but we want to filter according to the codes attached.
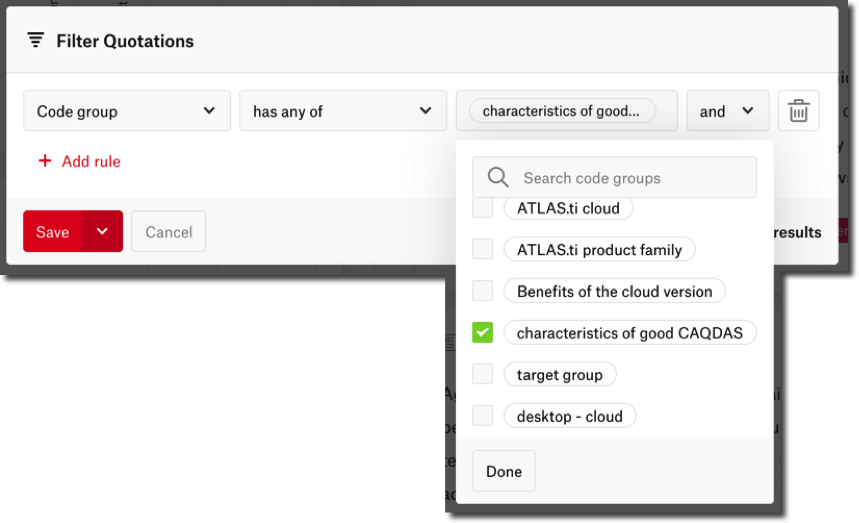
- Create a new filter view and set new filter rules. On the one hand, we want to see all of the data regarding the characteristics of a good CAQDAS. We had several codes about characteristics, so we also created a code group of these. Therefore, in the filter rule, we will select “Code group” and “characteristics of good CAQDAS”.
- We also want to see the data regarding the benefits of working with an online software, so we will add another filter rule to see quotations that come from the code group “Benefits of the Web version” (just as we did earlier).
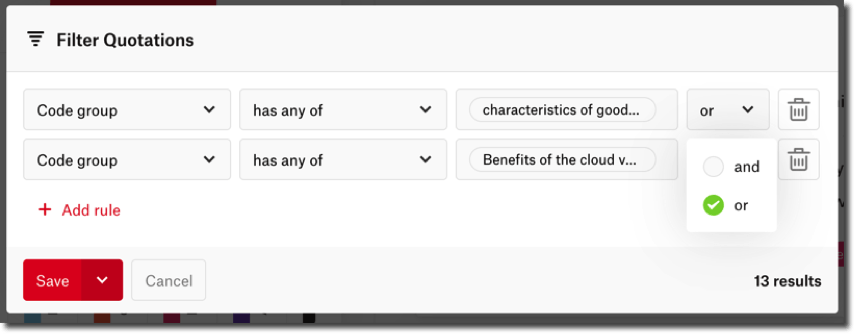
- We can also always specify whether we want ATLAS.ti Web to filter for quotations that match all of the rules or at least one of the rules. When adding more than one rule, you can choose whether you want ATLAS.ti to filter for “Rule 1 and Rule 2” versus “Rule 1 or Rule 2”. What is the difference? If we select “or”, this will show quotations that come from either of the two code groups we selected (i.e., the data is regarding characteristics, benefits, or both). If we select “and”, then we will only see the quotations that have a code from the first group as well as a code from the second group (i.e., the data regarding both characteristics and benefits simultaneously). Since we want to examine our overall findings on the characteristics of good CAQDAS relative to the benefits of the Web version, we can select the “or” operator here.
We can save the filter view and add our title and description. Now, we can see everything we found about characteristics of good CAQDAS, benefits of the Web version, and we can see where the two overlap (i.e., quotations that have both kinds of codes attached). You can also choose how you want the quotations sorted (e.g., should they appear in ascending/descending order by name, comment, document name, number of codes, creation date, or last update).
Wrapping up
With this present article, we wish to provide practical advice on harnessing the quotation manager in ATLAS.ti Web to easily query the data, but our main objective is to provide some applied examples to illustrate how the quotation manager may be utilized to answer research question(s) of interest. All saved filter views will always appear in the quotation manager, so you can even continue adding new documents, coding them, and analyzing your data; if any new data fits your saved filter rules, they will also automatically appear in the corresponding filter view. The bar charts also make it easy to visualize how many quotations are attached to each code. You can download any of your quotation lists as Excel files so you can view them offline, as well. We hope ATLAS.ti Web serves you well in facilitating exploration of your queried data, documenting analytic insights in memos, and elaborating the answers to your research questions.