Sentiment analysis in ATLAS.ti Web

- Introduction
- How does it work?
- Further explorations of sentiments
- Wrapping up
- How to cite "Sentiment analysis in ATLAS.ti Web"
Introduction
Understanding people’s reactions and evaluations is a common goal in research, and this is why analysing the positive, negative, and neutral sentiments expressed in data can be so valuable. ATLAS.ti now has an integrated tool that uses artificial intelligence models to automatically analyse the sentiments expressed in text data. In this article, we show how you can take advantage of sentiment analysis in ATLAS.ti Web.
How does it work?
Once you have created your project in ATLAS.ti Web and added your documents (your data), you will then need to create the codes that you would like to use for the sentiment analysis. Then, you can open the document you want to analyse, and click on the sentiment analysis tool. You can tell ATLAS.ti Web whether you want it to search for and code sentiments in individual sentences or paragraphs. Add the codes that you want to associate to each find that expresses a positive, negative, and/or neutral sentiment. You can then see all of the results in that window, and simply click on “Code results”, and ATLAS.ti Web will automatically save a quotation and associate the corresponding code to show the sentiment that is expressed in each sentence/paragraph! To summarise, the exact steps are:
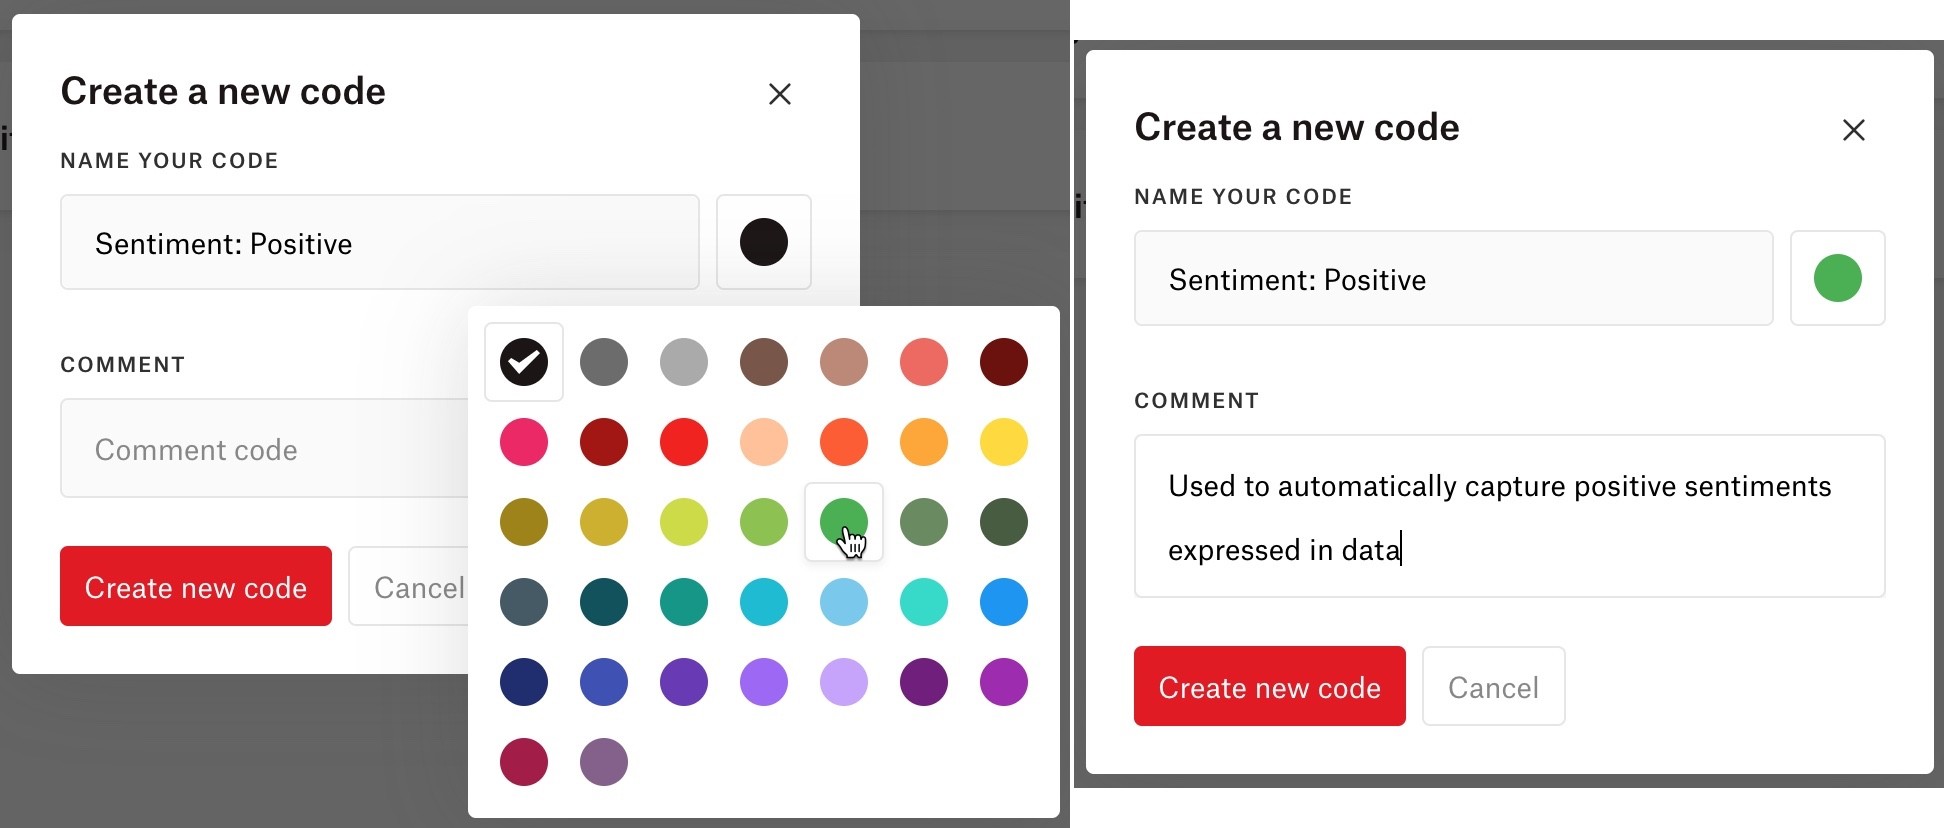
- Create the codes you want to use for sentiment analysis (e.g., “Sentiment: Positive”, “Sentiment: Negative”, and “Sentiment: Negative”). You can also choose a colour for each code and write a comment on each code (e.g., to indicate that these codes are for the automatic coding of sentiments) (see Figure 1)
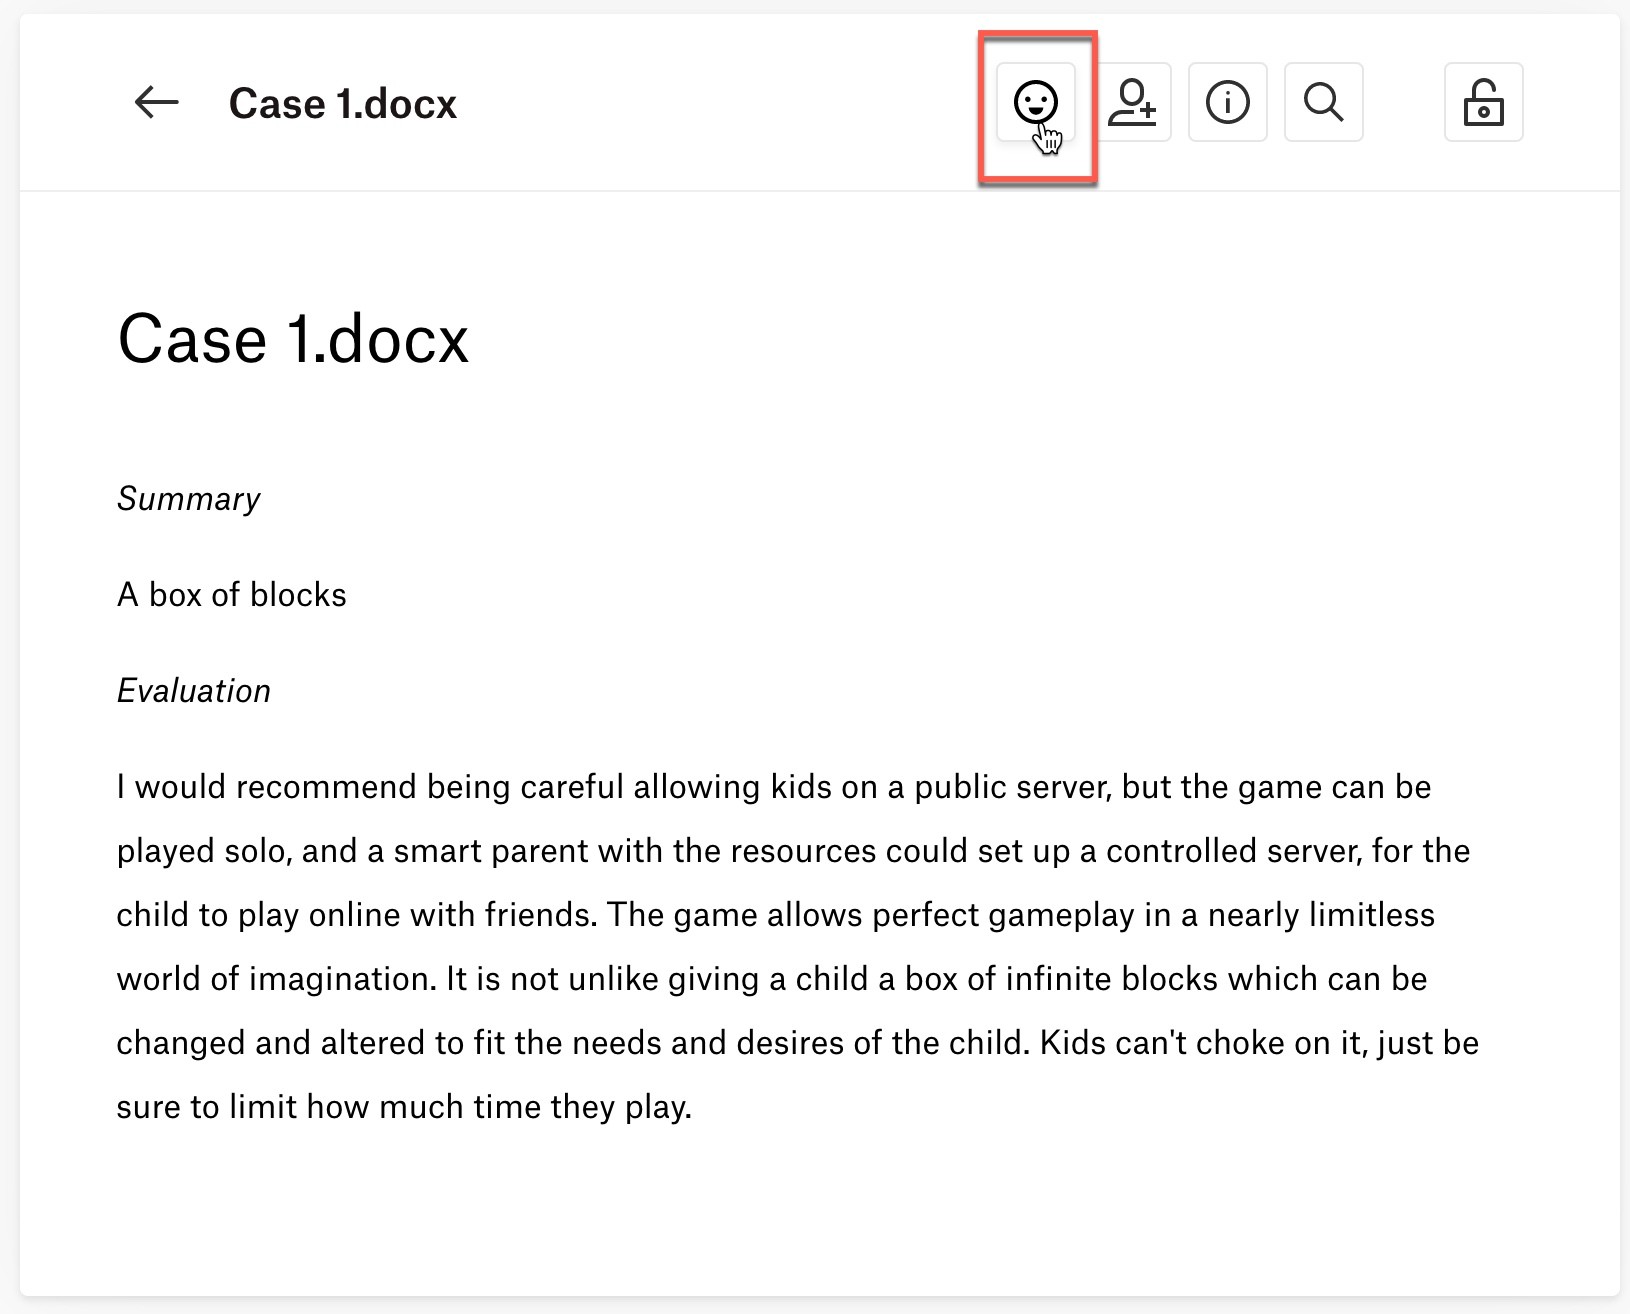
- Open a document
- Click on the sentiment analysis tool (see Figure 2)
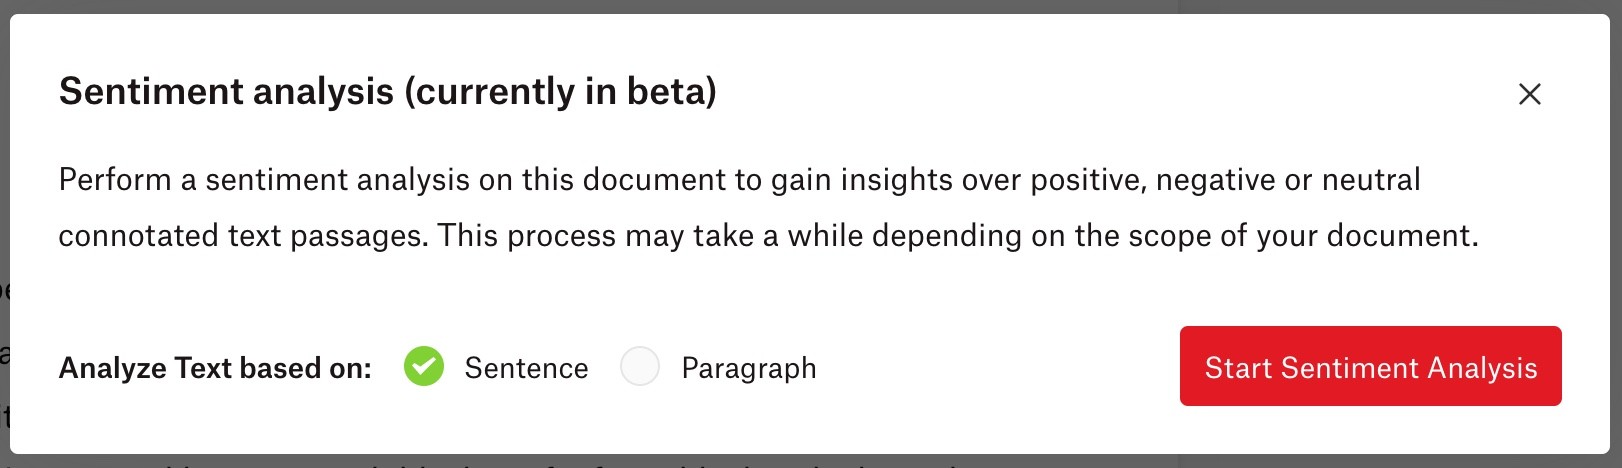
- Select whether you want to search in sentences or paragraphs (see Figure 3)
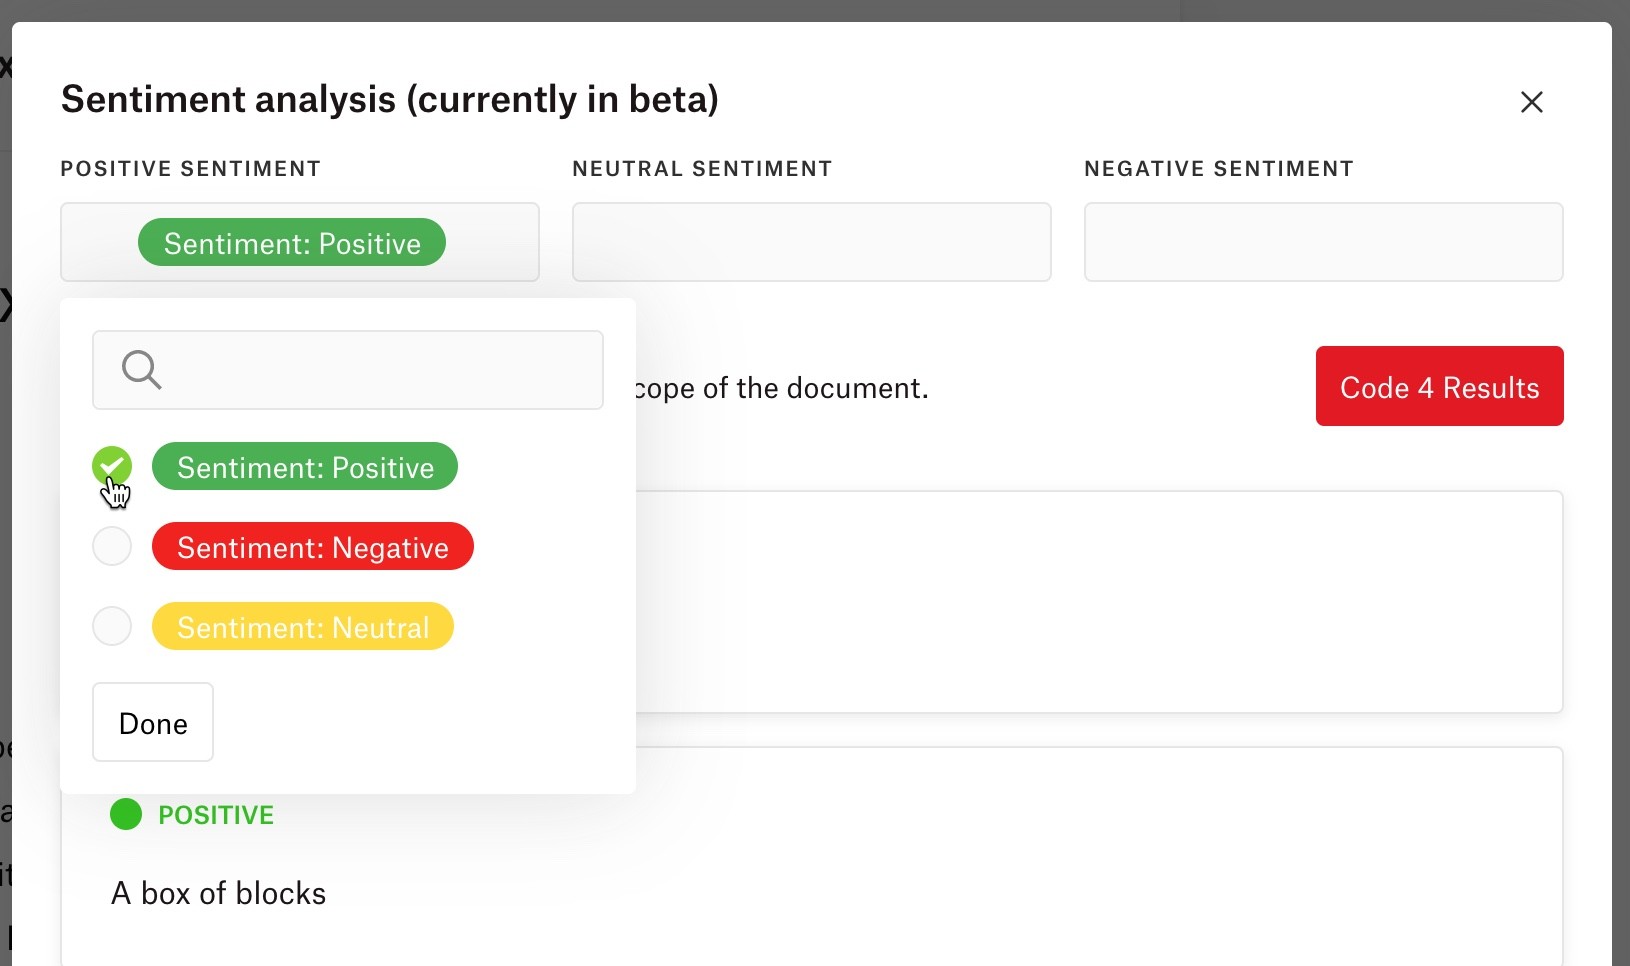
- Select which code you want to associate with each positive, negative, and/or neutral sentiment found (see Figure 4)
- Click on “Code Results
Now, you can see the codings on the right-hand side of your document. We recommend revising the codings and making any corrections that may need to be done. Artificial intelligence techniques have been developed for big data analysis. The data corpora usually handled by ATLAS.ti are considerably smaller. Thus, you cannot expect all results to be perfect. Reviewing the results will be a necessary component of the analysis process when using these tools. When working with the tools, you will see that the tools will add another level to your analysis. You find things that you simply do not see when coding the data manually or would have not considered to code. We, at ATLAS.ti, consider manual and automatic coding to be complementary; each enhancing your analysis in a unique way. If you want to see more detailed information about how sentiment analysis works in ATLAS.ti, you can see the manual.
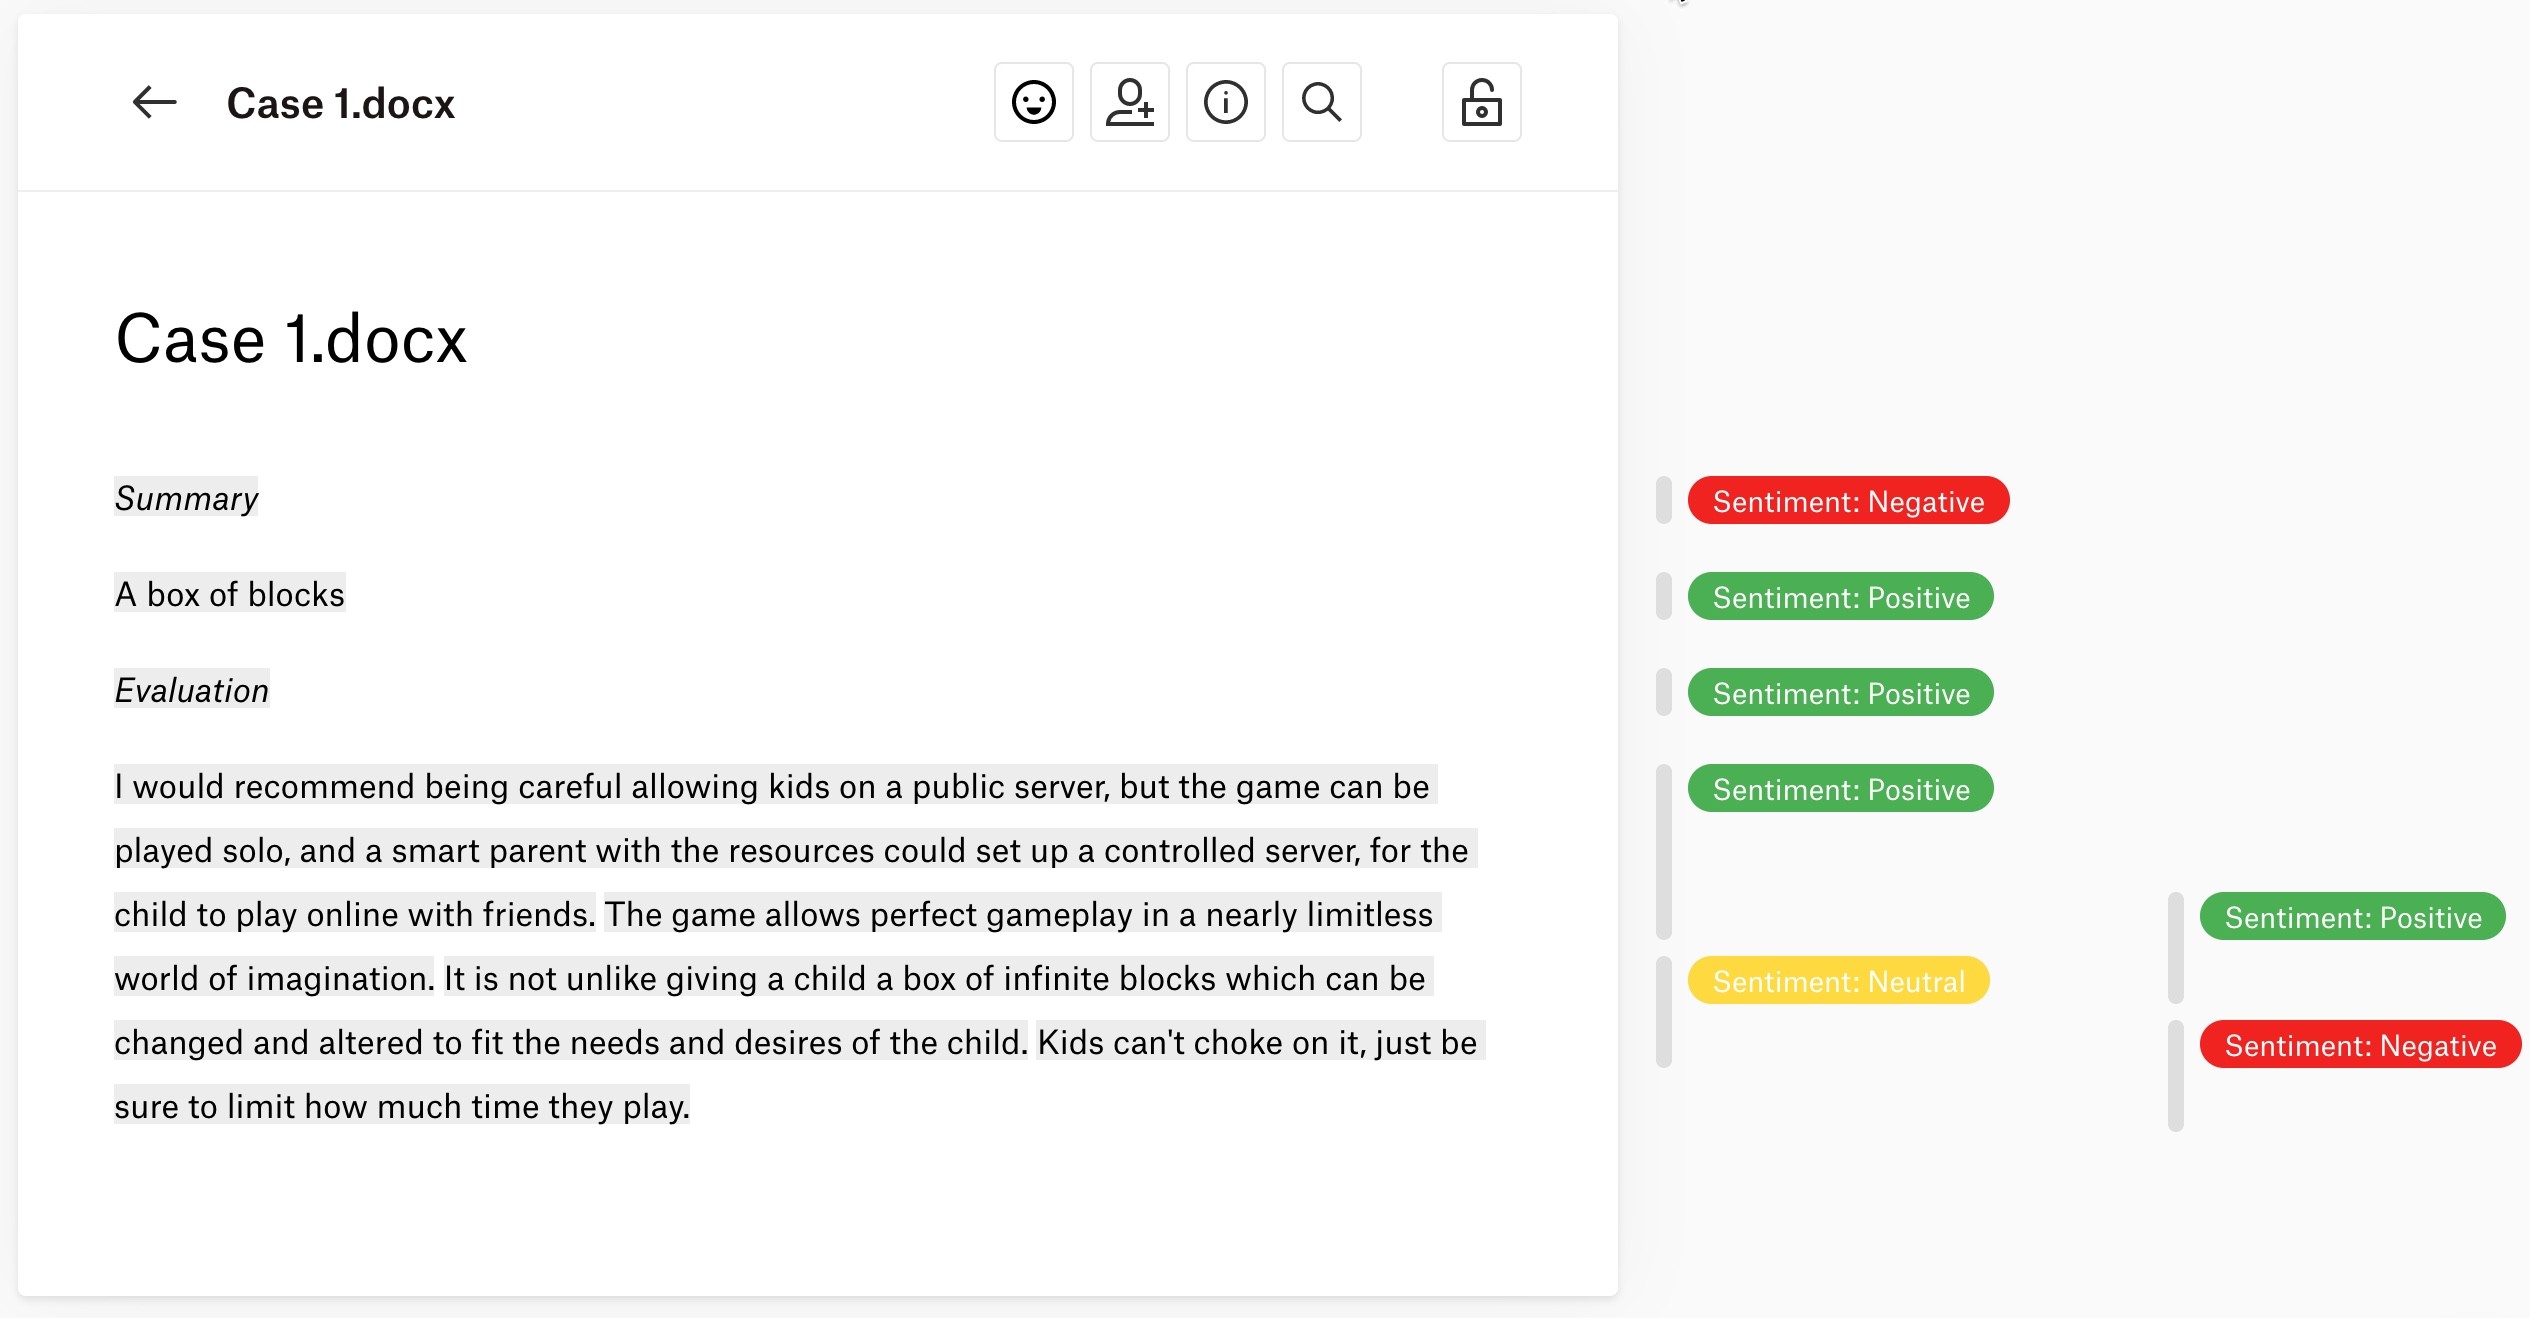
You can easily adjust the automatically created codings to delete irrelevant quotations, change the associated code, add more codes, and write comments on quotations. For example, in Figure 5 we can see the results of the sentiment analysis. Note that the survey question text of “Summary” and “Evaluation” were also automatically coded, but in reality, we do not really need this segment of text to be coded.
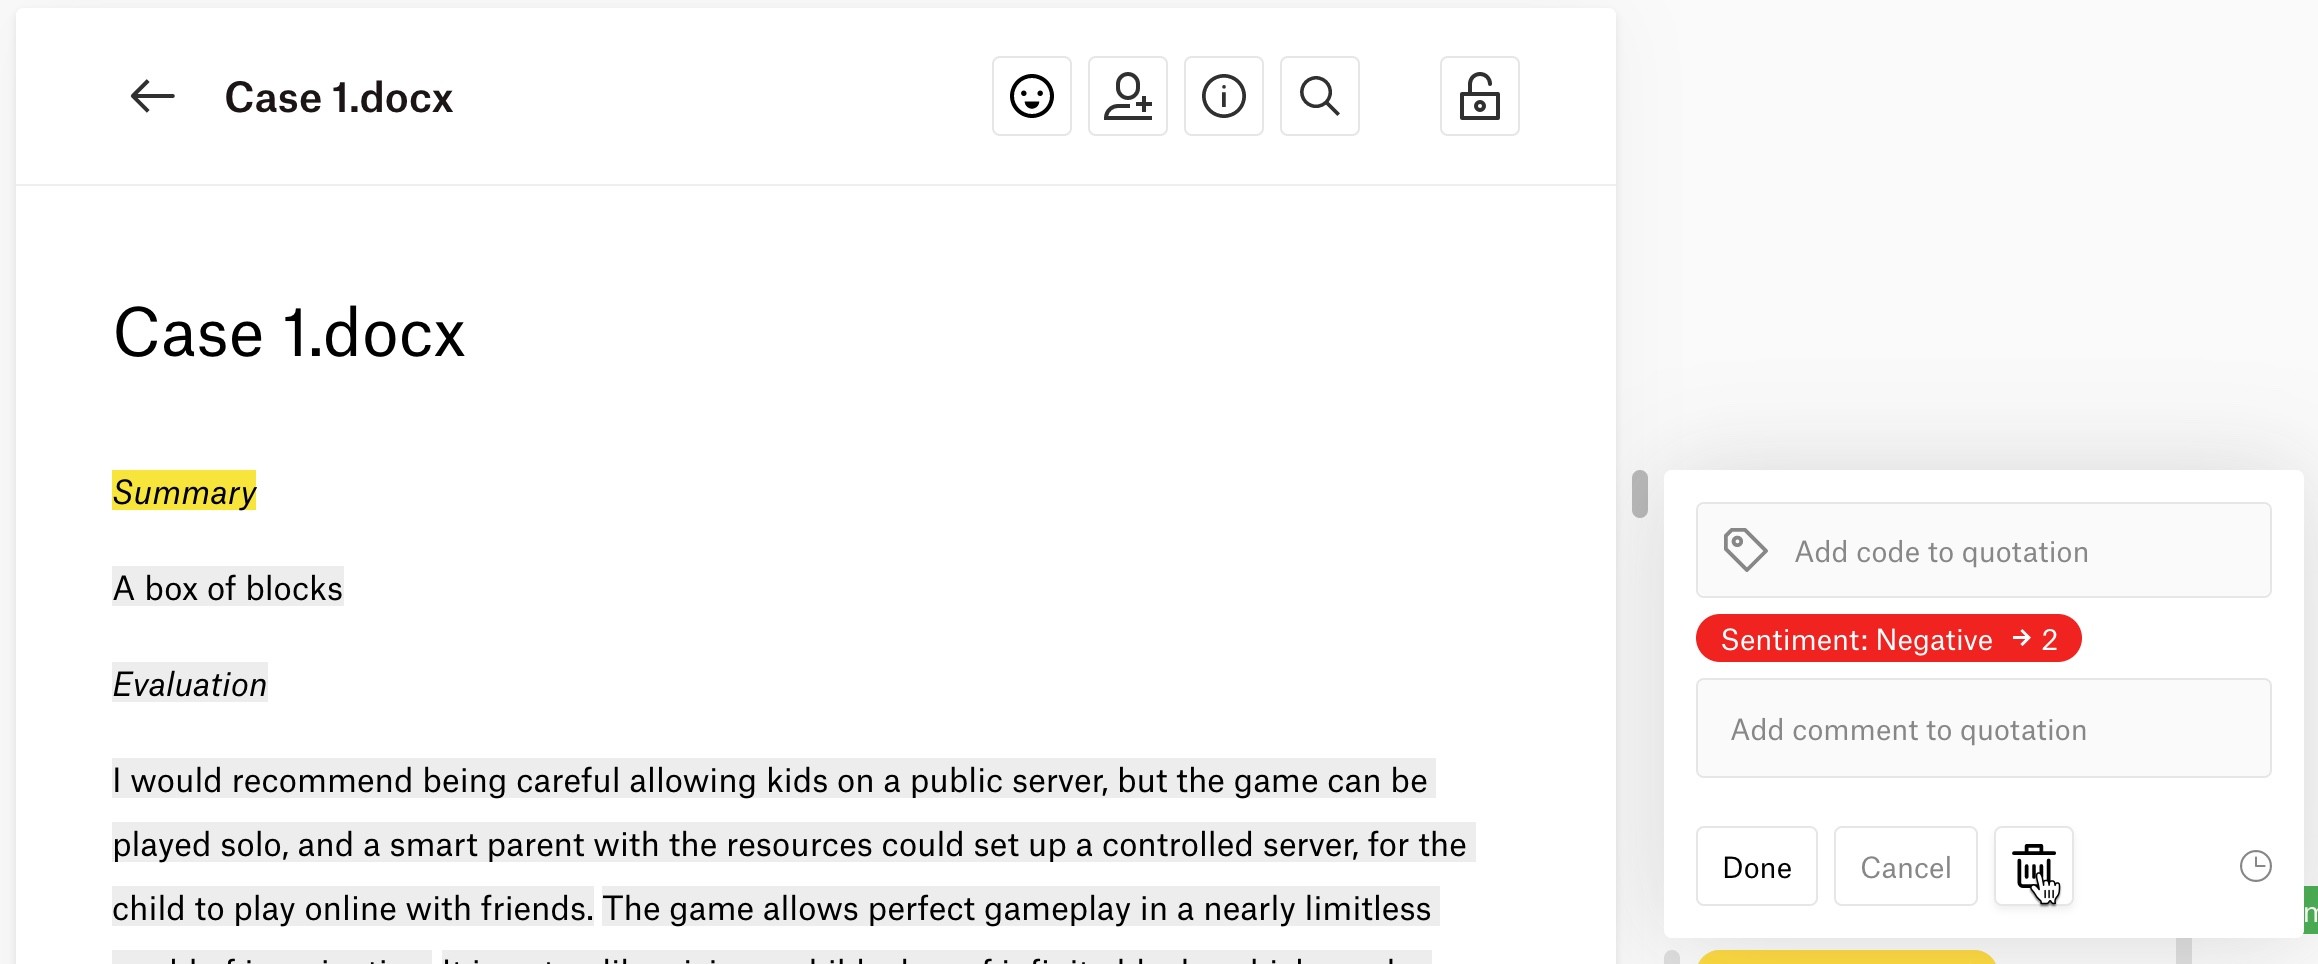
To delete a quotation, simply click on the quotation in the margin area, then click on the trash icon (see Figure 6).
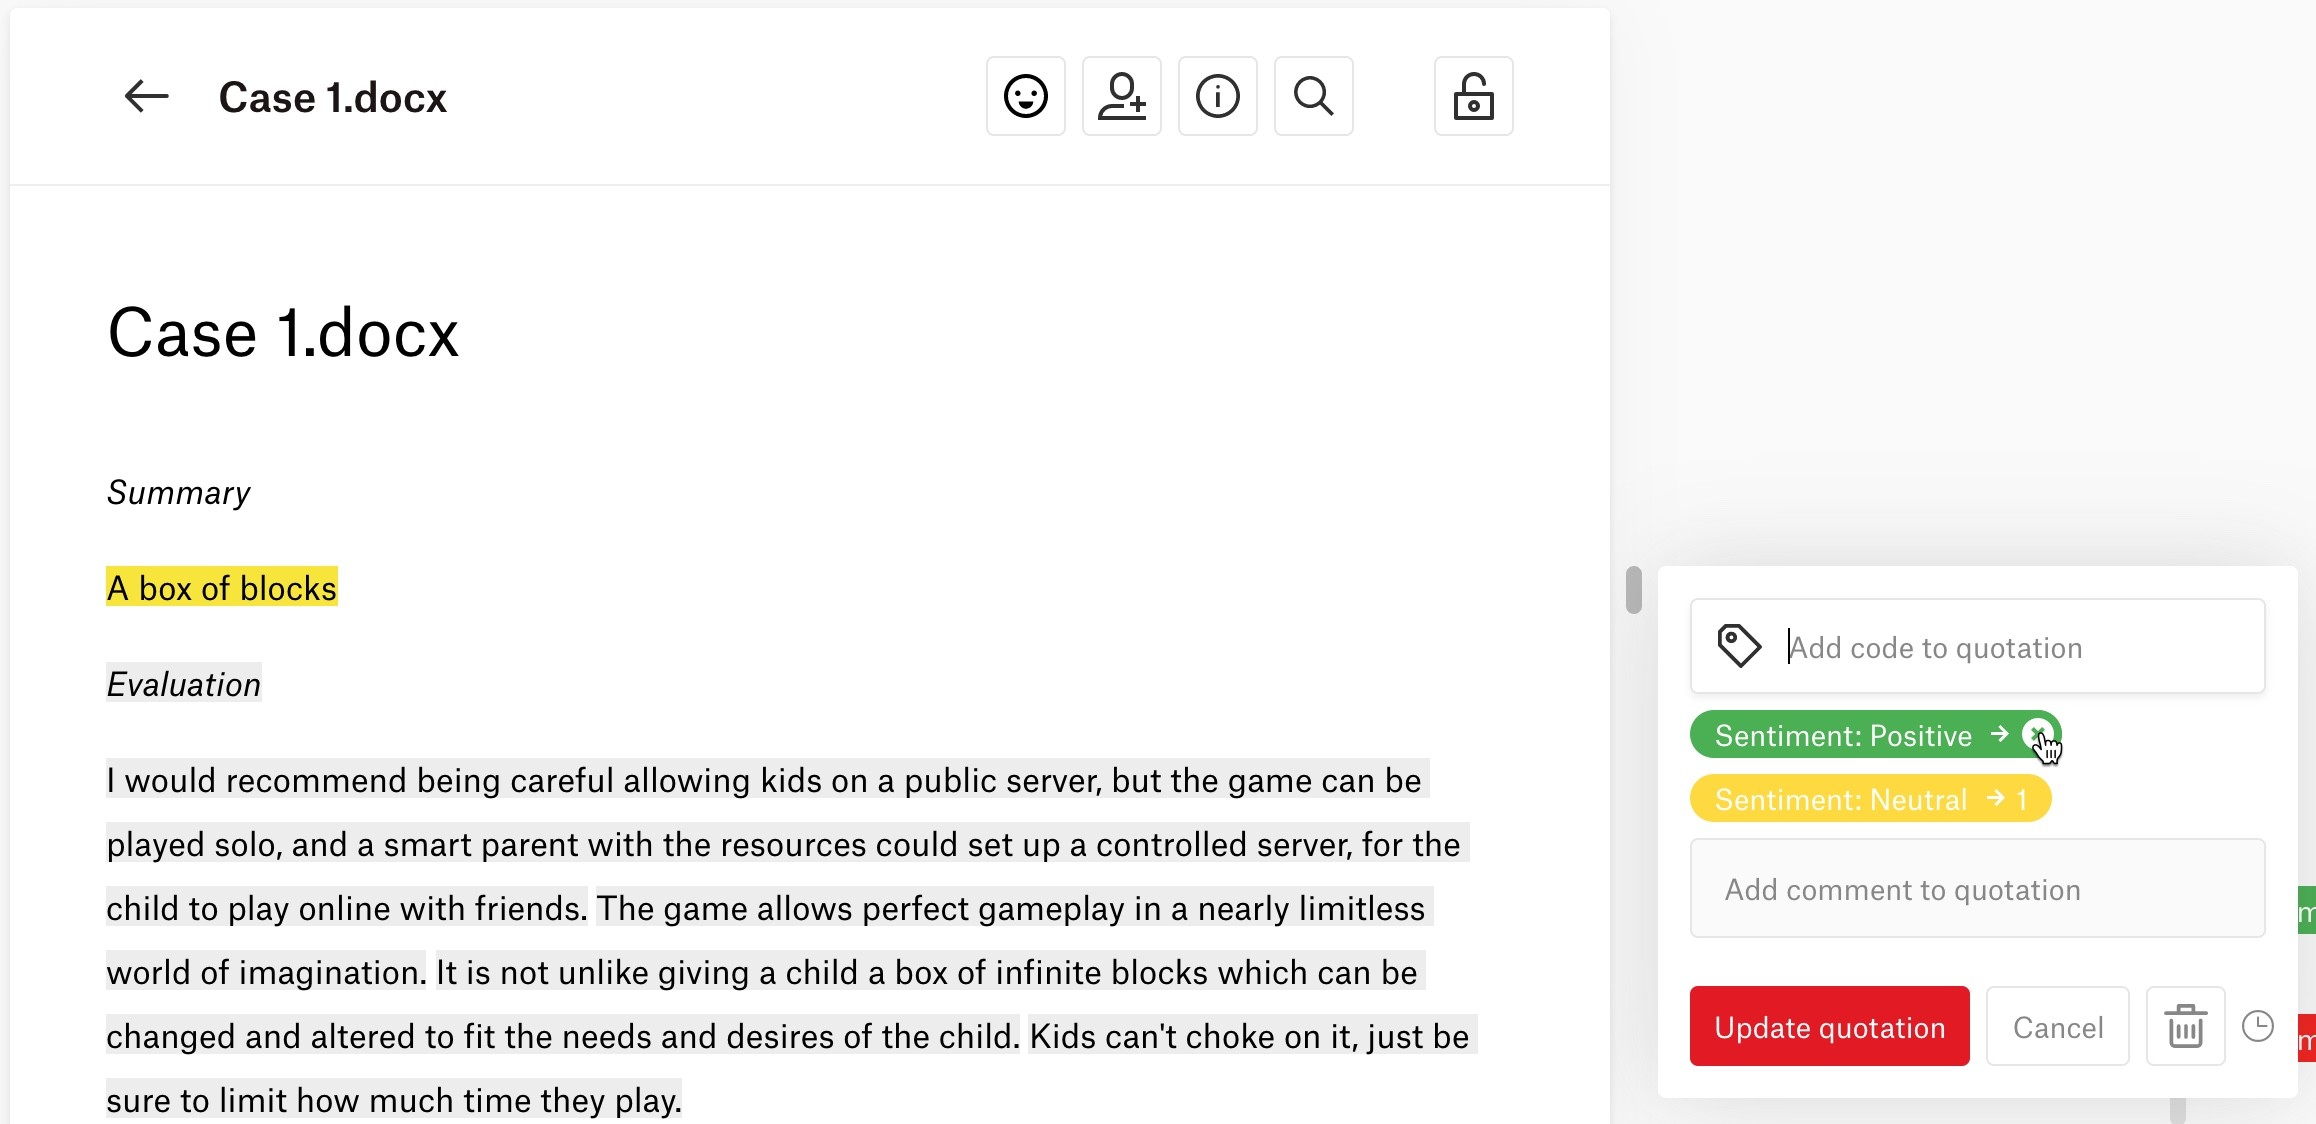
Taking a look at the coded text, we can also see, for example, that the participant’s summary of the computer game Minecraft being “A box of blocks” was automatically coded as a positive sentiment. However, this would be more accurately described as a neutral sentiment, so let’s go ahead and change that coding. To edit any codings, click on the quotation from the margin area. Now, we can associate any other codes (such as our code “Sentiment: Neutral”). We can also remove the code “Sentiment: Positive” by clicking on the “x” next to the code (see Figure 7).
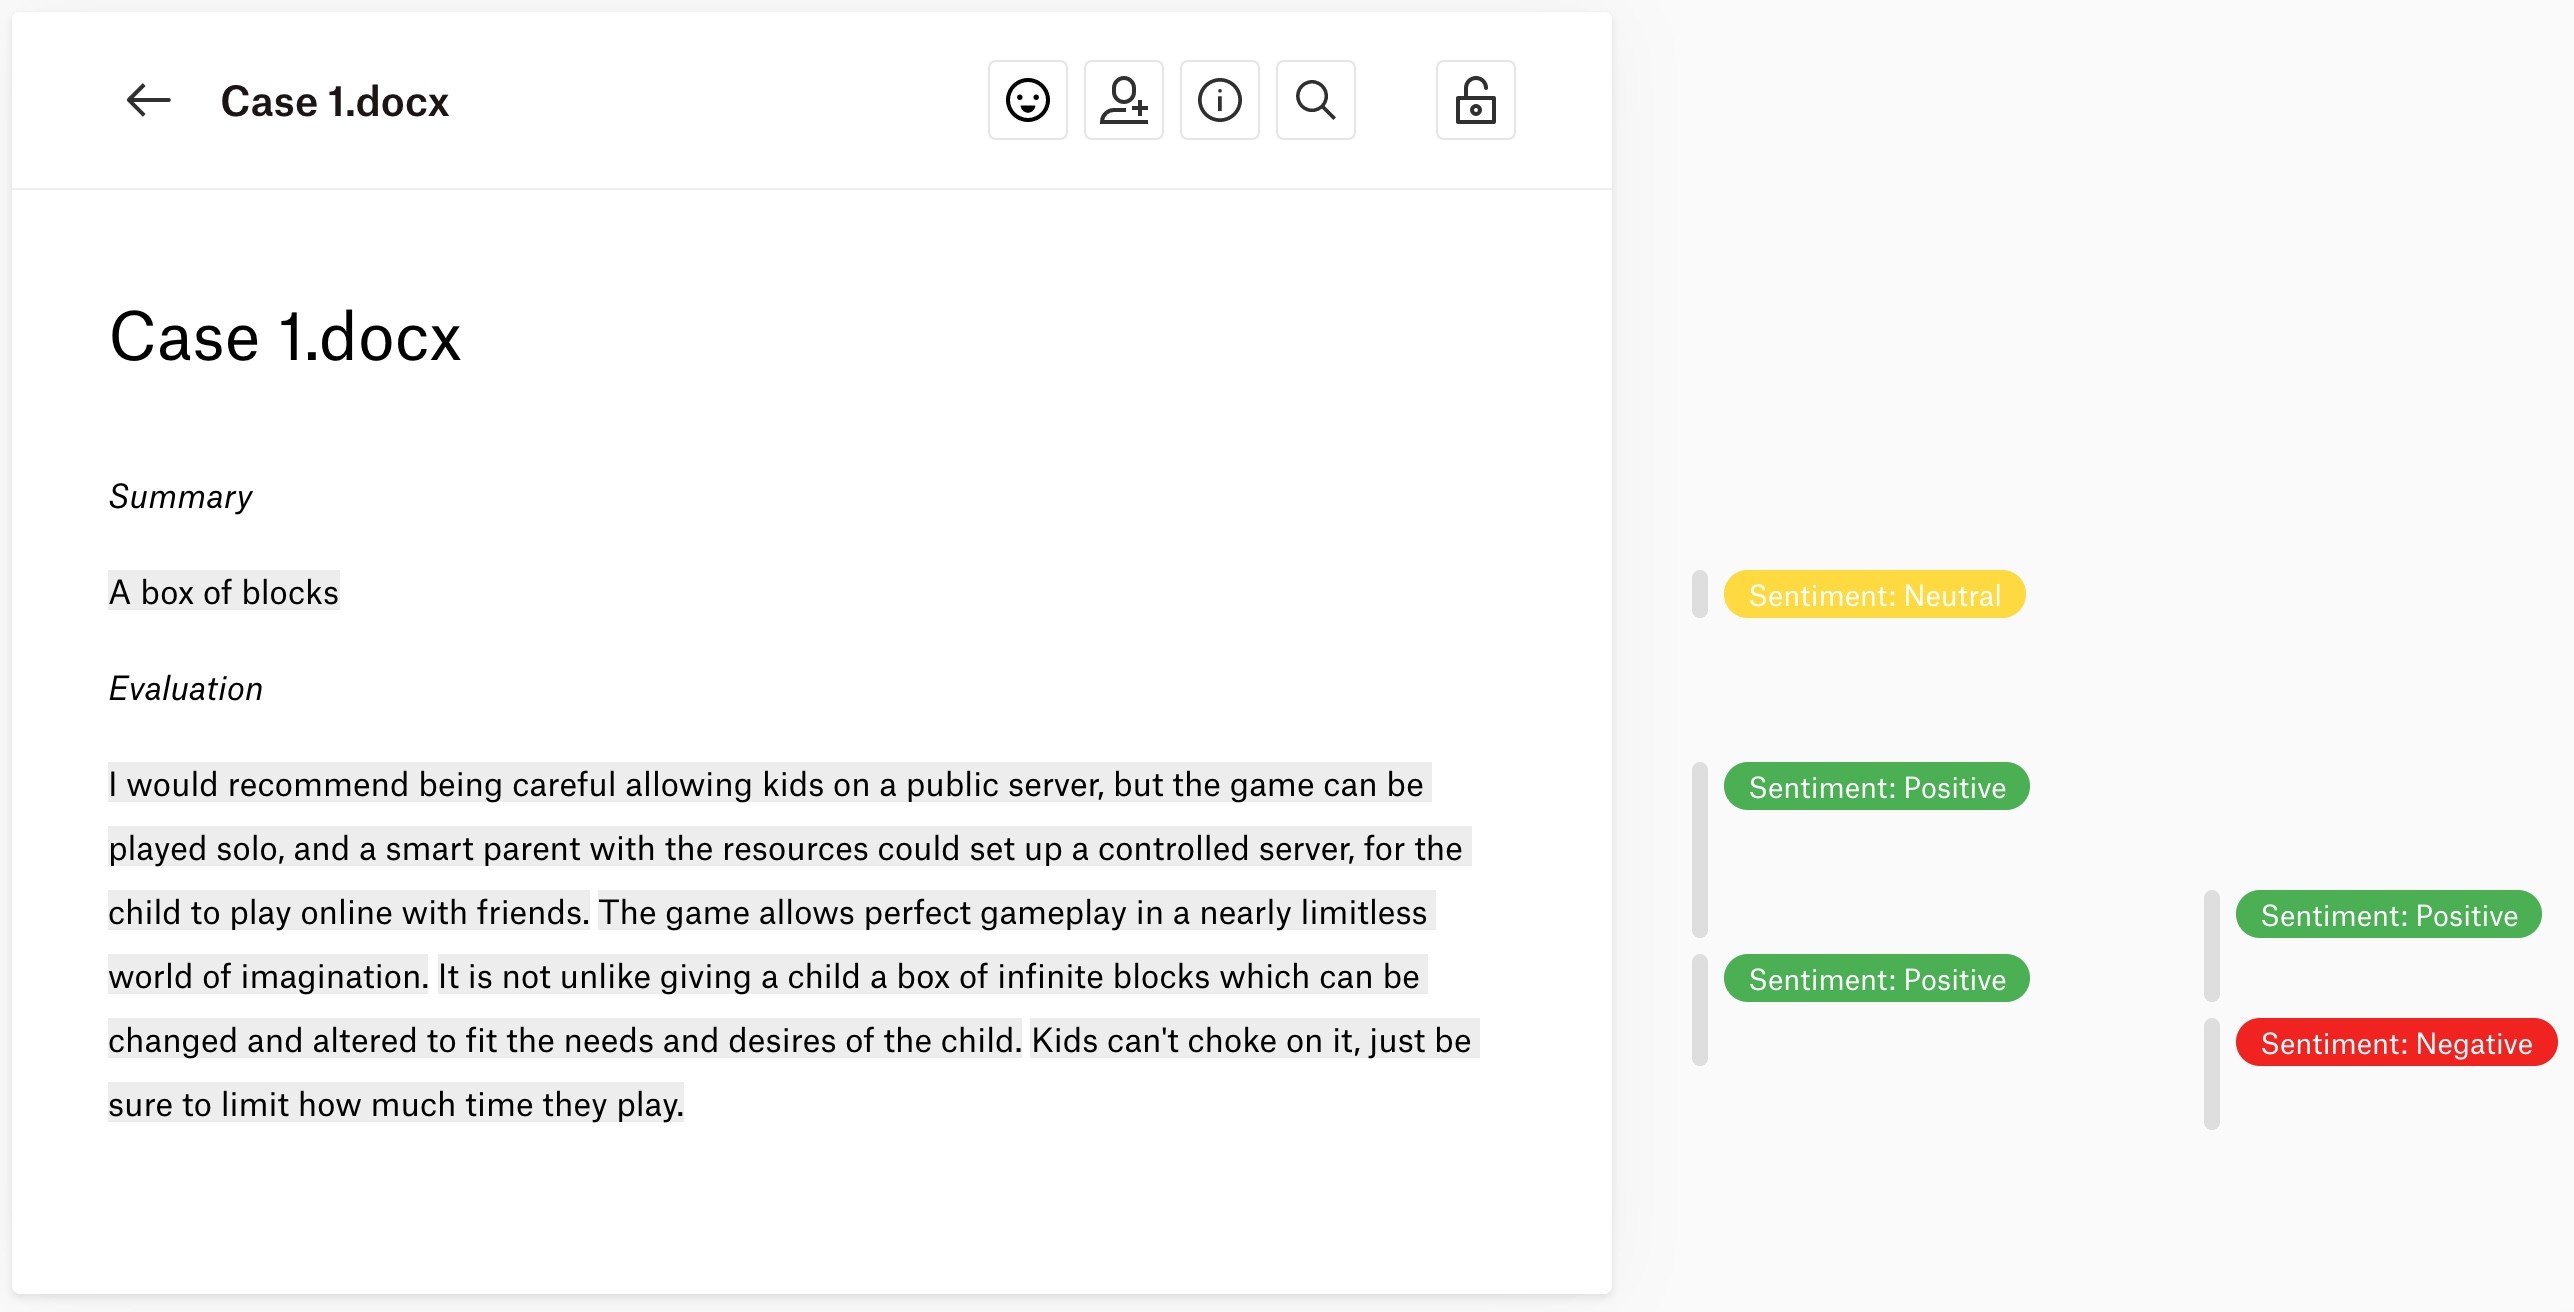
Sentiment analysis can thus be a great help for kickstarting the analysis and identifying things that we may not have seen ourselves. Nonetheless, our own analysis as human researchers is essential for making sense of these findings and perhaps correcting any automatic codings that do not make sense in this particular context. In the end, we will be able to clearly see which sentiments are expressed where in our data, and we can easily see the overall tone of each participant (see Figure 8).
Further explorations of sentiments
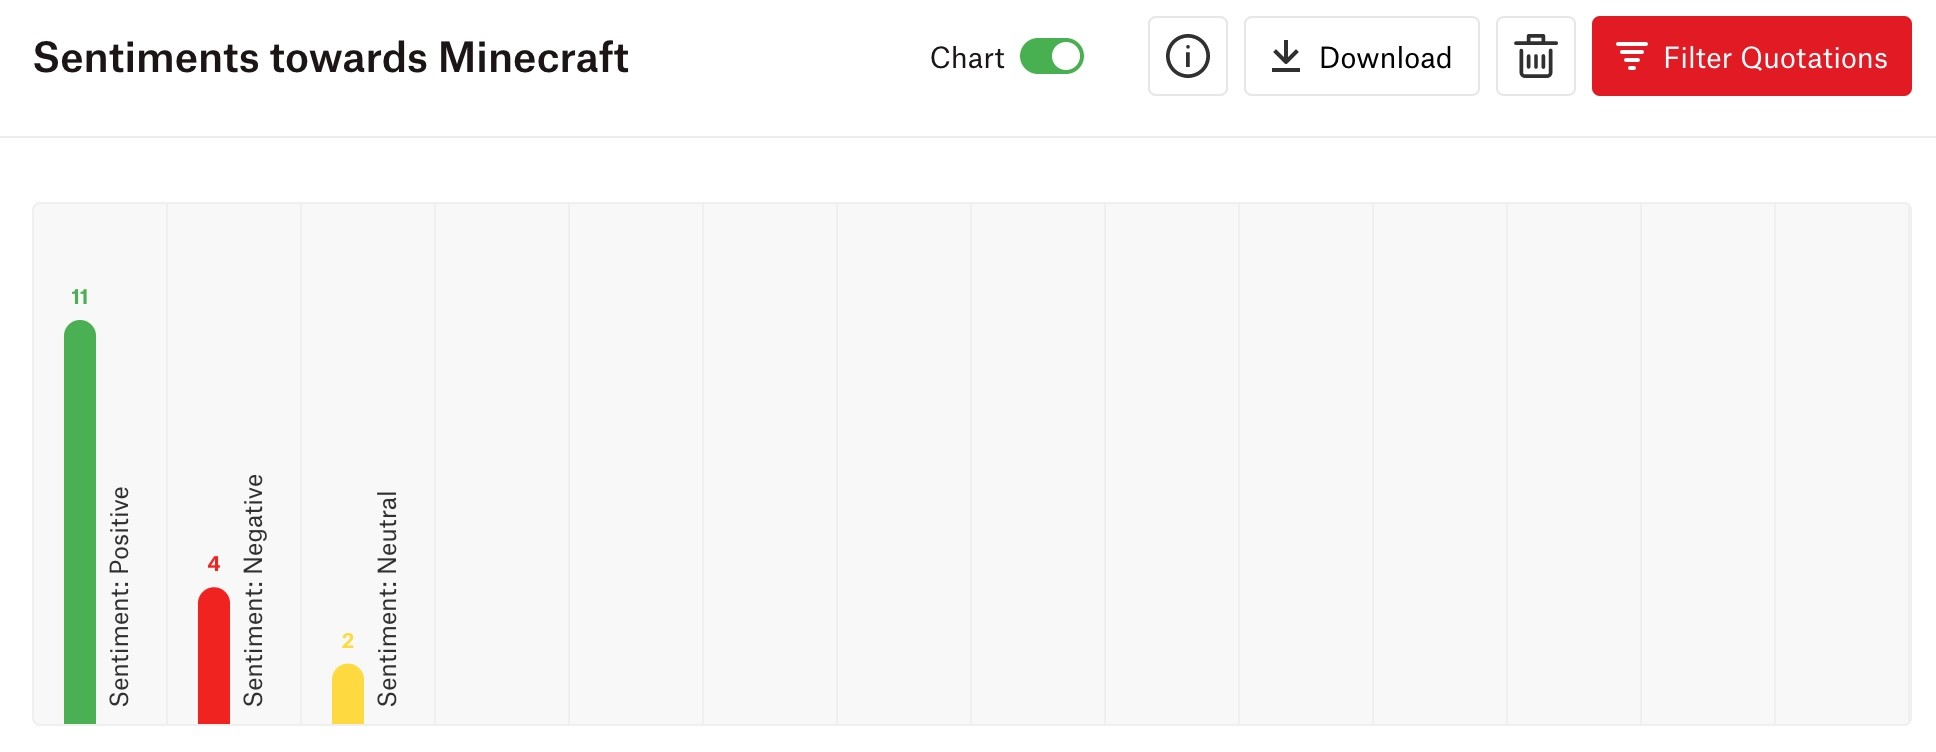
Once you have coded for the sentiments expressed in your data, you can query your findings by creating reports. For example, you can go to the Reports page and create a code distribution report to examine the frequencies of these codes. In Figure 9, you can see an example of a code distribution report based on the first three participants, and we clearly see that the tone of participants is mostly positive.
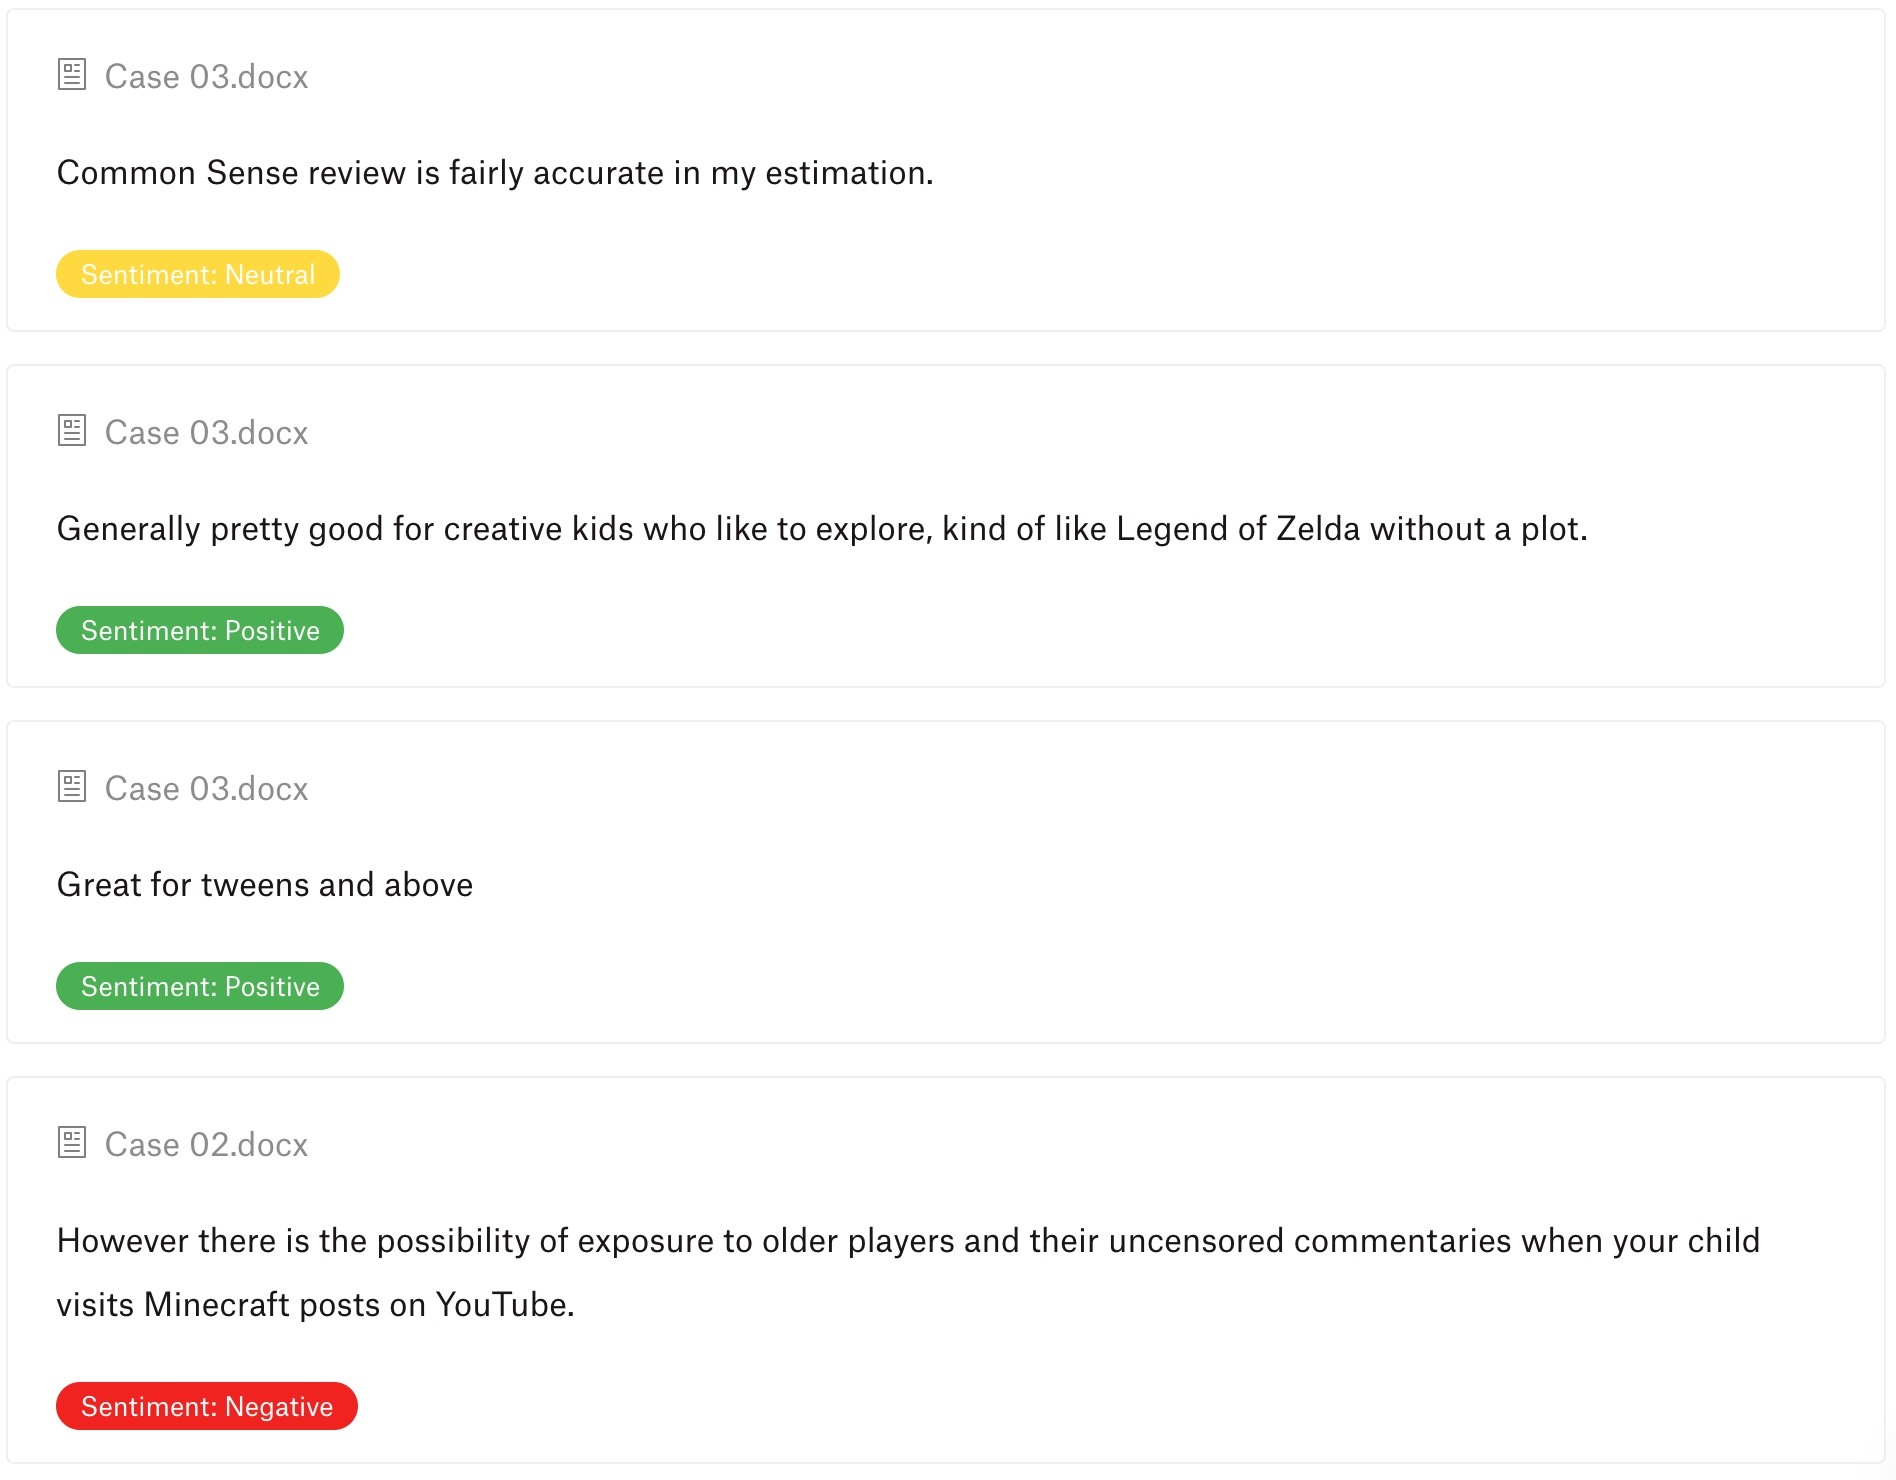
Below this chart, you can see all of the quotations (the raw data) as well as their associated codes and comments if you wrote any (see Figure 10).
If you click on any code(s) in the code distribution chart, ATLAS.ti will show only the quotations of those codes. You can also set filters or re-order the list of quotations, and you can download a report of these results. You can learn more about creating reports in ATLAS.ti Web in this guide article.
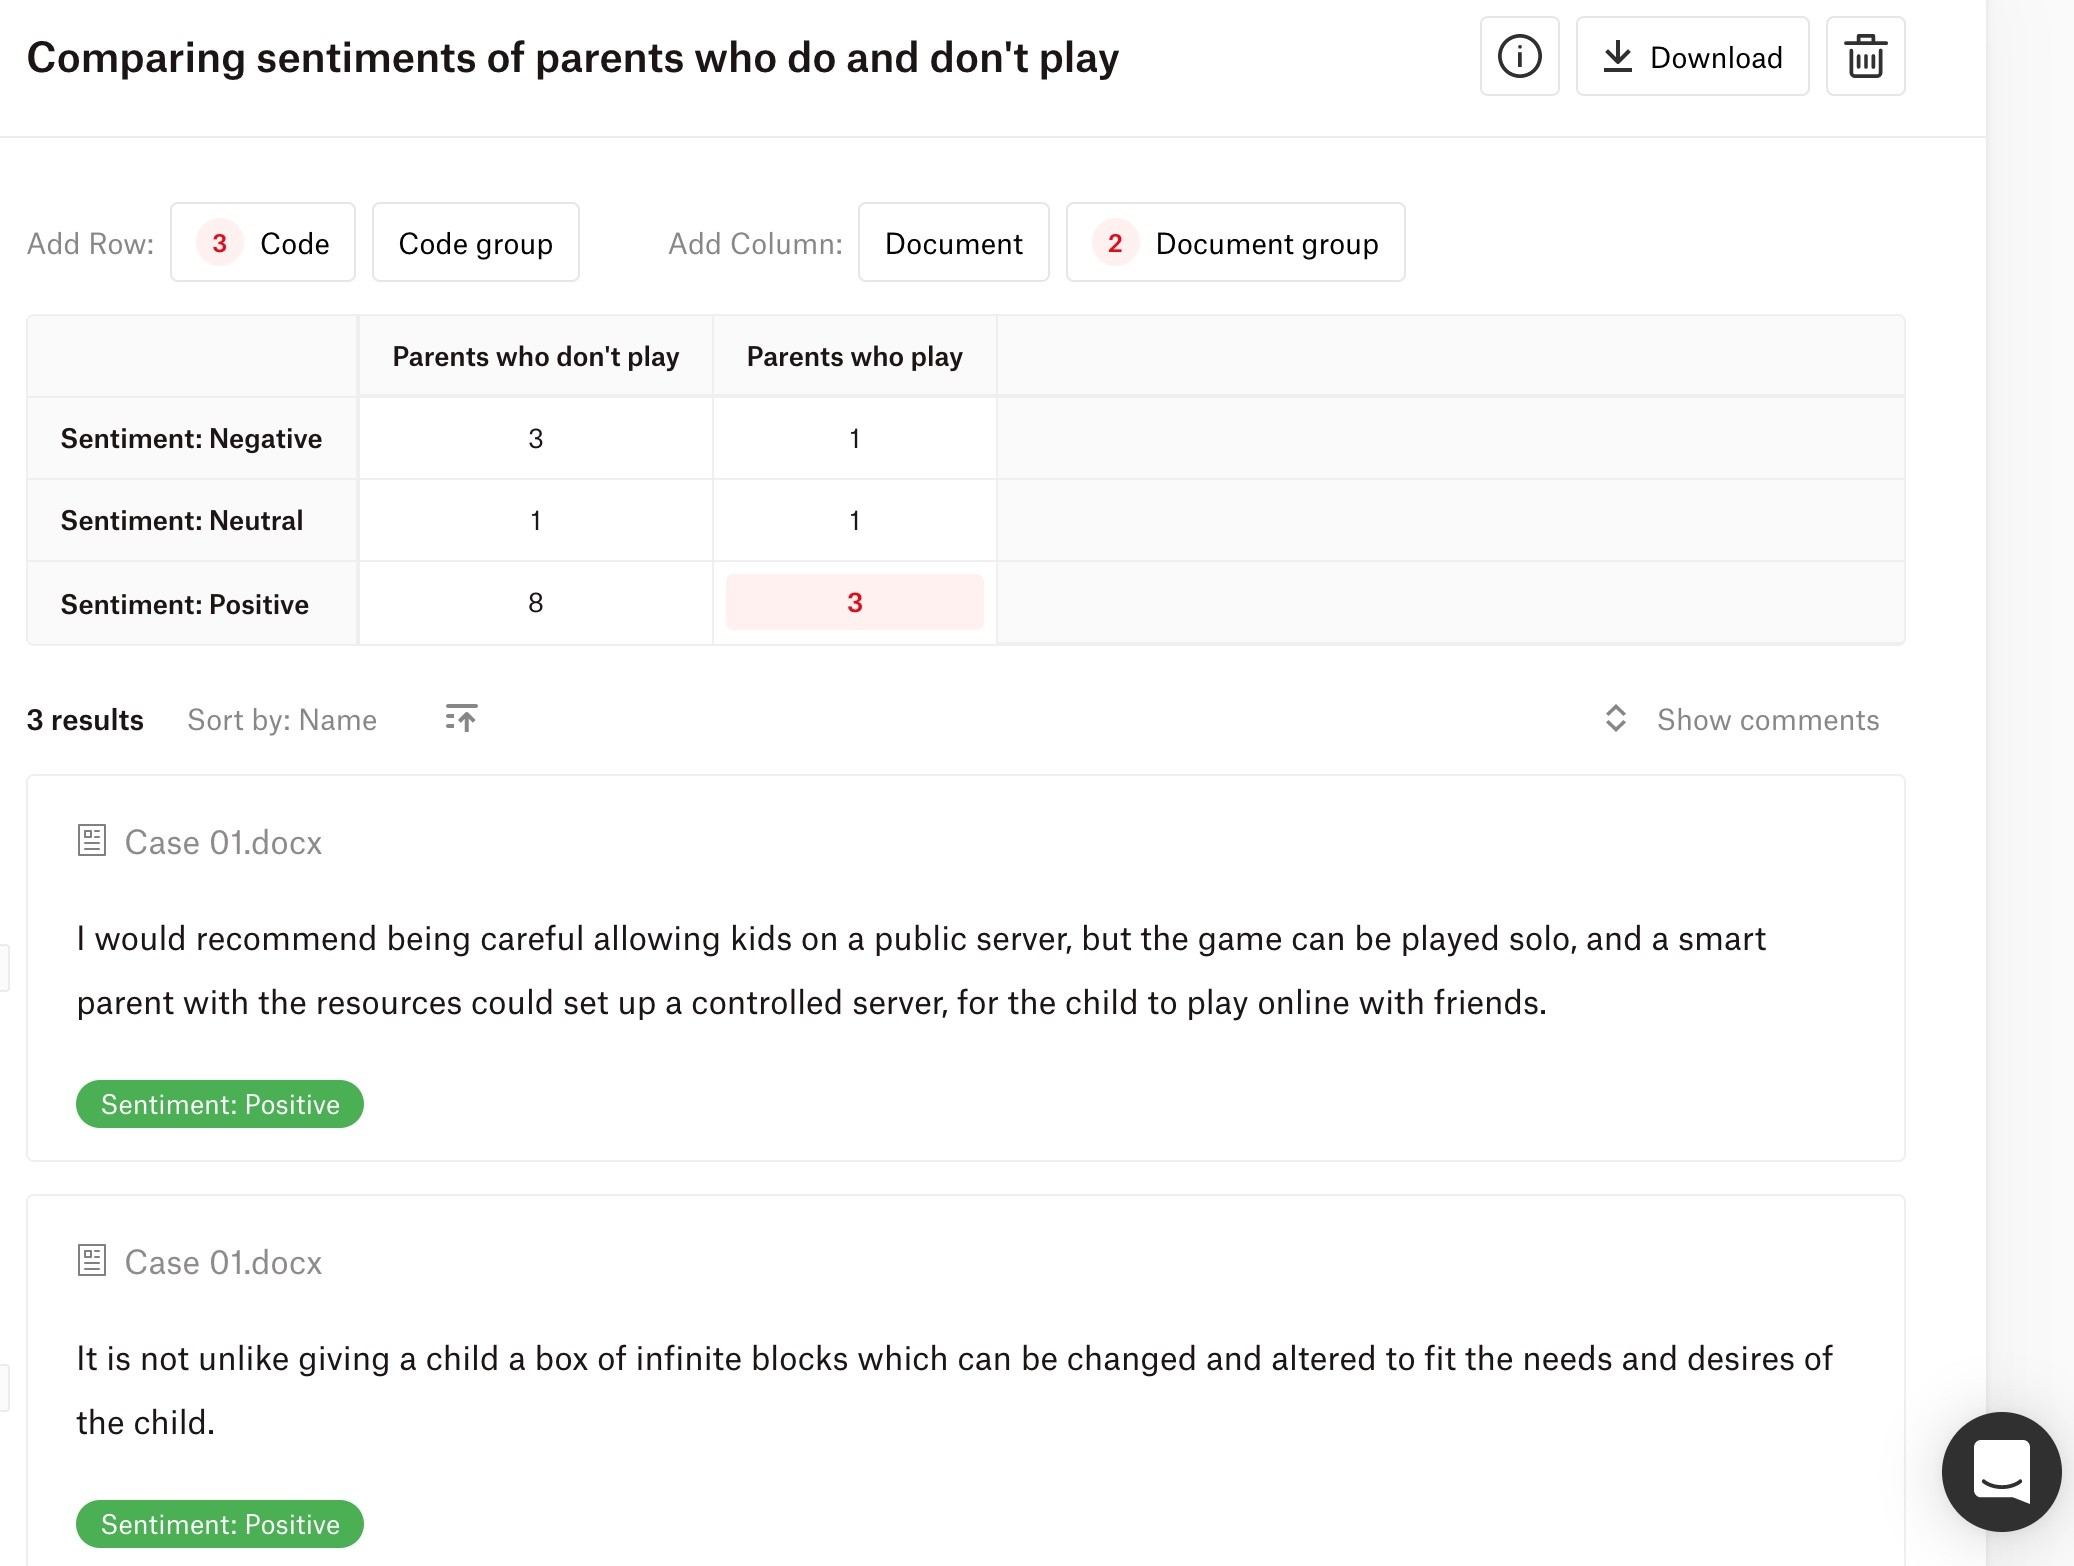
In addition to analysing code distributions, you can also compare sentiments across your data by using the code-document table. For example, we also created two groups to organise participants according to whether they play the game themselves or not. Then, in the code-document table, we can select these two document groups along with our three sentiment codes. Now we can easily compare and contrast the tone of parents who do and do not play the game themselves (see Figure 11). If you click on any cell in the table, you will see the corresponding quotations below.
Wrapping up
The sentiment analysis tool in ATLAS.ti Web opens up exciting possibilities for quickly and easily examining the tone being expressed by participants. With one click, ATLAS.ti Web will automatically code the data, and you can then focus on refining the analysis, querying the codings using the different report options, and writing your reflections and insights in memos. Analysing sentiments can provide key insights for understanding how people react to or feel about something, and this can be applied in numerous kinds of studies, such as examining how customers evaluate a product or service, how participants feel about a particular experience or phenomenon, or what kind of tone leaders use when communicating messages to others. The possibilities are endless, and we hope that the sentiment analysis tool helps give you a further level of understanding of your participants’ tones and emotions.

How to cite "Sentiment analysis in ATLAS.ti Web"
APA (7th edition)
Kalpokas, N. (2022). Sentiment analysis in ATLAS.ti Web. ATLAS.ti Research Hub. https://atlasti.com/research-hub/sentiment-analysis-in-atlas-ti-web
MLA (9th edition)
Kalpokas, Neringa. “Sentiment Analysis in ATLAS.ti Web.” ATLAS.ti Research Hub, 2022, https://atlasti.com/research-hub/sentiment-analysis-in-atlas-ti-web.
Chicago (17th edition)
Kalpokas, Neringa. “Sentiment Analysis in ATLAS.ti Web.” ATLAS.ti Research Hub. 2022. https://atlasti.com/research-hub/sentiment-analysis-in-atlas-ti-web.