Quantitative research

- Objectives and applications
- Quantitative Research Methods
- Choosing a Quantitative Research Design
- Software for Quantitative Research
Objectives and applications
Quantitative and qualitative research are commonly considered differing fundamentally. Yet, their objectives, as well as their applications, overlap in numerous ways. Quantitative Research is considered to have as its main purpose the quantification of data. This allows generalizations of results from a sample to an entire population of interest and the measurement of the incidence of various views and opinions in a given sample.
Yet, quantitative research is not infrequently followed by qualitative research, which aims to explore select findings further. Qualitative research is considered particularly suitable for gaining an in-depth understanding of underlying reasons and motivations. It provides insights into the setting of a problem. At the same time, it frequently generates ideas and hypotheses for later quantitative research.
Quantitative Research Methods
Quantitative research measures the frequency or intensity of a phenomenon or its distribution, hypotheses can be tested, and insights inferred. At the beginning of the research process, theories about the facts under investigation have already been proposed, from which hypotheses are derived. The actual data are then collected by quantitative methods. In the social sciences, often, these are surveys using questionnaires or experiments. Statistical methods are used to dissect and evaluate the data, often using control groups. The research process results are then, in turn, related to the previously established theories and interpreted.
The advantages of quantitative research are high reliability, fast processing of large amounts of data, and high comparability. There are several methods of quantitative research:
- standardized surveys
- standardized observations
- experiments and trials
- quantitative content analysis

Choosing a Quantitative Research Design
The research design is composed of:
- Type of research
- Data collection
- Data description
- Method of analysis
Which method of data collection and analysis is suitable depends on the research questions.
A distinction can be made between dependent and independent variables in quantitative research. Independent variables are considered to have an effect on other variables in the research context. They influence the dependent variable(s). Regression analysis can be run to determine whether an independent variable has an effect. For example, one can examine the bathing time (dependent variable) of swimming pool guests as a function of the water temperature (independent variable).
Correlational analysis can be used to determine whether two variables are related, but no cause and effect relationship can be established. For example, it has been observed that more children are born in places where many storks live. This however does not mean that storks deliver babies. The simple explanation for this observation is that birth rates are higher in the countryside, and storks also prefer to live in this environment.
Software for Quantitative Research
Quantitative research, predominantly statistical analysis, is common in the social sciences. Many software programs designed for use with quantitative data are available today. The main requirements for such packages are that they are comprehensive and flexible. A useful statistical software tool can generate tabulated reports, charts, and plots of distributions and trends and generate descriptive statistics and more complex statistical analyses. Lastly, a user interface that makes it very easy and intuitive for all levels of users is a must.
Examples of statistical analysis software are SPSS, Excel, SAS, or R. The presentation of results of studies usually takes place in the form of tables or graphs.
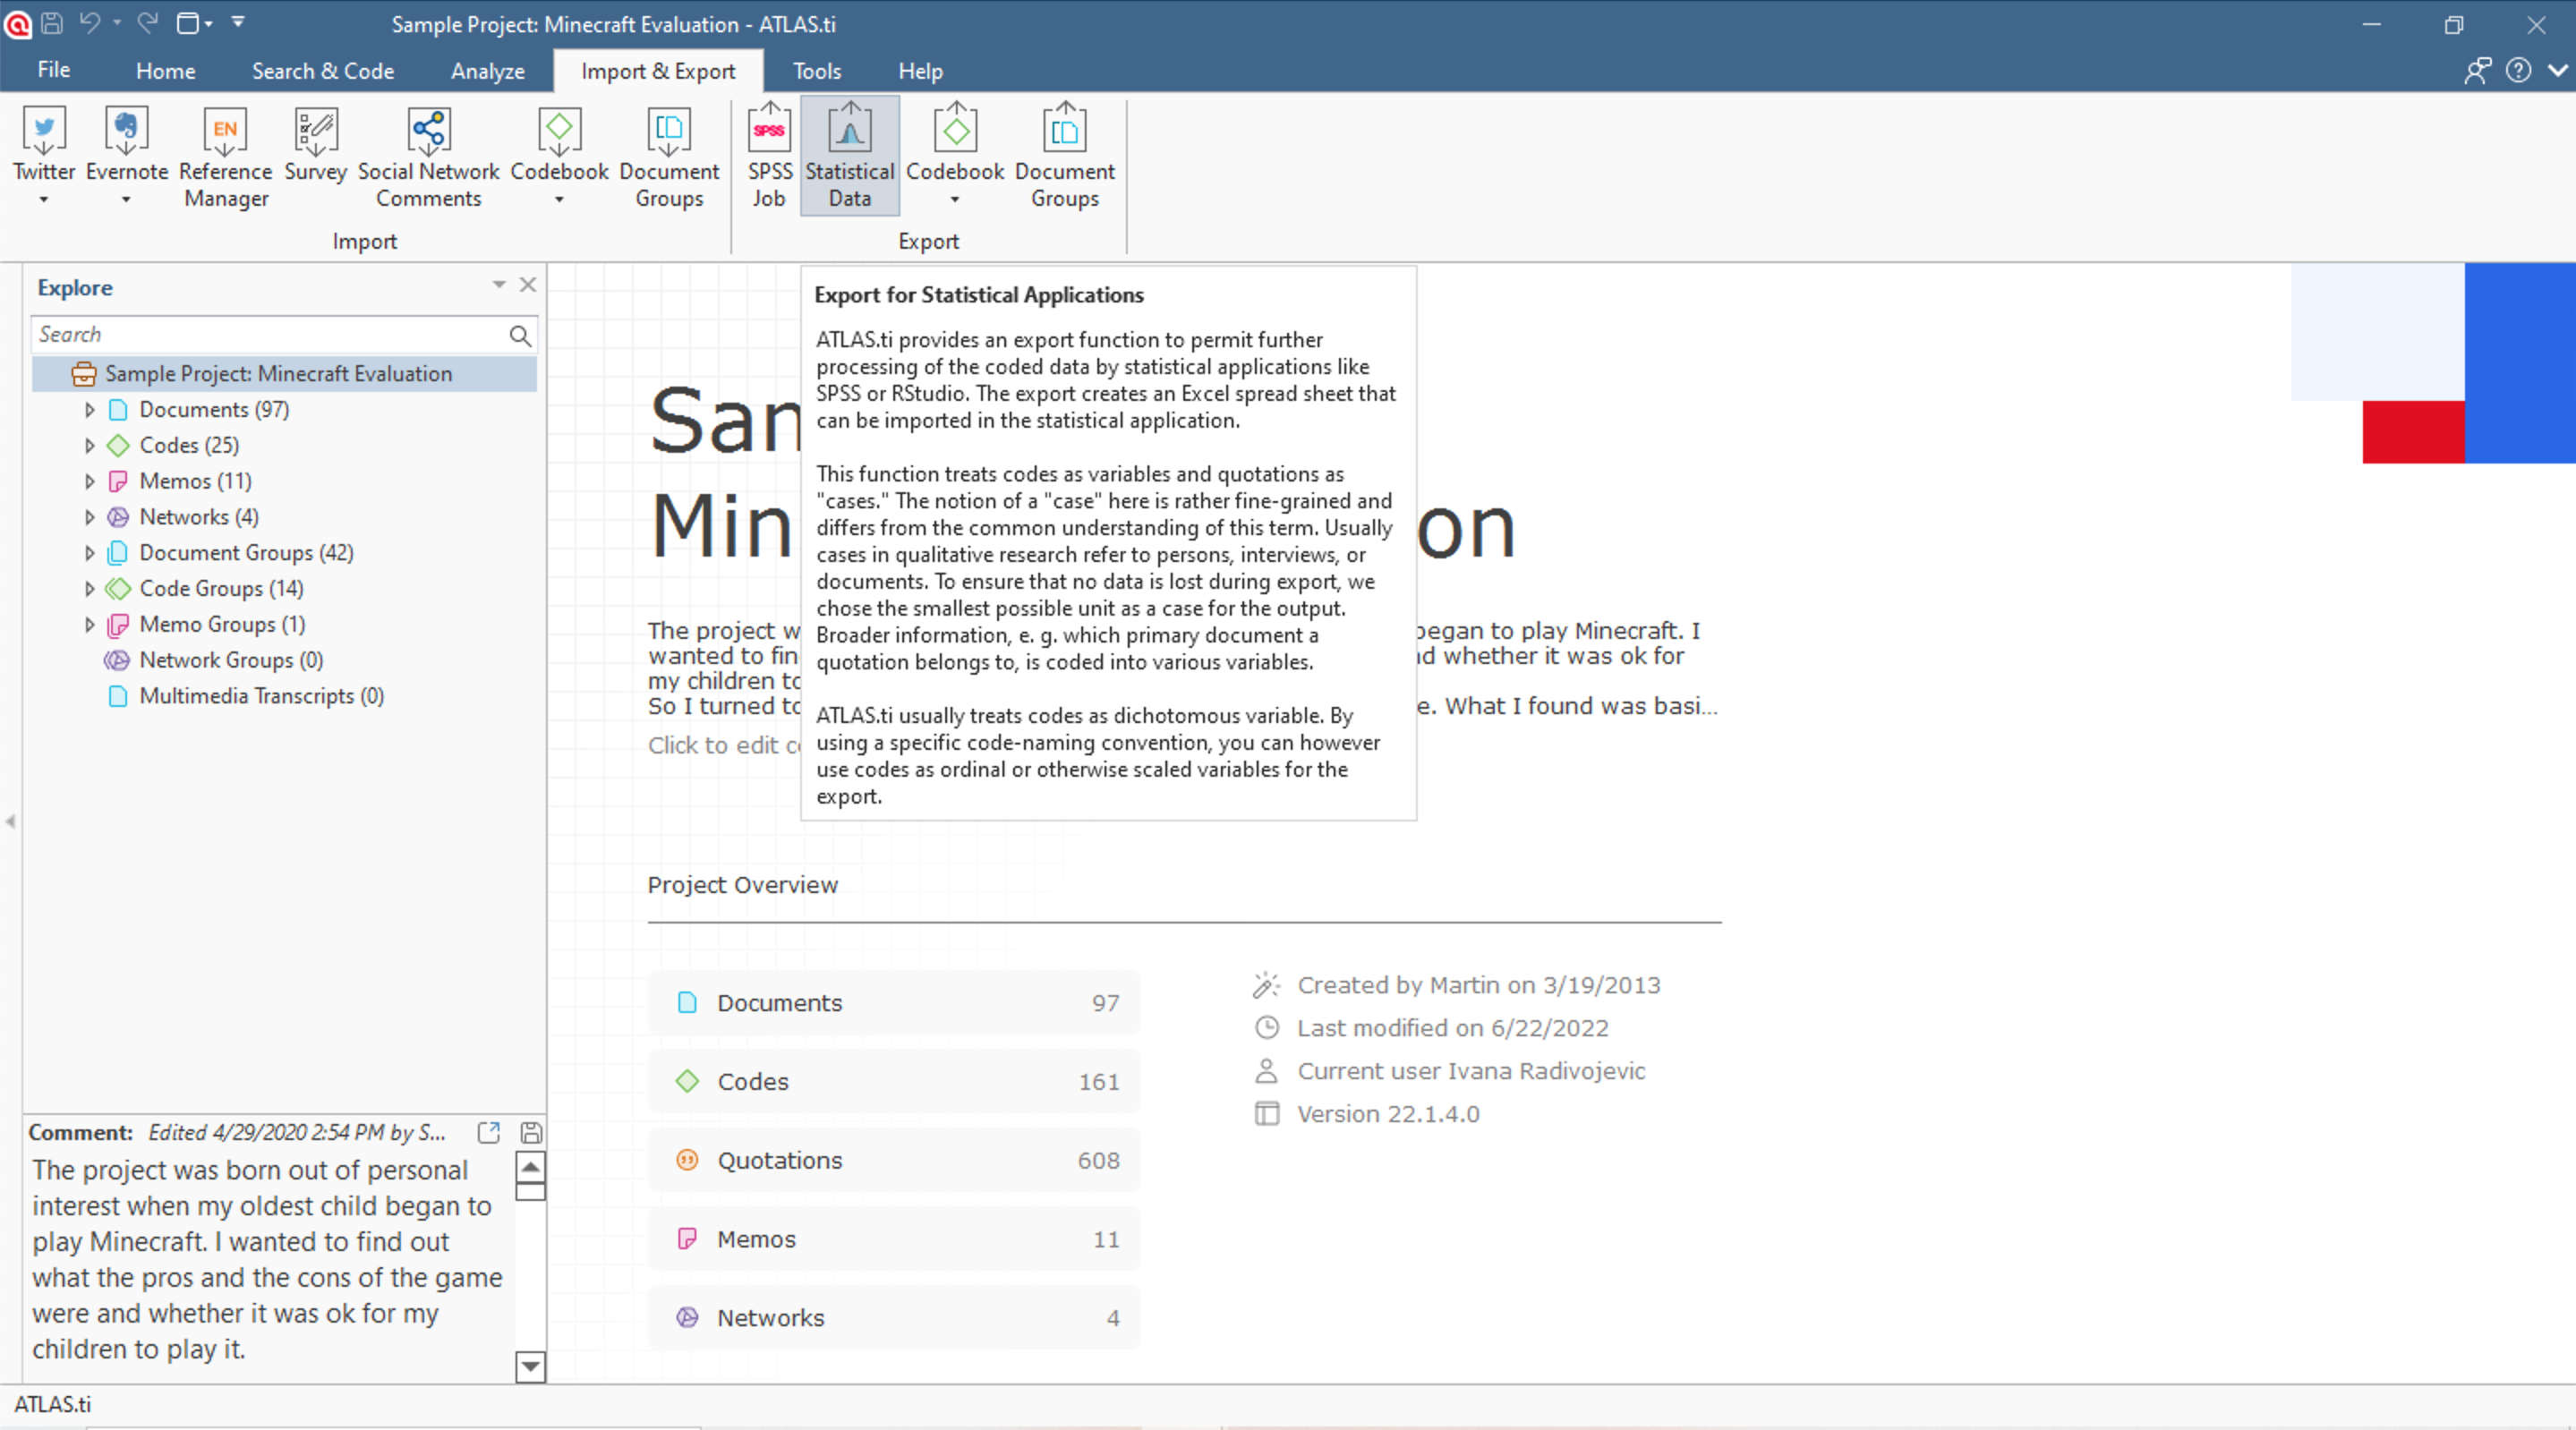
Suppose you have used ATLAS.ti for analyzing qualitative data. If your sample is sufficiently large, and you want to confirm results via statistical procedures, you can export your ATLAS.ti data for use in SPSS, Excel, SAS, or R. ATLAS.it offers two output options - an SPSS syntax file or a generic Excel file for input in any statistical software. Each coded data segment becomes a case, and each code and code group a variable.