NVivo vs. ATLAS.ti | Best Qualitative Data Analysis Software
What are the key differences between ATLAS.ti and NVivo? Find out why ATLAS.ti is the best choice for qualitative researchers.
|
NVivo
|
ATLAS.ti
|
|
|---|---|---|
| AI-powered Data Analysis | ||
| Intentional AI Coding | ||
| Conversational AI | ||
| AI Summaries | ||
| AI Suggested Codes | ||
| Paper Search capabilities | ||
| Free access to 200M+ papers | ||
| Streamlined literature search | ||
| Advanced filters for relevant papers | ||
| Auto-Coding Tools | ||
| Coding speakers in transcripts | ||
| Sentiment Analysis | ||
| Concepts Tool | ||
| Opinion Mining | ||
| Named Entity Recognition | ||
| Text Search | Sliding scale of text search options | Full flexibility to customize searches |
| Visualizations | ||
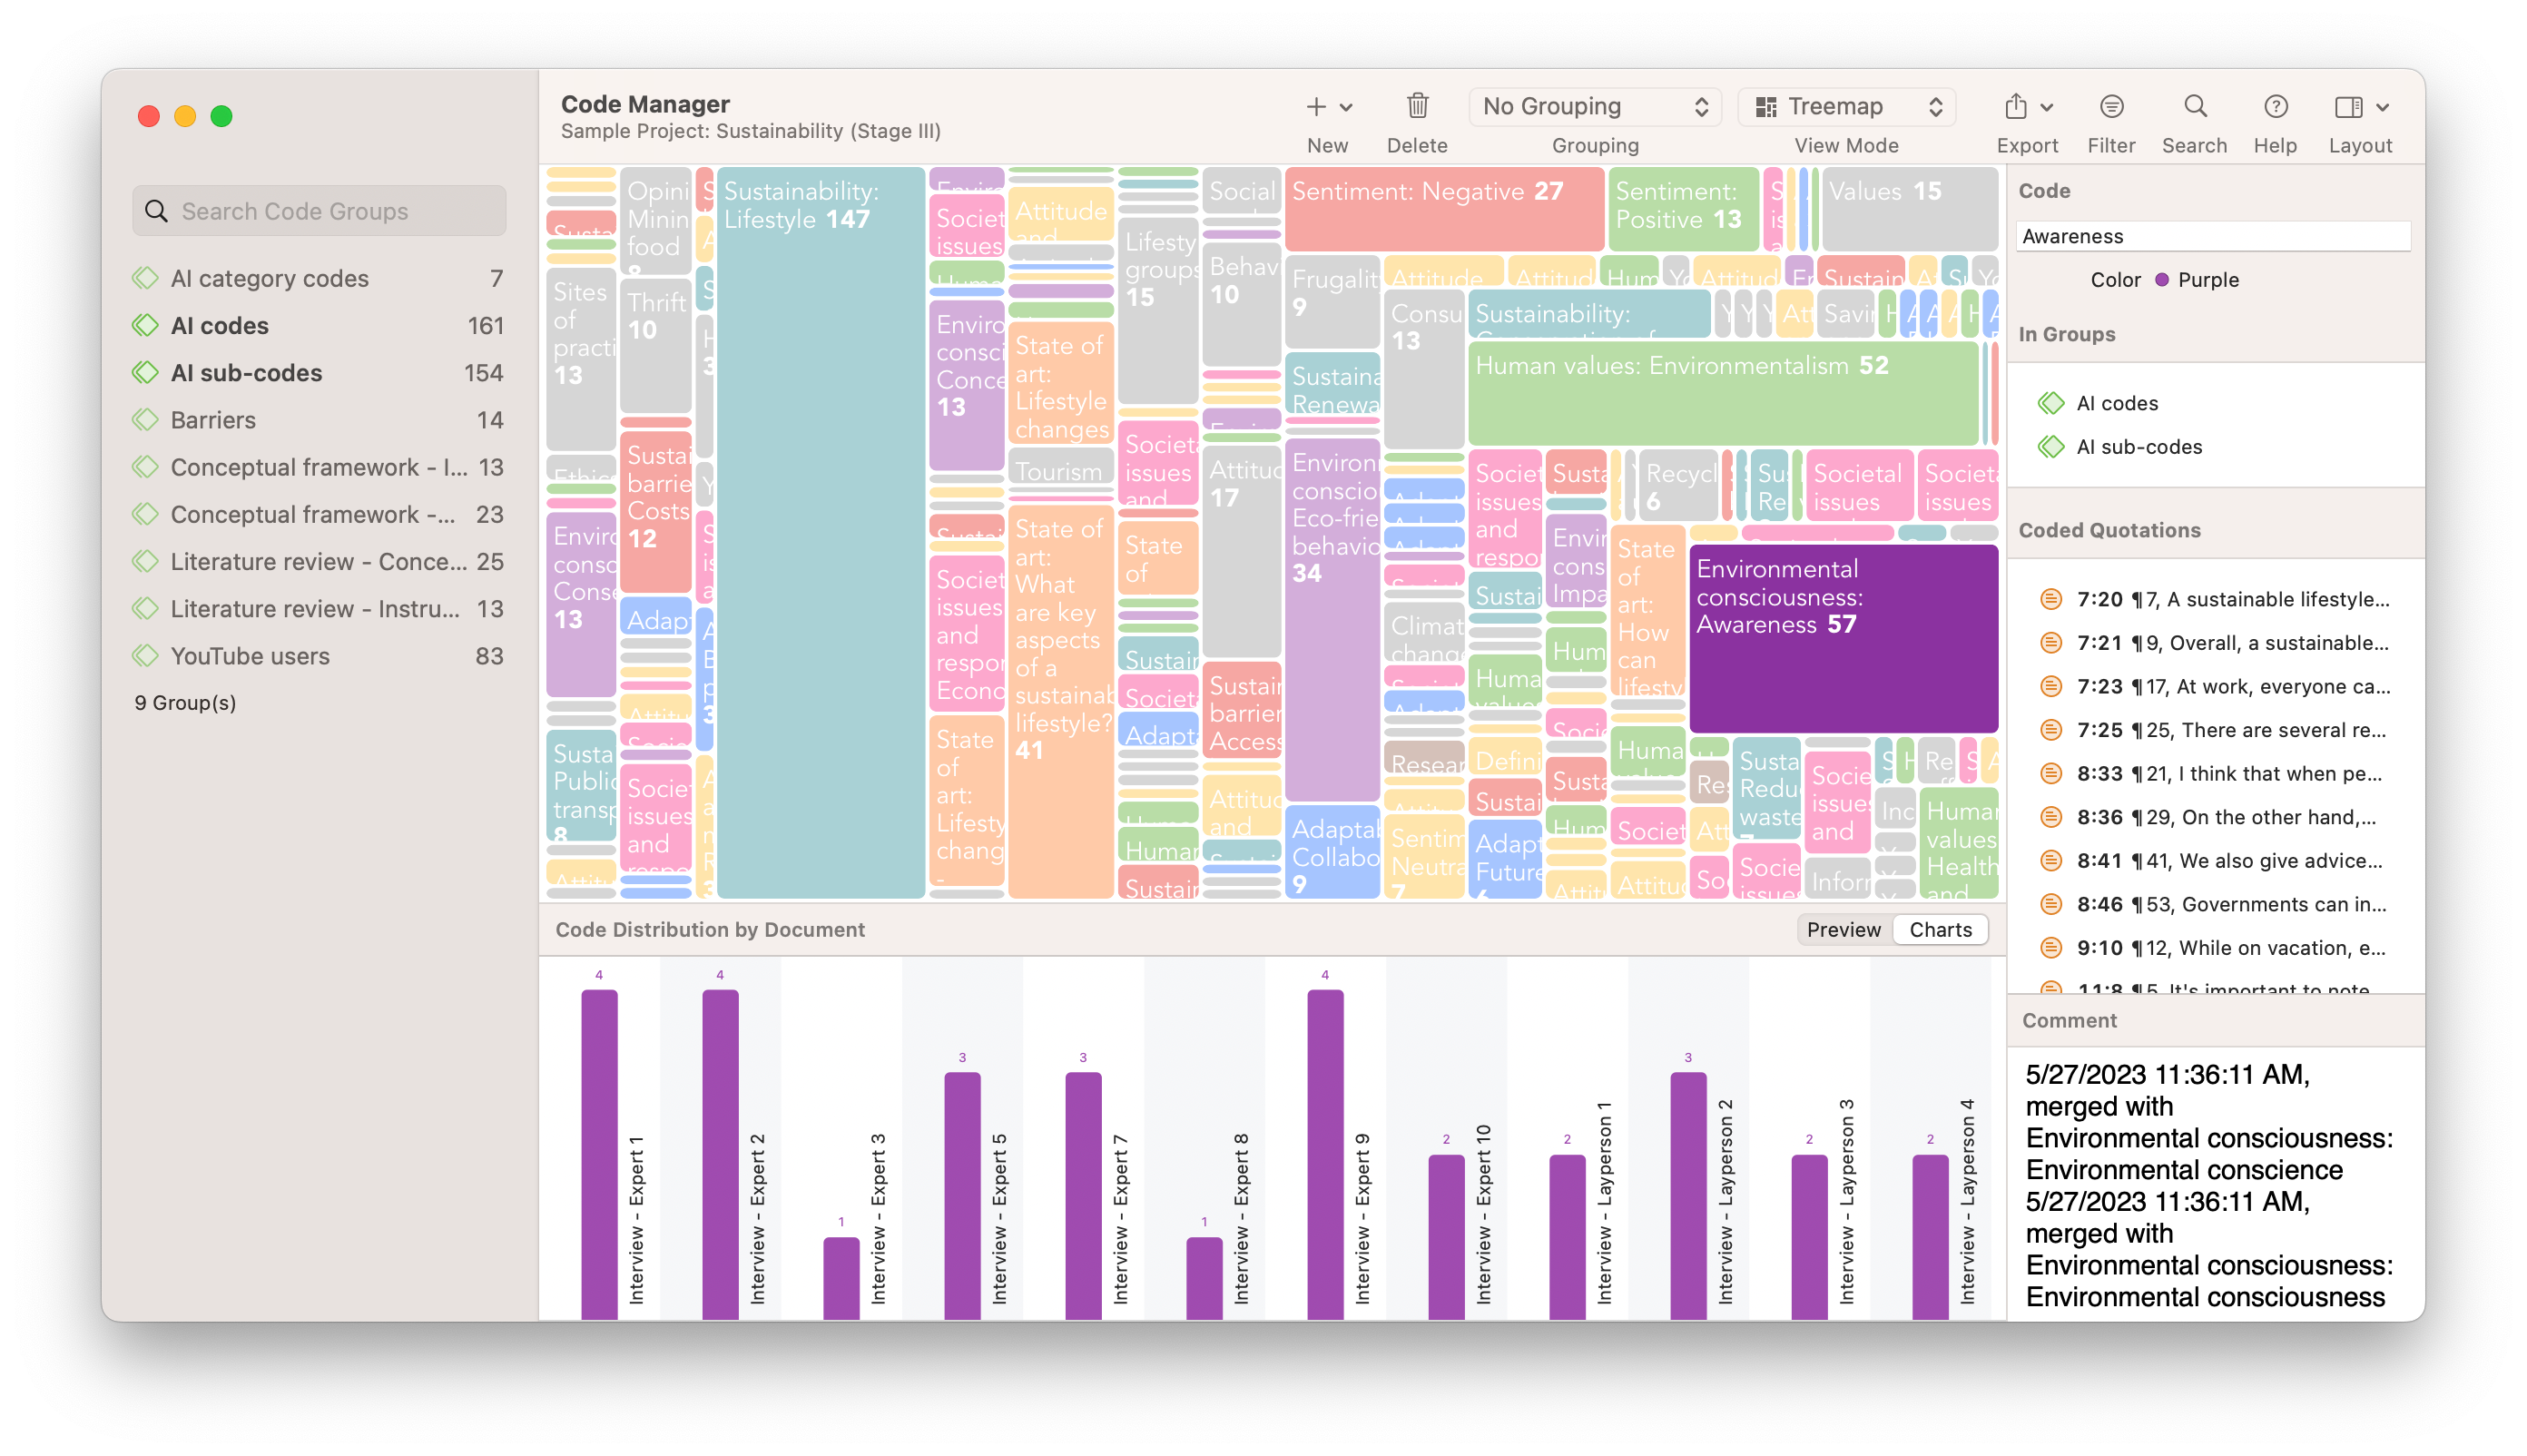
| Treemaps | ||
| Networks | ||
| Code clouds | ||
| Force-directed graphs | ||
| Sankey diagrams | ||
| Compatible Social Media Data | ||
| Twitter/X | ||
| YouTube | ||
| TikTok | ||
| Compatible Text Files | ||
| Microsoft Word | ||
| Plain text | ||
| Rich text files | ||
| PDF files | ||
| Open Office | ||
| HTML files | ||
| Office Open XML | ||
| Other Compatible Files | ||
| Images | ||
| Video files | ||
| Audio files | ||
| Geographical data | ||
| MOBI eBook files | ||
| Support | ||
| Technical support | ||
| Methodological guidance | ||
| Project optimization | ||
| 24/5 support via telephone, email, and live chat | ||
| Miscellaneous | ||
| Unlimited access to all software features and platforms with a single license | ||
| Real-time, online collaboration | ||
| Memos | Limited linking to project entities | Full flexibility to link memos to all project entities |
| Coded data retrieval | Complex query interface | Results dynamically change as data query options are selected |
| Intercoder agreement analysis | Percent agreement and Kappa coefficient only; no line chart for visual comparison | Multiple agreement measures and visualizations |
| Project sharing | Cloud storage available at extra cost | Cloud storage included in all licenses with no user restrictions |
| Dynamic use of multi-user licenses across multiple computers | Users must deactivate and reactivate license on different computers | Users can seamlessly log into ATLAS.ti Windows, Mac, and Web |
| AI-powered Data Analysis |
|
Intentional AI Coding
|
|
Conversational AI
|
|
AI Summaries
|
|
AI Suggested Codes
|
| Paper Search capabilities |
|
Free access to 200M+ papers
|
|
Streamlined literature search
|
|
Advanced filters for relevant papers
|
| Auto-Coding Tools |
|
Coding speakers in transcripts
|
|
Sentiment Analysis
|
|
Concepts Tool
|
|
Opinion Mining
|
|
Named Entity Recognition
|
|
Text Search
Sliding scale of text search options |
| Visualizations |
|
Treemaps
|
|
Networks
|
|
Code clouds
|
|
Force-directed graphs
|
|
Sankey diagrams
|
| Compatible Social Media Data |
|
Twitter/X
|
|
Facebook
|
|
YouTube
|
|
Instagram
|
|
TikTok
|
| Compatible Text Files |
|
Microsoft Word
|
|
Plain text
|
|
Rich text files
|
|
PDF files
|
|
Open Office
|
|
HTML files
|
|
Office Open XML
|
| Other Compatible Files |
|
Images
|
|
Video files
|
|
Audio files
|
|
Geographical data
|
|
MOBI eBook files
|
| Support |
|
Technical support
|
|
Methodological guidance
|
|
Project optimization
|
|
24/5 support via telephone, email, and live chat
|
| Miscellaneous |
|
Unlimited access to all software features and platforms with a single license
|
|
Real-time, online collaboration
|
|
Memos
Limited linking to project entities |
|
Coded data retrieval
Complex query interface |
|
Intercoder agreement analysis
Percent agreement and Kappa coefficient only; no line chart for visual comparison |
|
Project sharing
Cloud storage available at extra cost |
|
Dynamic use of multi-user licenses across multiple computers
Users must deactivate and reactivate license on different computers |
| AI-powered Data Analysis |
|
Intentional AI Coding
|
|
Conversational AI
|
|
AI Summaries
|
|
AI Suggested Codes
|
| Paper Search capabilities |
|
Free access to 200M+ papers
|
|
Streamlined literature search
|
|
Advanced filters for relevant papers
|
| Auto-Coding Tools |
|
Coding speakers in transcripts
|
|
Sentiment Analysis
|
|
Concepts Tool
|
|
Opinion Mining
|
|
Named Entity Recognition
|
|
Text Search
Full flexibility to customize searches |
| Visualizations |
|
Treemaps
|
|
Networks
|
|
Code clouds
|
|
Force-directed graphs
|
|
Sankey diagrams
|
| Compatible Social Media Data |
|
Twitter/X
|
|
Facebook
|
|
YouTube
|
|
Instagram
|
|
TikTok
|
| Compatible Text Files |
|
Microsoft Word
|
|
Plain text
|
|
Rich text files
|
|
PDF files
|
|
Open Office
|
|
HTML files
|
|
Office Open XML
|
| Other Compatible Files |
|
Images
|
|
Video files
|
|
Audio files
|
|
Geographical data
|
|
MOBI eBook files
|
| Support |
|
Technical support
|
|
Methodological guidance
|
|
Project optimization
|
|
24/5 support via telephone, email, and live chat
|
| Miscellaneous |
|
Unlimited access to all software features and platforms with a single license
|
|
Real-time, online collaboration
|
|
Memos
Full flexibility to link memos to all project entities |
|
Coded data retrieval
Results dynamically change as data query options are selected |
|
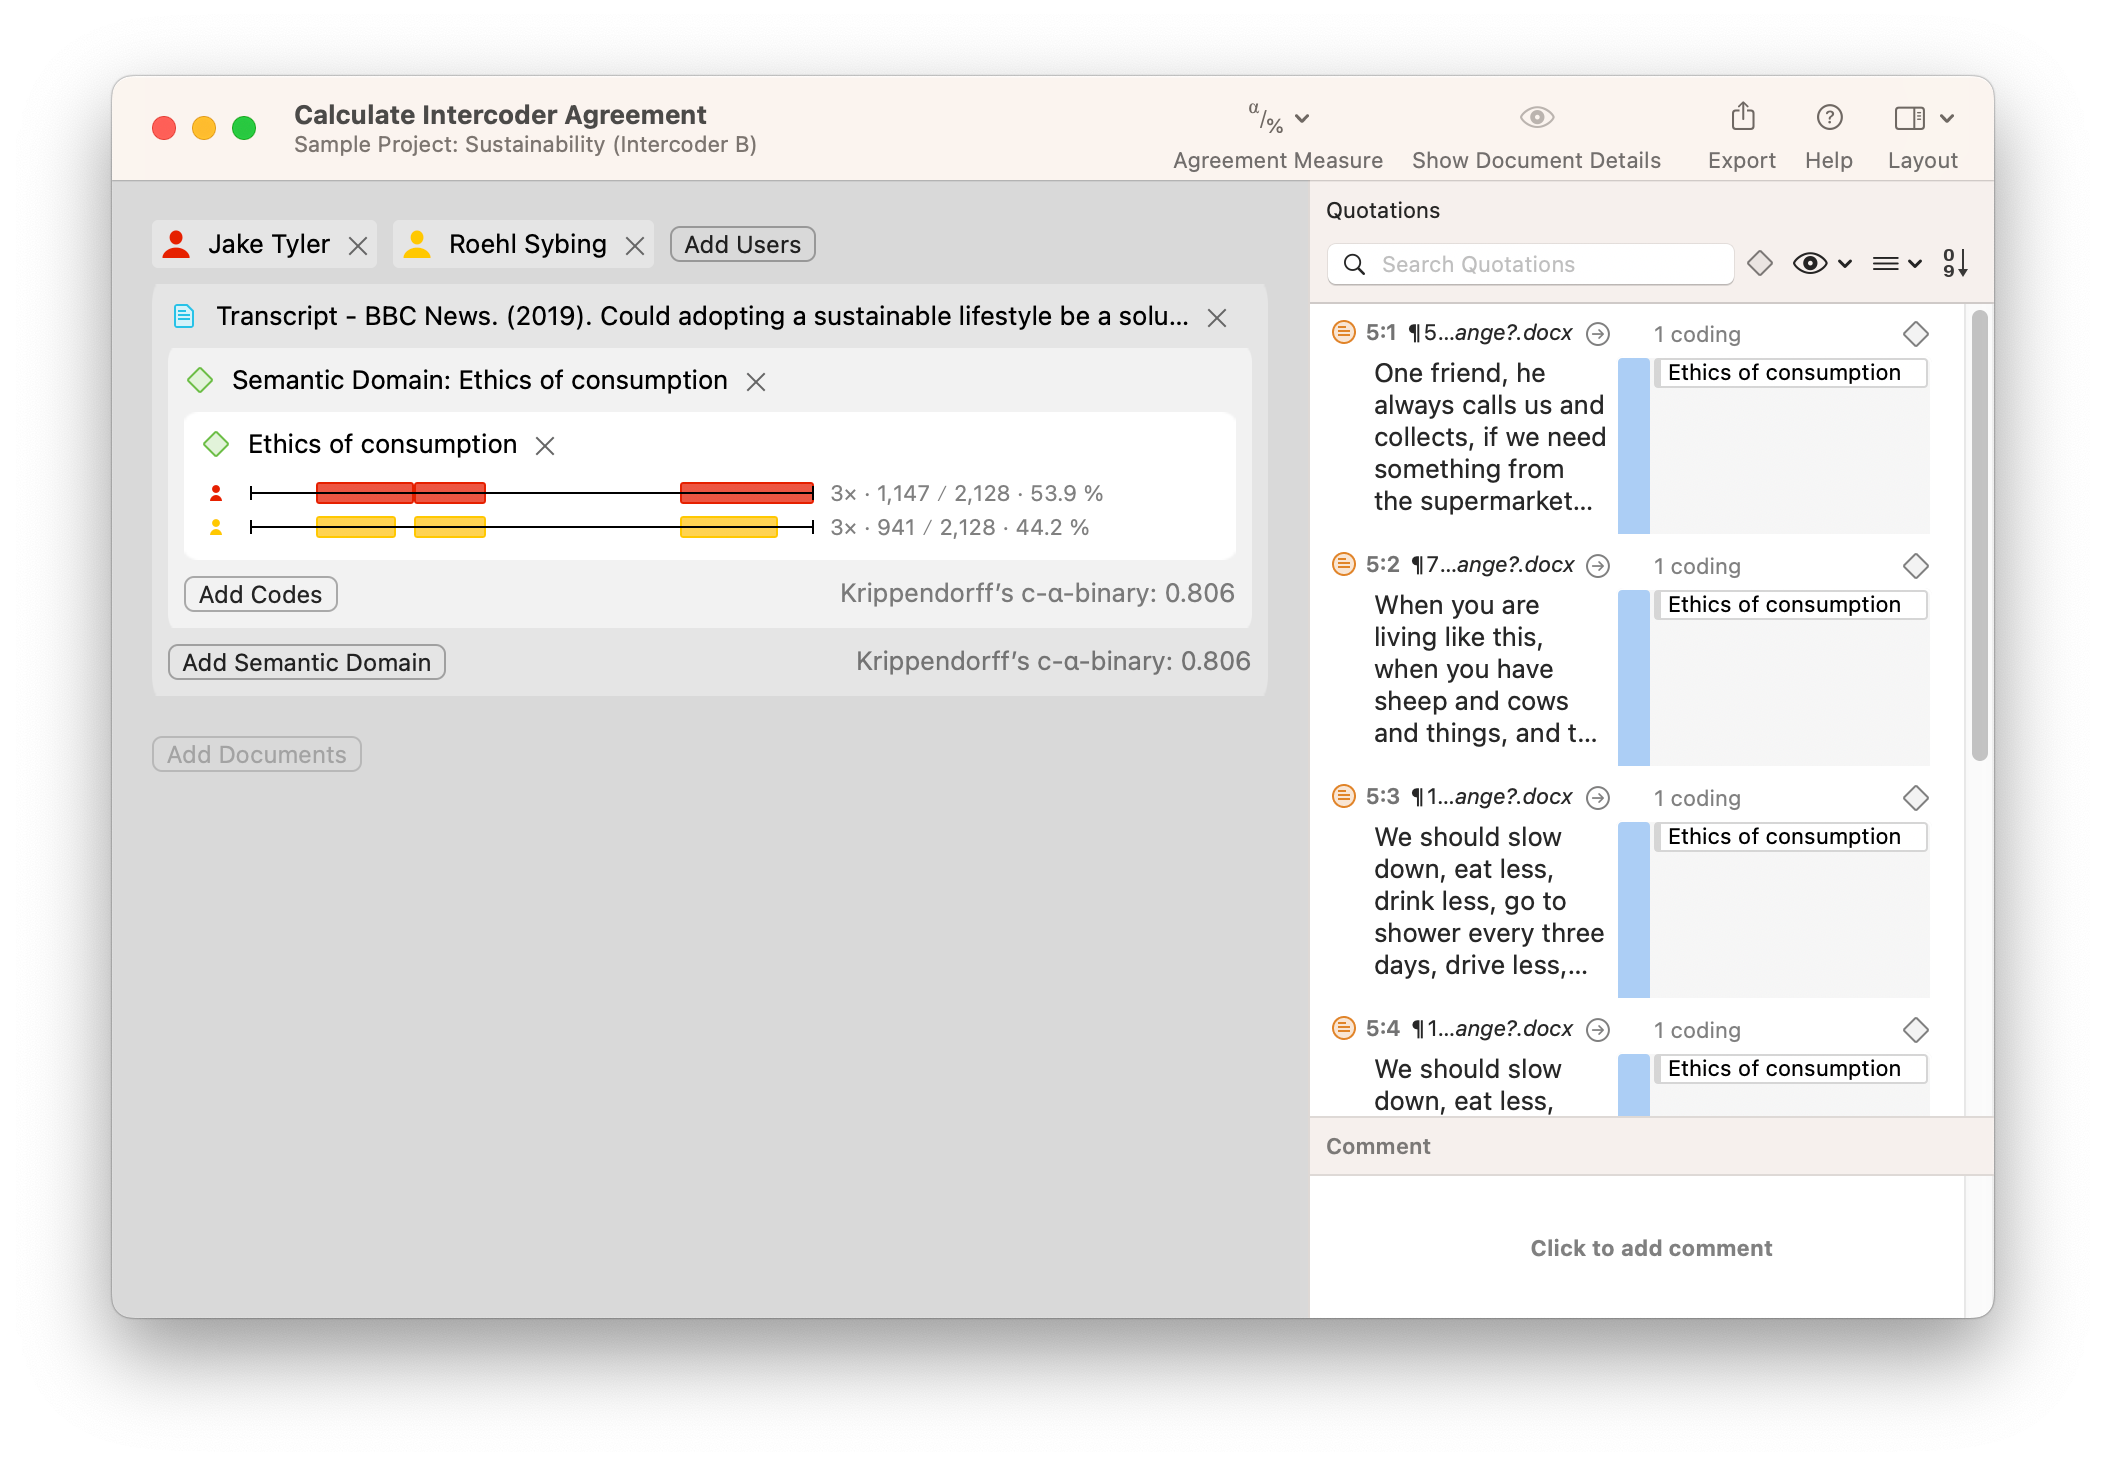
Intercoder agreement analysis
Multiple agreement measures and visualizations |
|
Project sharing
Cloud storage included in all licenses with no user restrictions |
|
Dynamic use of multi-user licenses across multiple computers
Users can seamlessly log into ATLAS.ti Windows, Mac, and Web |
What do researchers look for in CAQDAS?
When selecting computer-assisted qualitative data analysis software (CAQDAS), researchers prioritize several key factors that significantly enhance their analytical capabilities and streamline their research processes. The choice of software can affect everything from data organization to the depth of analysis achievable.
This section outlines crucial considerations researchers should keep in mind while choosing a QDA software program, focusing on features that will be discussed in detail later.
Comparing NVivo vs. ATLAS ti
Choosing the right qualitative data analysis software is critical for researchers who need efficient tools to organize, analyze, and interpret complex datasets. NVivo and ATLAS.ti are two of the leading software packages in this domain. Both offer powerful functionalities designed to support qualitative research, but they do so with different features and user experiences.
This section offers a detailed comparison of the key features of NVivo and ATLAS.ti, allowing you to understand which software might best fit your project's requirements.
- Coding Features
- Literature Review Capabilities
- Text Search
- Artificial Intelligence
- Data Analysis Tools
- Data Visualization
- Memoing Capabilities
- Interface and Usability
- Data Organization
- Real-Time Collaboration
- Desktop Cloud Storage
- Supported Data Types
- Comprehensive Support System
- Putting It All Together
Coding Features
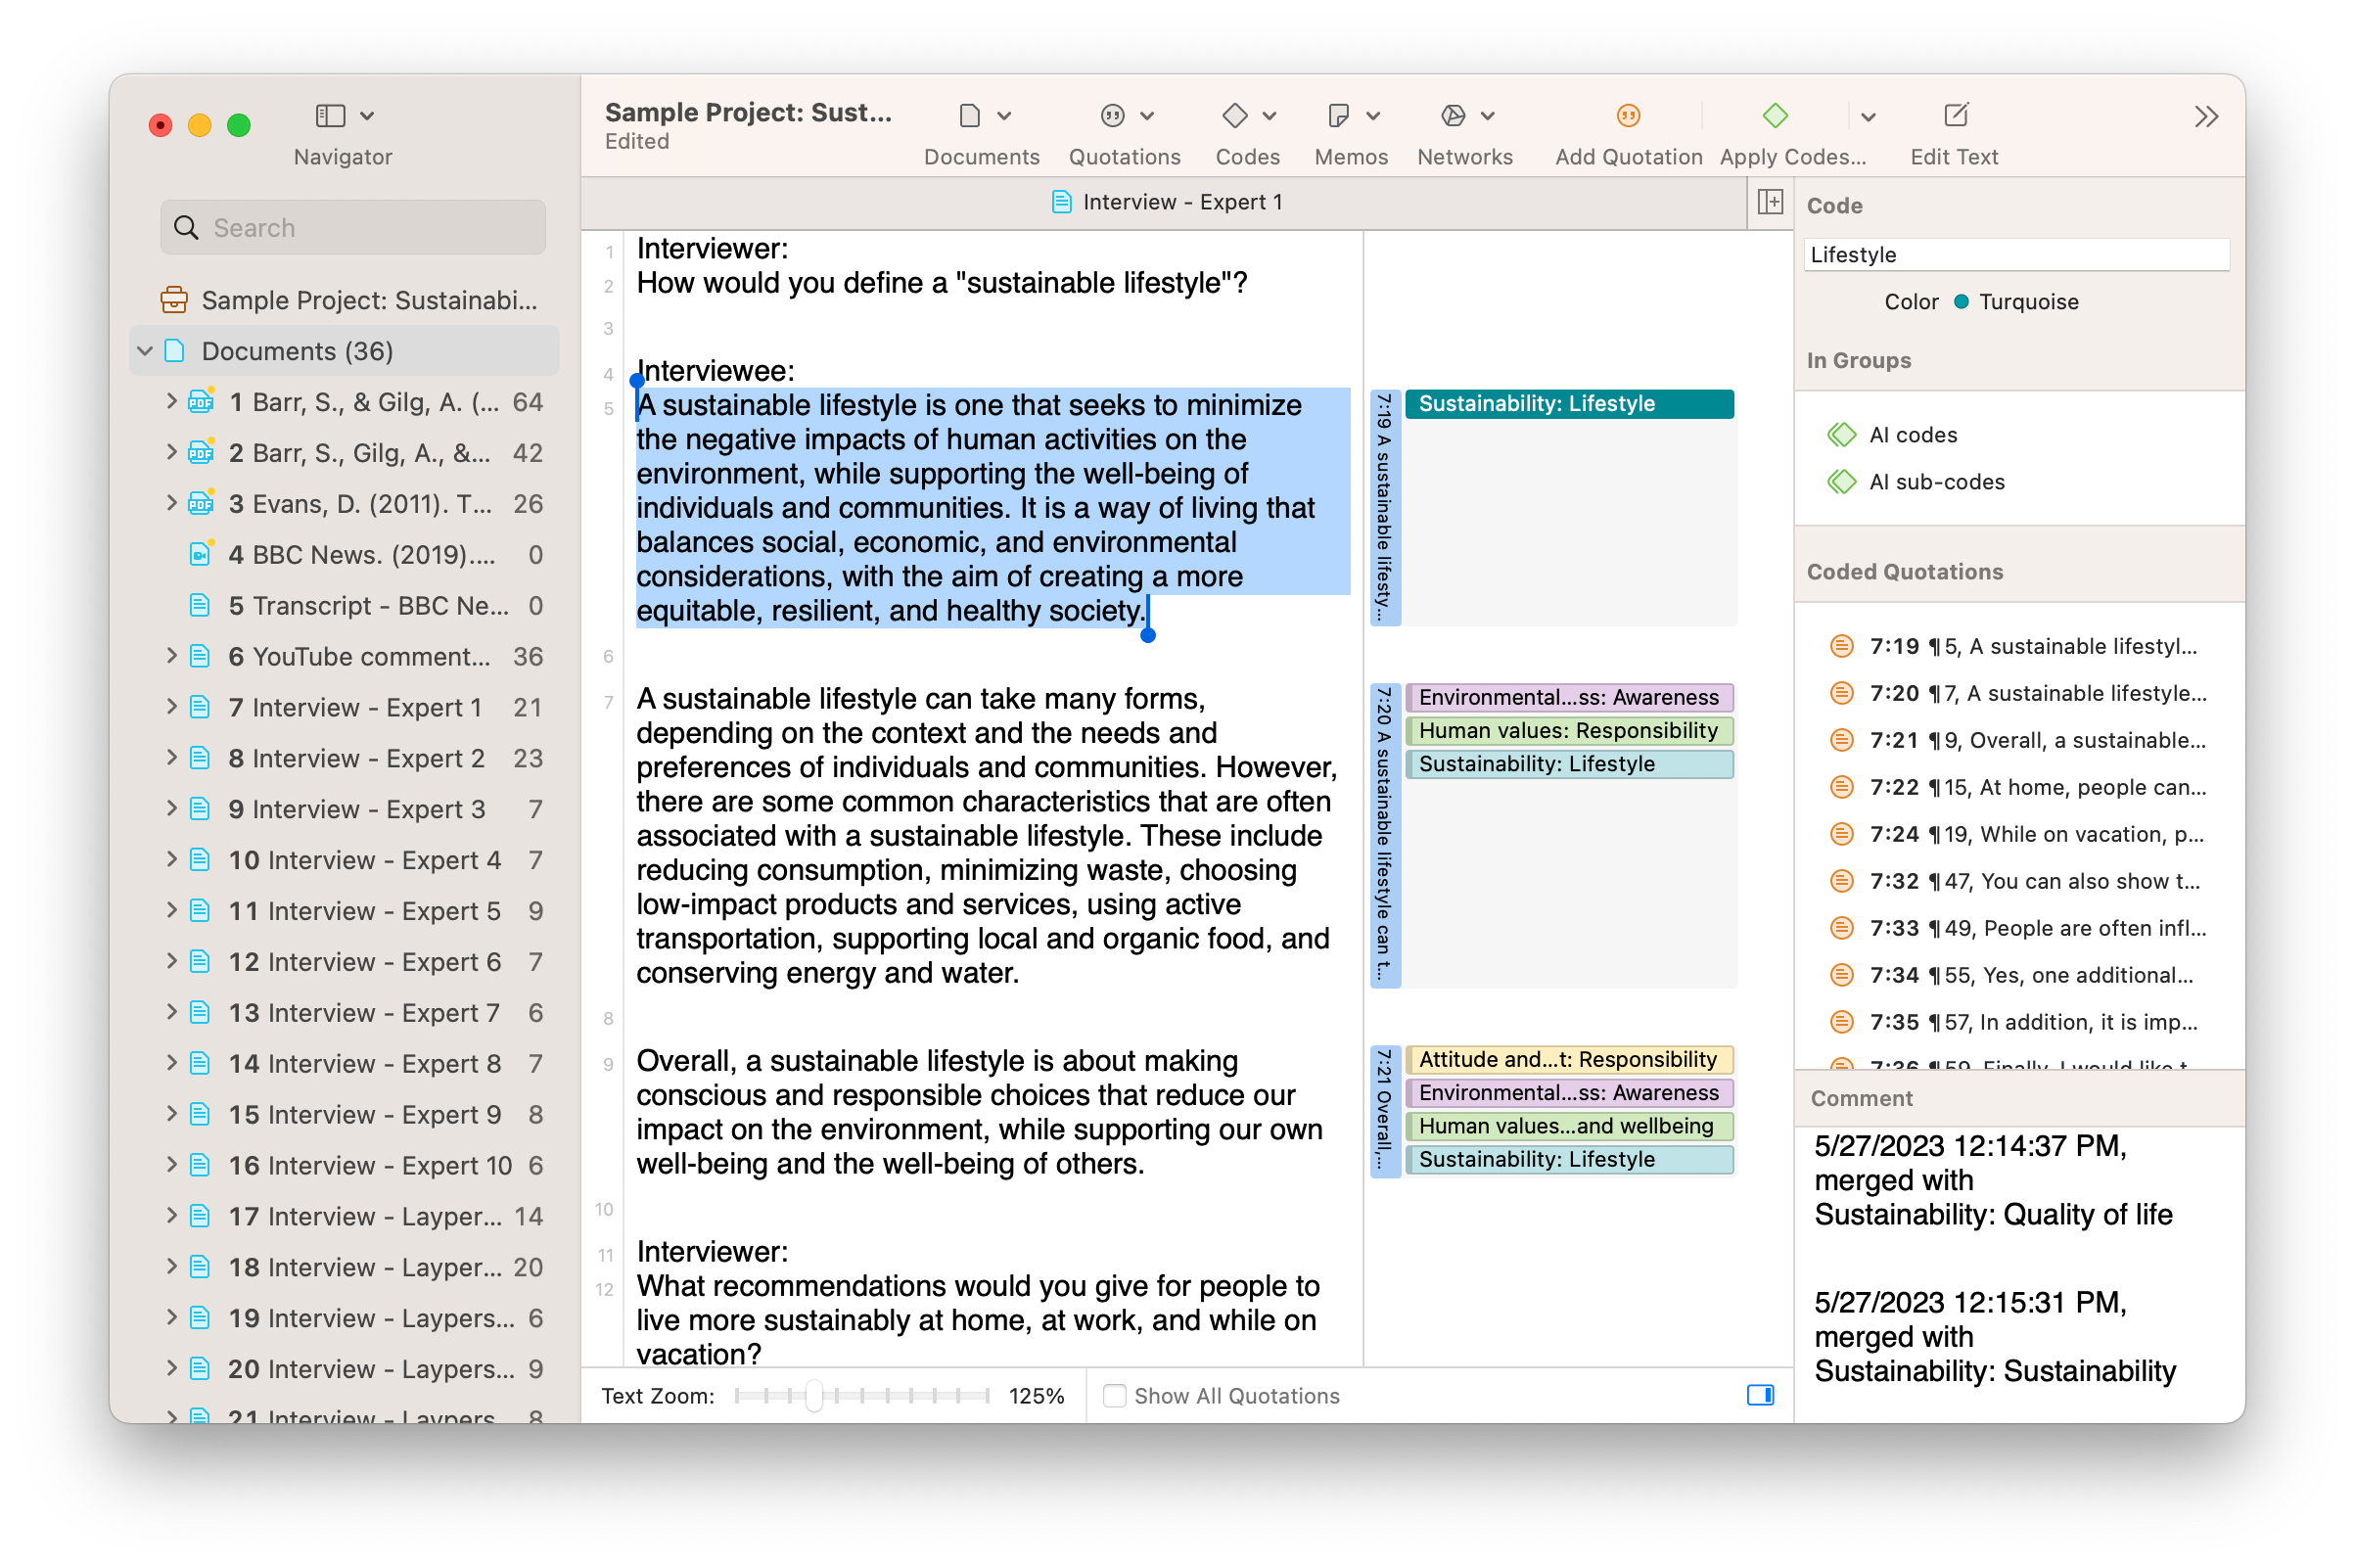
Coding is a fundamental process in qualitative research, where data is categorized and tagged to identify significant themes and patterns. ATLAS.ti offers a superior coding experience with its intuitive and dynamic interface, allowing researchers to efficiently organize and analyze qualitative data.
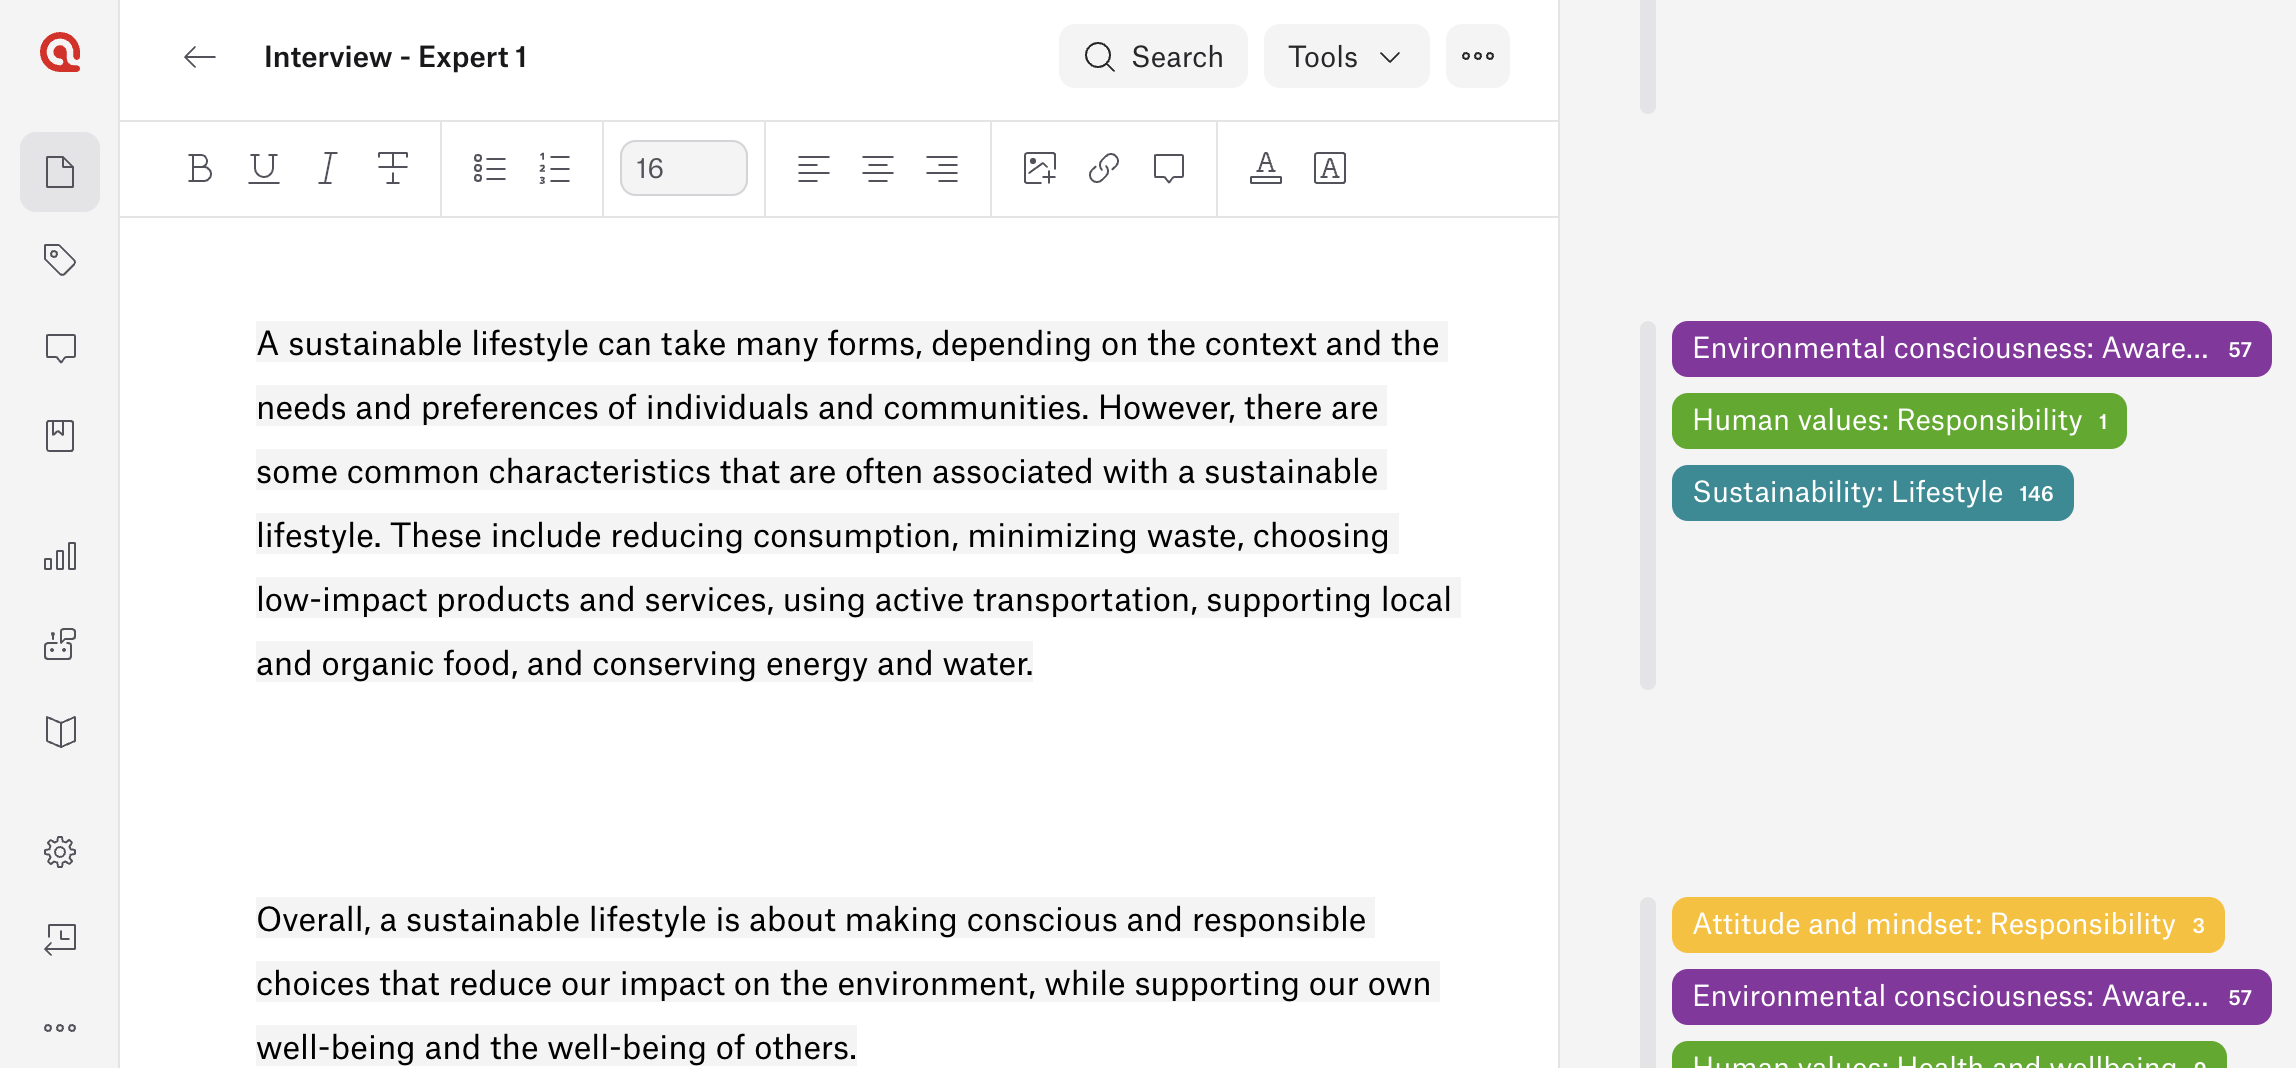
The software tools in ATLAS.ti support a hands-on approach to coding, enabling users to highlight text segments and directly apply or create new codes. Codes can be added using keyboard shortcuts, drag-and-drop, or clicking on the button for coding. Moreover, researchers can see all their codes in a single screen, making it easy to use any already-existing codes or create new codes (including AI-suggested codes). This immediate interaction streamlines the coding process and enhances analytical precision.
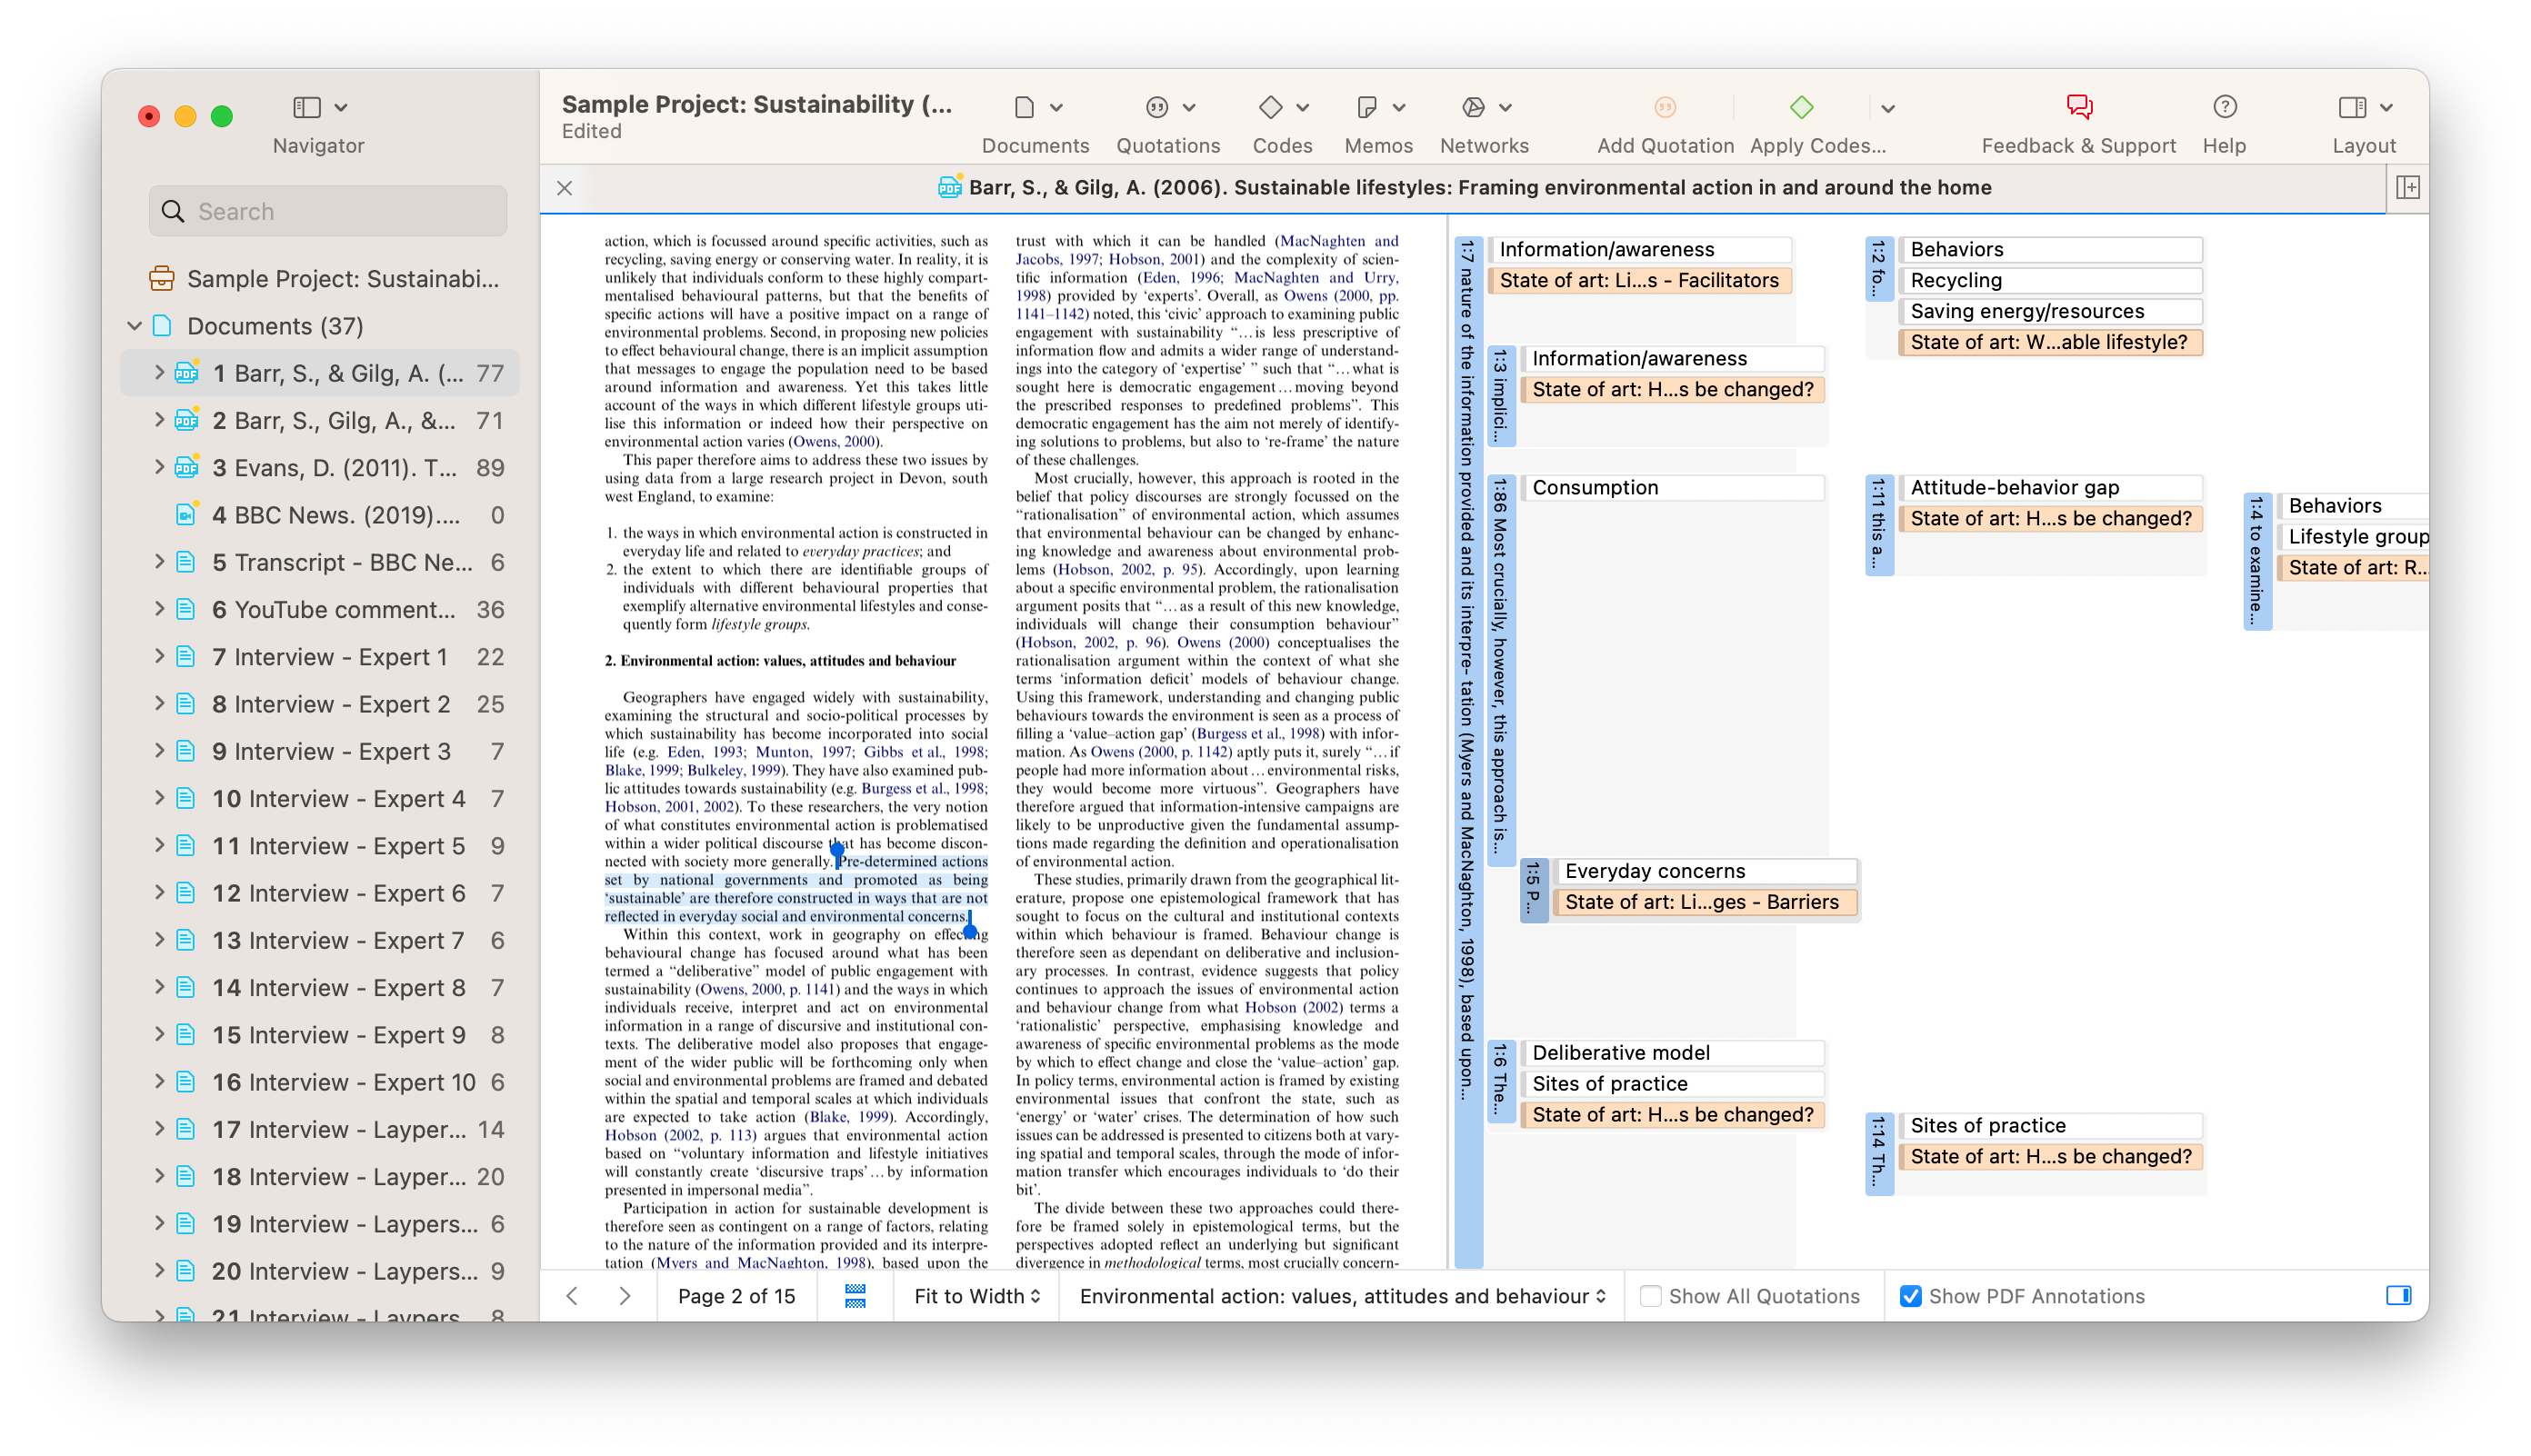
Coding capabilities in NVivo, on the other hand, are less integrated and more cumbersome, requiring multiple mouse-clicks and separate software windows to create new codes. This can slow down the coding process and distract researchers from their data analysis. In addition, once a segment of data has been coded, there is no straightforward option to edit the highlighted segment in case researchers would like to adjust which portion of data the code should cover. In contrast, the ATLAS.ti interface was always designed to prioritize ease-of-use: researchers can highlight data segments, attach codes, and edit any of the codings all within the main screen.
Literature Review Capabilities
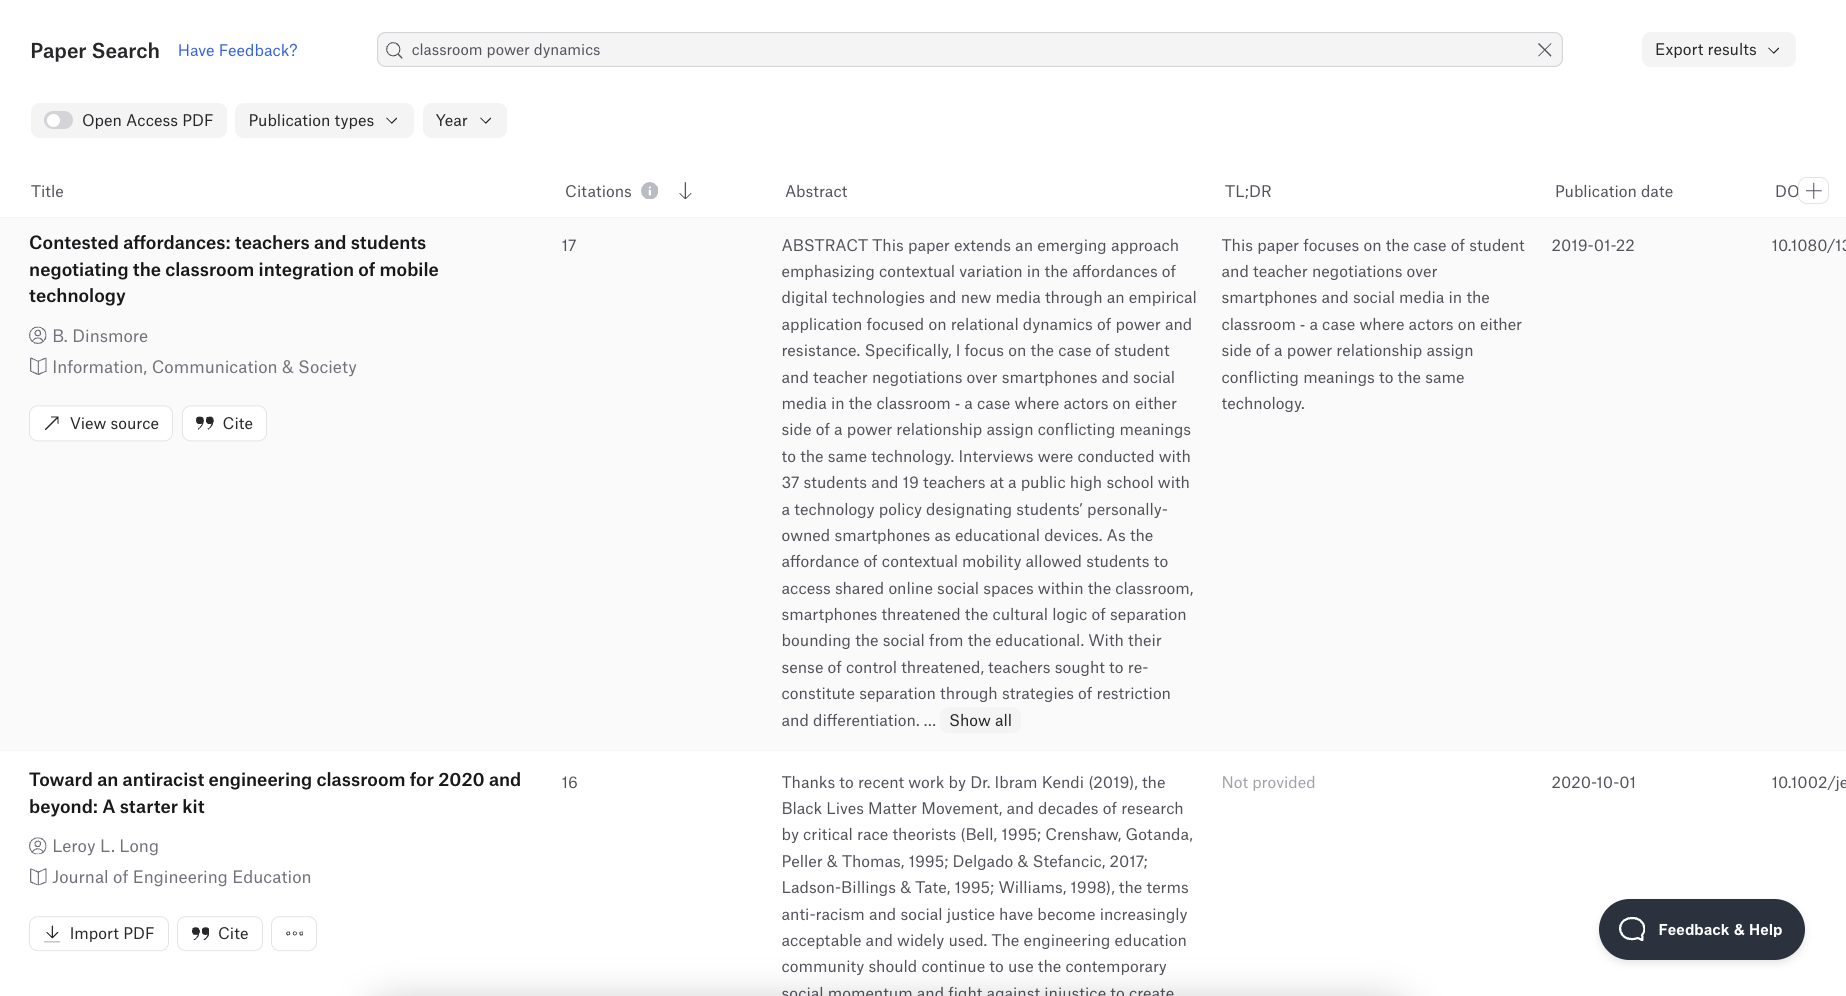
One of the most important components of any project is a strong theoretical foundation based on existing research. As a result, the advantage goes to the QDA platform that makes it easier to build your literature review. ATLAS.ti Web's Paper Search tool allows users to search from over 200 million articles available through Semantic Scholar and import the most relevant articles directly into their project. NVivo has no equivalent features, leaving users to manually build their literature review using separate tools. ATLAS.ti's Paper Search is fully integrated into our Web platform, featuring streamlined search and advanced features in a seamless workflow to jump start any research project.
Text Search
When you need to code more quickly, ATLAS.ti has more flexible Text Search capabilities. NVivo's Text Search Query provides search options on a sliding scale between exact matches to full generalizations. On the other hand, ATLAS.ti's Text Search gives full control with options for synonyms and base forms, letting the user fully tailor their search query as they see fit.
ATLAS.ti's autocoding capabilities extend to tools such as Opinion Mining and Named Entity Recognition that employ language models to identify relevant text segments quickly and easily. These tools also give users the chance to review the automated results before the data is coded, ensuring that researchers continue to have discretion over their project.
Artificial Intelligence
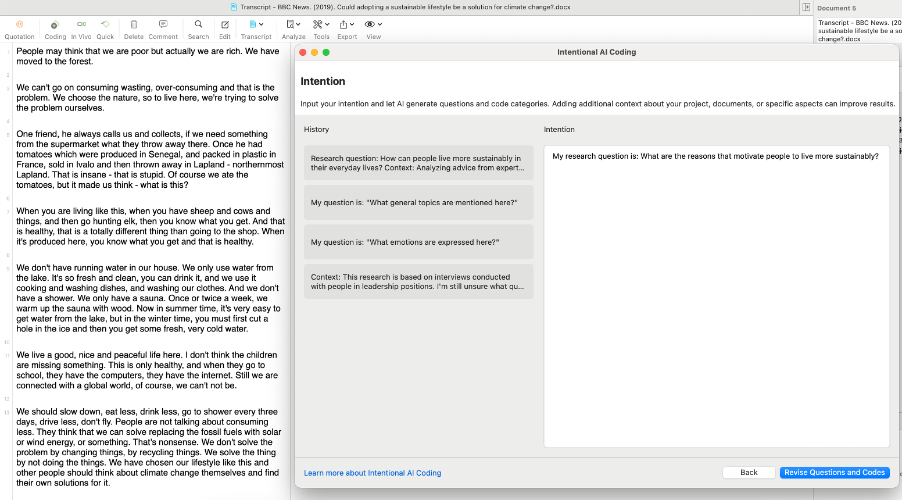
ATLAS.ti's artificial intelligence tools include Intentional AI Coding, which allows researchers to direct the AI in coding data based on specific research objectives. This contrasts with NVivo's more general AI capabilities, which apply simple keywords without the researcher's ability to specify their research questions or intentions.
The AI-powered coding tools in ATLAS.ti provide researchers with a level of flexibility that NVivo does not. With ATLAS.ti, users can choose to automatically code entire documents through AI Coding or Intentional AI Coding or selected segments of data with AI Suggested Codes. Whether researchers want to have a preliminary code hierarchy to develop or just need a head start with their coding, ATLAS.ti has a variety of tools to accommodate every research strategy.
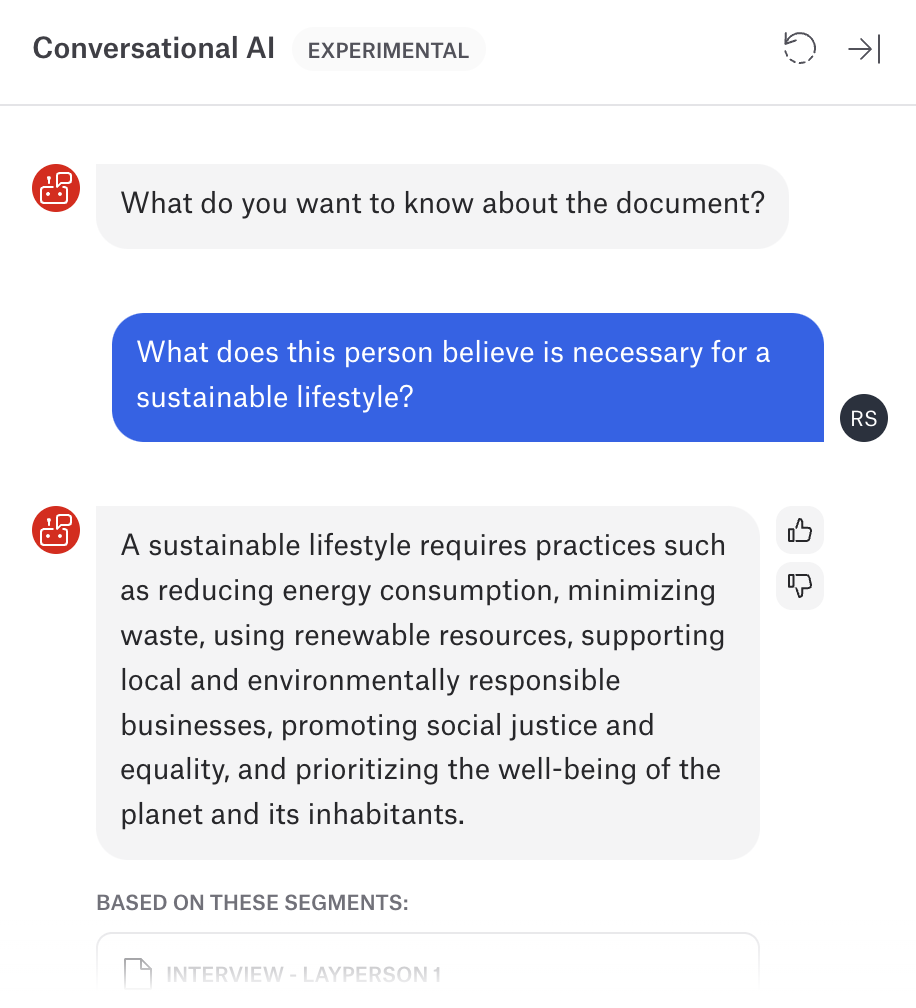
ATLAS.ti's data analysis capabilities are further augmented by AI-driven features that assist in uncovering patterns and suggesting new avenues of inquiry with tools that aren't available in NVivo. AI Summaries and Conversational AI, in particular, are there to aid researchers get the most out of their data, identifying the salient points of any textual data and summarizing data sets efficiently and quickly. These AI tools provide preliminary analyses that can be refined and expanded by researchers, thus accelerating the analytical process and enriching the insights obtained.
Data Analysis Tools
Effective data analysis tools are crucial for qualitative researchers to examine complex relationships within their data and draw meaningful conclusions. ATLAS.ti offers robust, integrated tools that simplify and enhance the analysis of qualitative data.
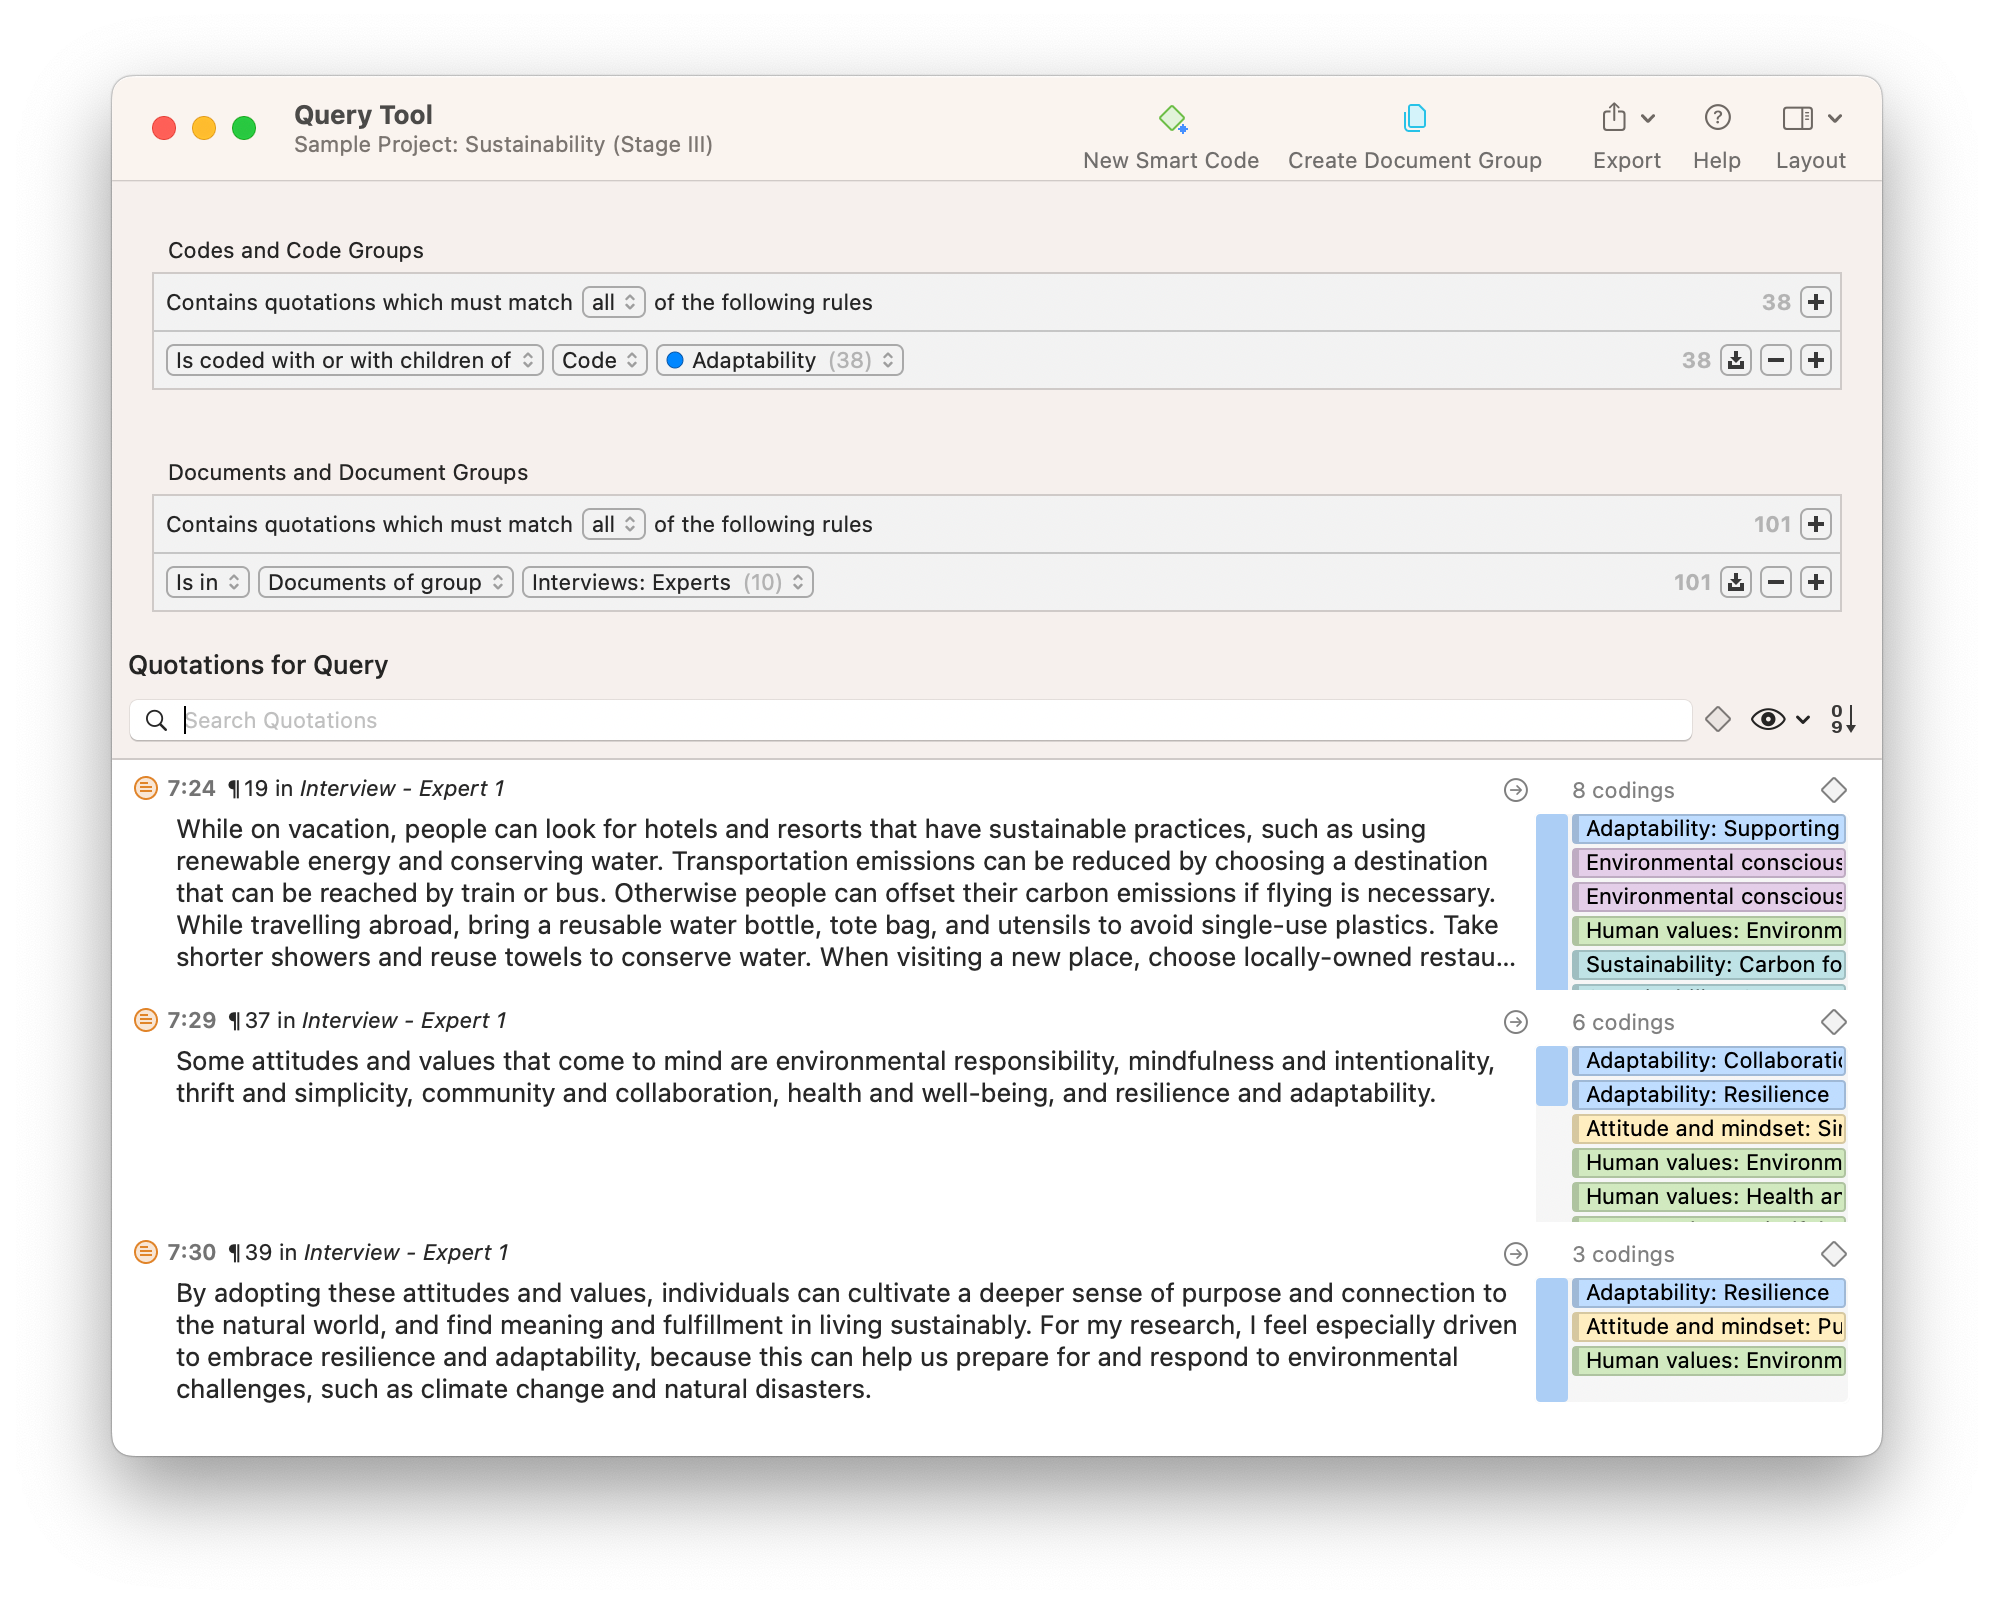
ATLAS.ti's Query Tool, for example, enables researchers to perform complex queries through a single, user-friendly interface, rather than having to use multiple tools as in the case of NVivo. This one feature allows for the combination of different codes and attributes defined by document groups, facilitating a thorough exploration of data connections without the need for other software tools or complicated operations. Moreover, results of queries in ATLAS.ti can be saved as a "smart code", which will automatically update itself if any new coded data fits the query.
Data Visualization
Data visualization is essential in qualitative research for illustrating complex relationships and enhancing the interpretability of data. Compared to NVivo, ATLAS.ti provides more intuitive and flexible options for data visualization, offering a comprehensive suite of visualization tools that transform qualitative analysis into engaging and informative visual displays.
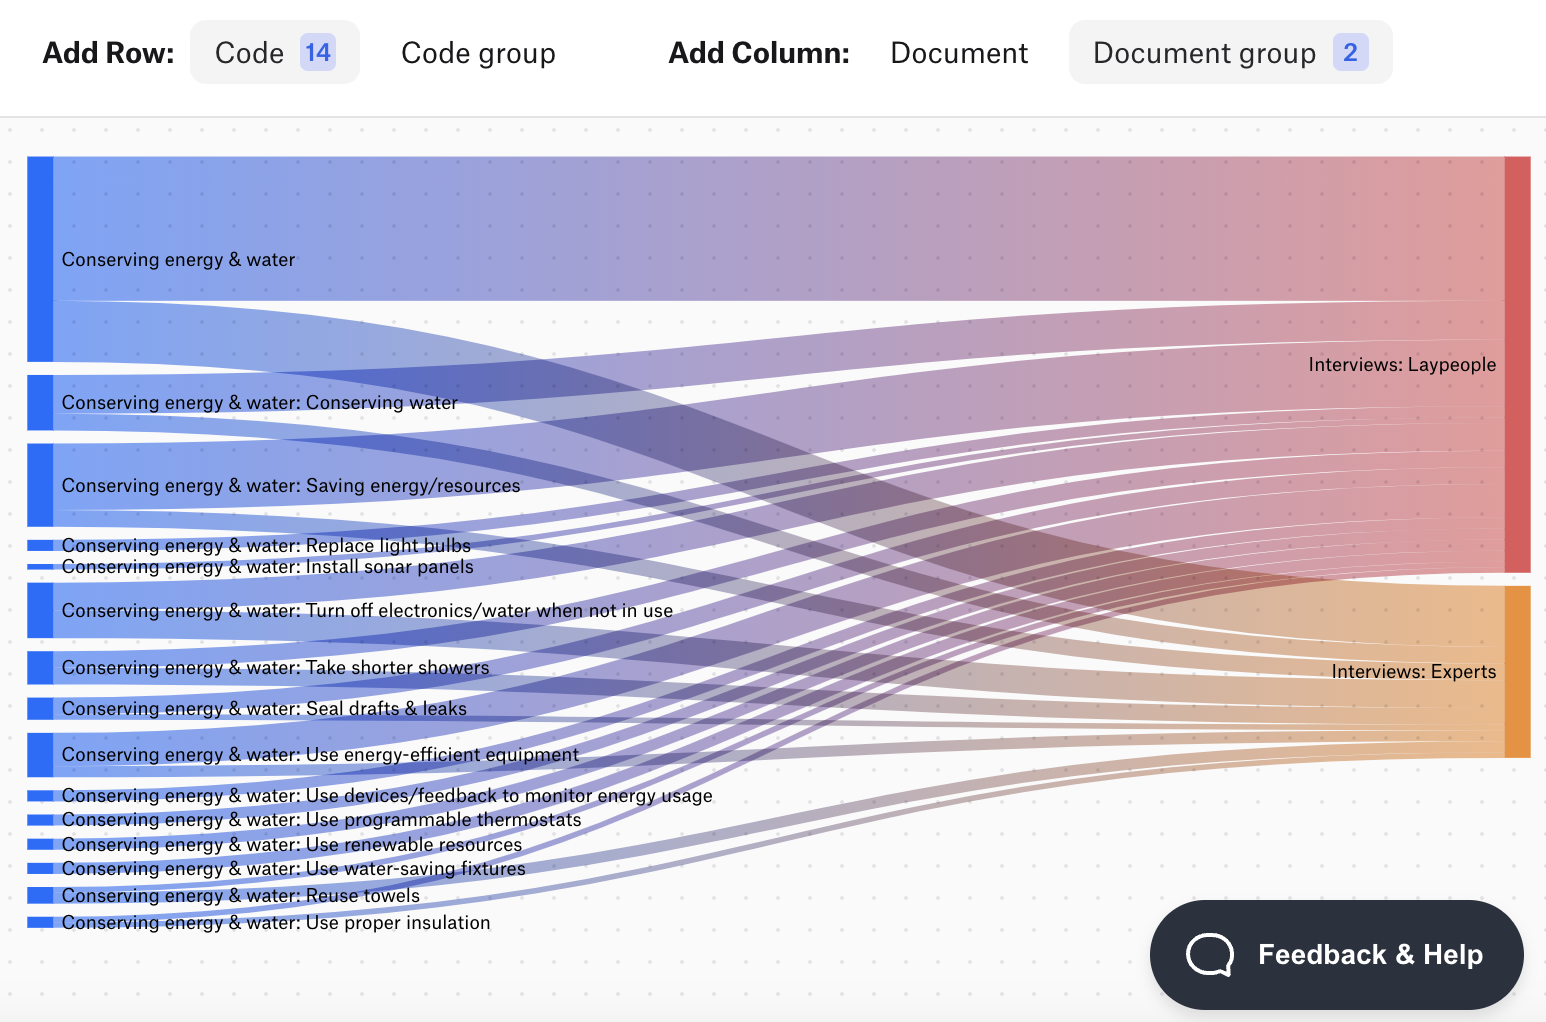
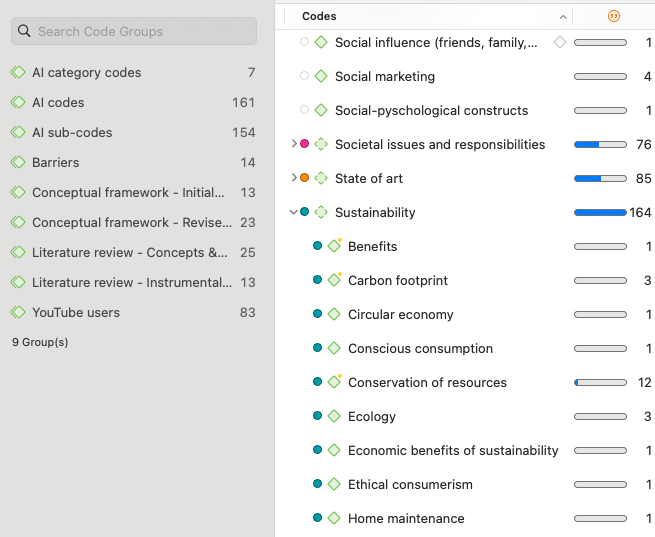
With Sankey diagrams, force-directed graphs, and code clouds, ATLAS.ti users have more options for visualizing critical insights and persuading research audiences that are not available in NVivo. These different displays are invaluable for depicting how themes and concepts interconnect, providing a visual narrative that supports the development of theoretical insights. For instance, researchers can create Sankey diagrams to convey relationships among codes and coding frequencies across their data in an easy-to-understand visual display. Such visualizations are not just illustrative but also interactive, allowing researchers to manipulate and explore data relationships in real-time, which offers significant advantages for making sense of the data.
ATLAS.ti's ability to create network views offers researchers dynamic ways to visualize connections between codes, documents, memos, or any other part of their project. When working in networks, researchers can continue to code their data and import any other related parts of their project. With a single click, researchers can see the data underlying any part of the visual displays available throughout ATLAS.ti.
NVivo offers multiple, distinct mapping tools which can make it difficult for users to integrate their insights across the different parts of their project. In contrast, ATLAS.ti prioritizes intuitiveness: Networks in ATLAS.ti are highly flexible, permitting users to visualize any part of their project in a single network.
Memoing Capabilities
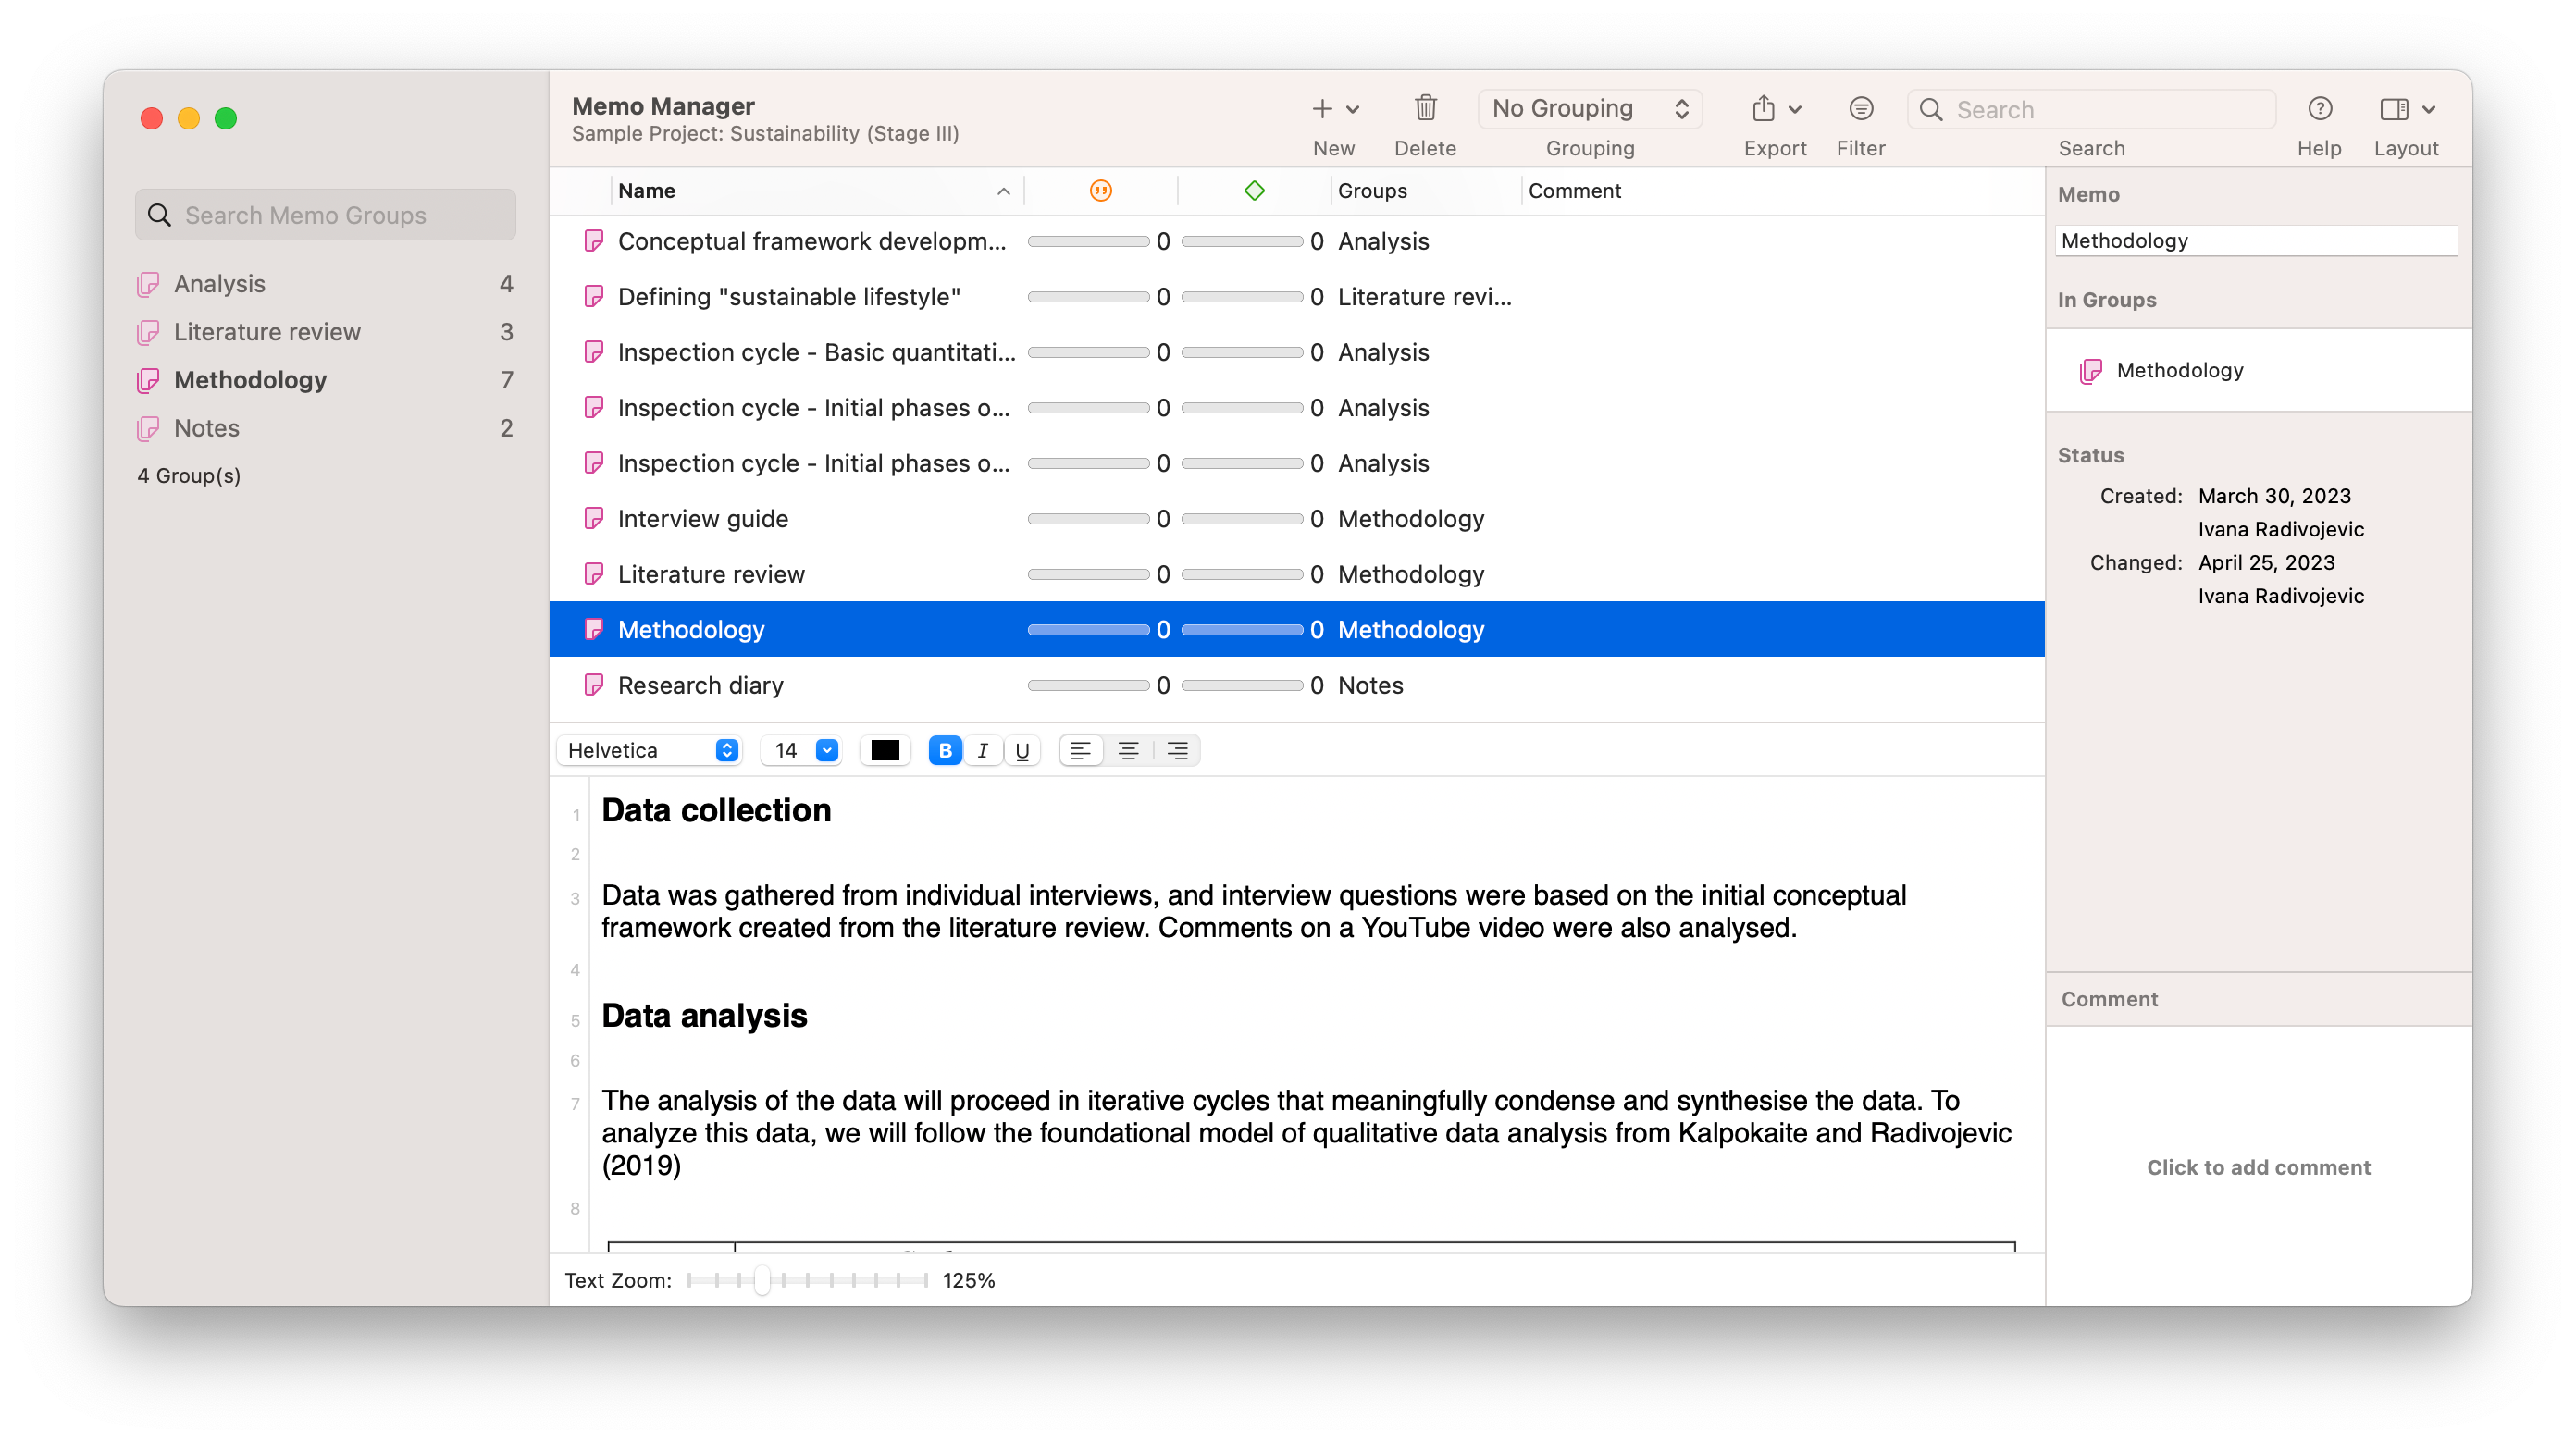
Research notes are essential for turning data into core insights. ATLAS.ti memos facilitate the integration of detailed theoretical notes directly within the analysis workspace. Researchers can use these memos to record insights, link concepts, and systematically build a coherent theoretical framework throughout their analysis process.
Unlike NVivo, where memos serve primarily as annotations, ATLAS.ti integrates these memos more dynamically within the analytical process. This integration allows researchers to maintain an active, ongoing dialogue with their data, crucial for evolving theoretical insights in real-time.
Memos in ATLAS.ti can be directly linked to specific data segments, codes, documents, or groups, enhancing the ability to trace the development of ideas and ensuring interpretations are directly connected to the data. Most importantly, memos can be linked to multiple project entities without restriction, unlike in NVivo, where memos can only be linked to one document. This level of flexibility ensures that researchers can tailor their project to their specific methodological needs, making the tools more relevant and effective across different research scenarios.
Interface and Usability
An intuitive interface and usability are key for enabling researchers to effectively navigate and utilize qualitative data analysis software. ATLAS.ti offers a user-friendly interface that simplifies the research process by making tools easily accessible and reducing the complexity of managing extensive data sets.
The layout of ATLAS.ti is designed to be straightforward, with all major functions readily available from the main workspace. This organization helps researchers stay focused on their analysis without getting distracted by cumbersome navigation.
The multi-tab functionality allows for seamless transitions between different aspects of a project, such as moving from data coding to writing memos or generating visualizations. This ease of navigation is a significant advantage, especially for new users who might be overwhelmed by more complex software environments.
In comparison, NVivo presents a more intricate interface that often involves a steeper learning curve. Its array of features and settings can require users to spend more time learning the software, potentially slowing down the initial stages of research. Accessing different parts of the project often require multiple clicks and waiting for new windows to load. In contrast, ATLAS.ti users can view all of their codes, documents, memos, networks, and groups in a single left-hand panel, making it easy for users to work with and connect any part of their project.
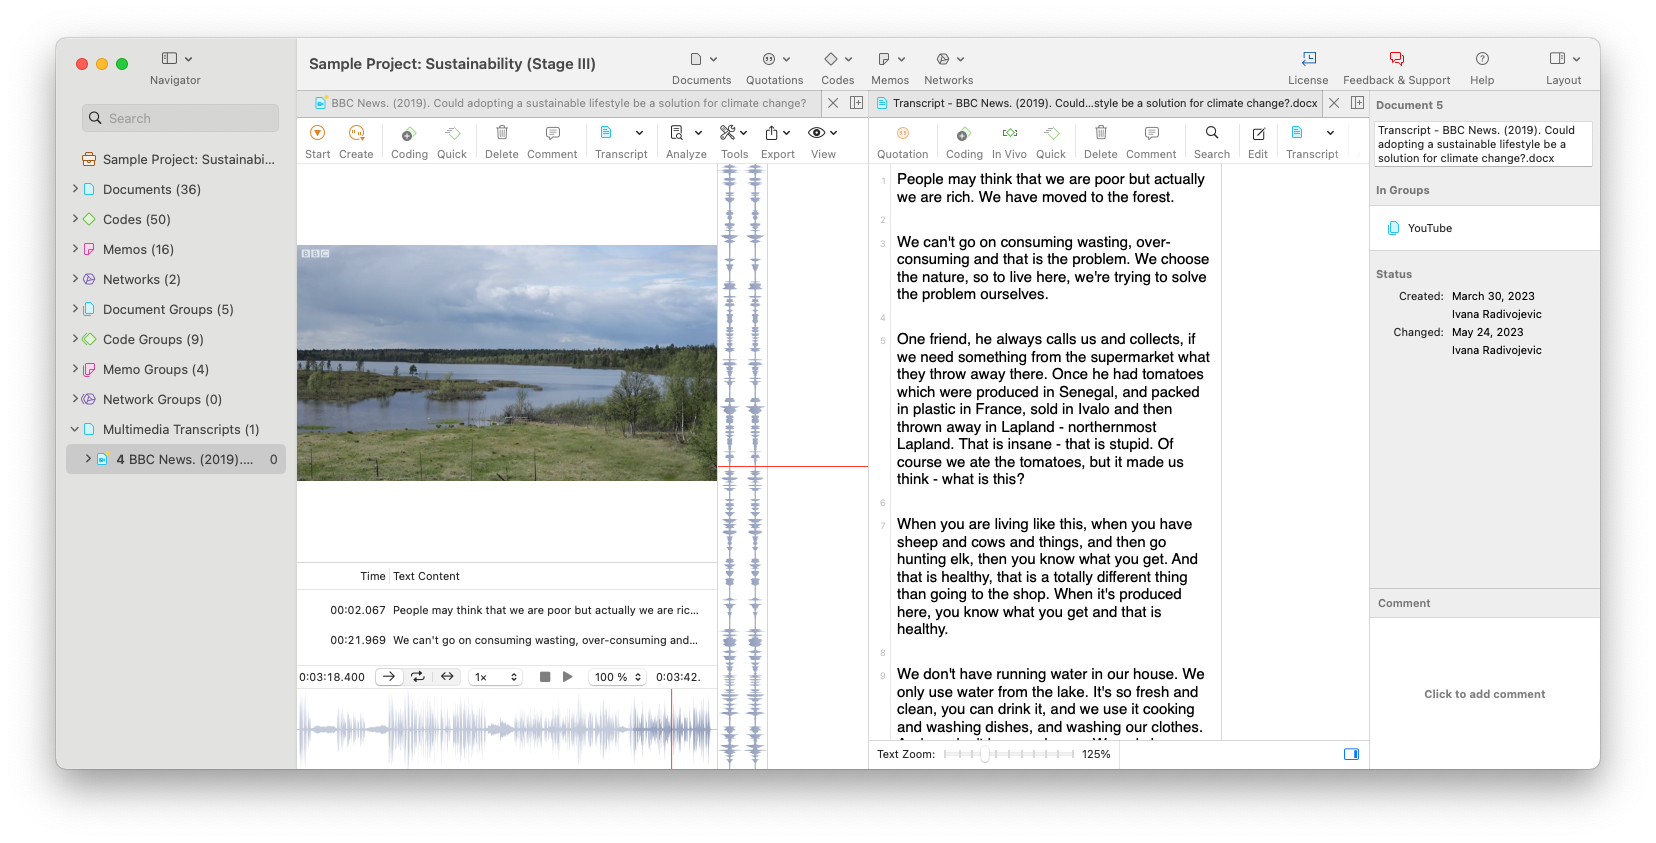
ATLAS.ti also prioritizes customization, allowing researchers to adapt the interface to better suit their workflow. This is especially useful when, for example, coding multimedia data along with its associated transcripts, which can be viewed side-by-side in the same interface. This level of personalization can enhance efficiency and make the analysis process more aligned with individual preferences and research requirements.
Data Organization
Effective data organization is fundamental to managing and interpreting the vast amounts of information typically involved in qualitative research. ATLAS.ti excels in providing sophisticated tools that facilitate the structured organization of diverse data types, enhancing both the efficiency of data handling and the depth of analysis.
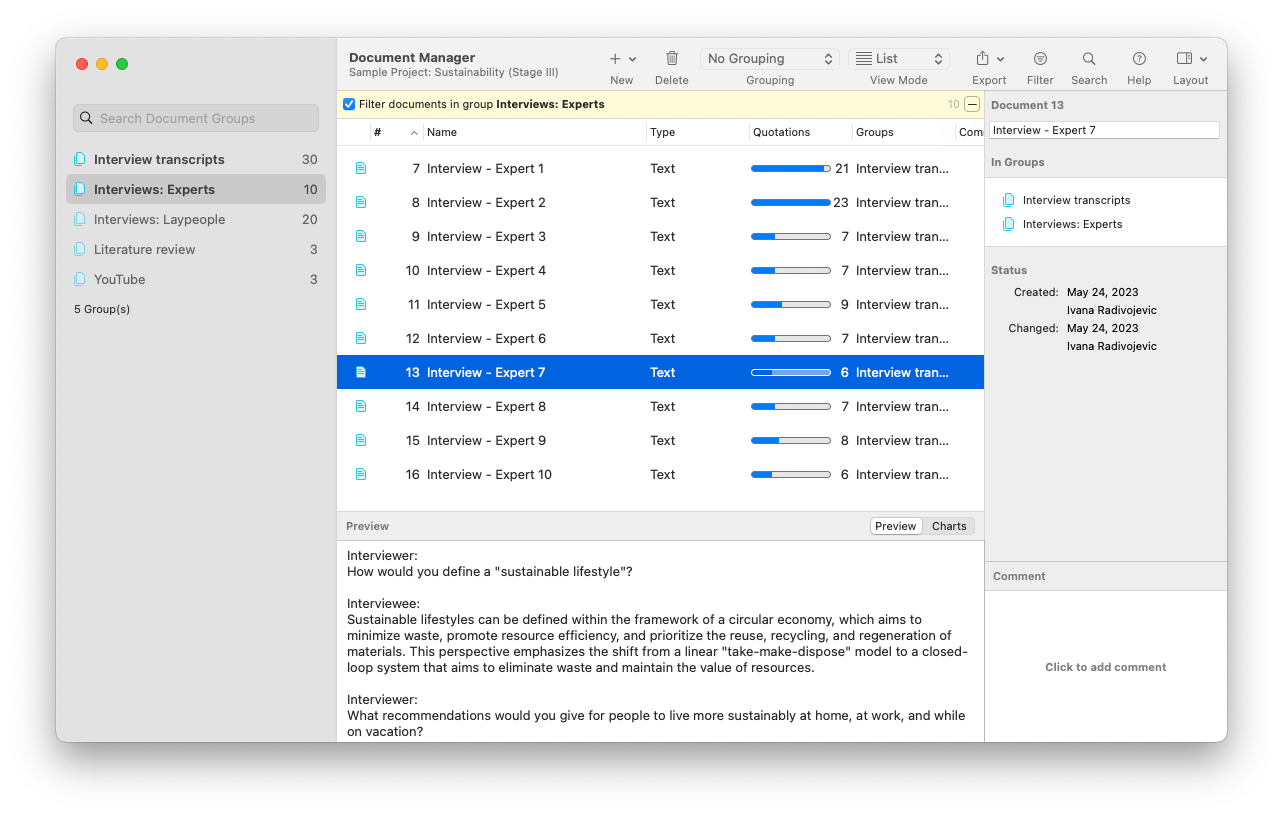
ATLAS.ti allows researchers to categorize and segment their data into coherent groups, which is invaluable for maintaining clarity throughout the research process. This organizational capability extends to a variety of data types, including text documents, multimedia files for images and videos, and even geographical data, ensuring that all data components can be systematically accessed and analyzed. The software's intuitive Document Manager enables users to sort documents into custom categories, enhancing the ease with which data can be retrieved and reviewed.
While NVivo also offers strong organizational tools, ATLAS.ti provides a more flexible system that adapts to the dynamic needs of qualitative researchers. For example, the ability to create groups that are not mutually exclusive allows for multi-dimensional analysis in ATLAS.ti. Researchers can create as many groups as they wish to organize their documents, codes, memos, and networks along any relevant dimensions. This gives researchers the freedom to explore their data from multiple perspectives without being constrained by a rigid organizational structure.
Real-Time Collaboration
ATLAS.ti Web allows team members to work together in real time. This platform enables researchers to access and code data simultaneously, share insights instantly, and maintain consistent communication throughout the research process. The real-time collaboration feature ensures that all changes and annotations are immediately visible to all team members, which eliminates the cumbersome task of managing multiple versions of the same project. Moreover, anyone with a license for ATLAS.ti Desktop also has full access to ATLAS.ti Web, permitting any ATLAS.ti user to enjoy real-time collaboration at no additional cost.
Desktop Cloud Storage
Both ATLAS.ti and NVivo have cloud storage options for collaborative projects. However, only ATLAS.ti automatically includes cloud storage with every license, while NVivo provides cloud capabilities as a separate, additional annual subscription. This means that ATLAS.ti users can harness their internal project cloud storage to facilitate teamwork as well as to easily save back-up copies of their projects that are easily accessible on any other computer.
Compared to NVivo, ATLAS.ti provides a more seamless integration of collaborative tools in both its desktop (Windows version and Mac version) and web platforms. This integration facilitates easier setup and access for teams, reducing the technical barriers that can sometimes hinder collaborative efforts in NVivo, which requires the purchase of add-on features and learning how to use a separate online workspace.
Supported Data Types
The diversity of data types that qualitative research software can handle directly impacts the scope and depth of analysis that researchers can achieve. ATLAS.ti provides exceptional support of a wide range of data types, which is crucial for researchers working with complex and varied datasets.
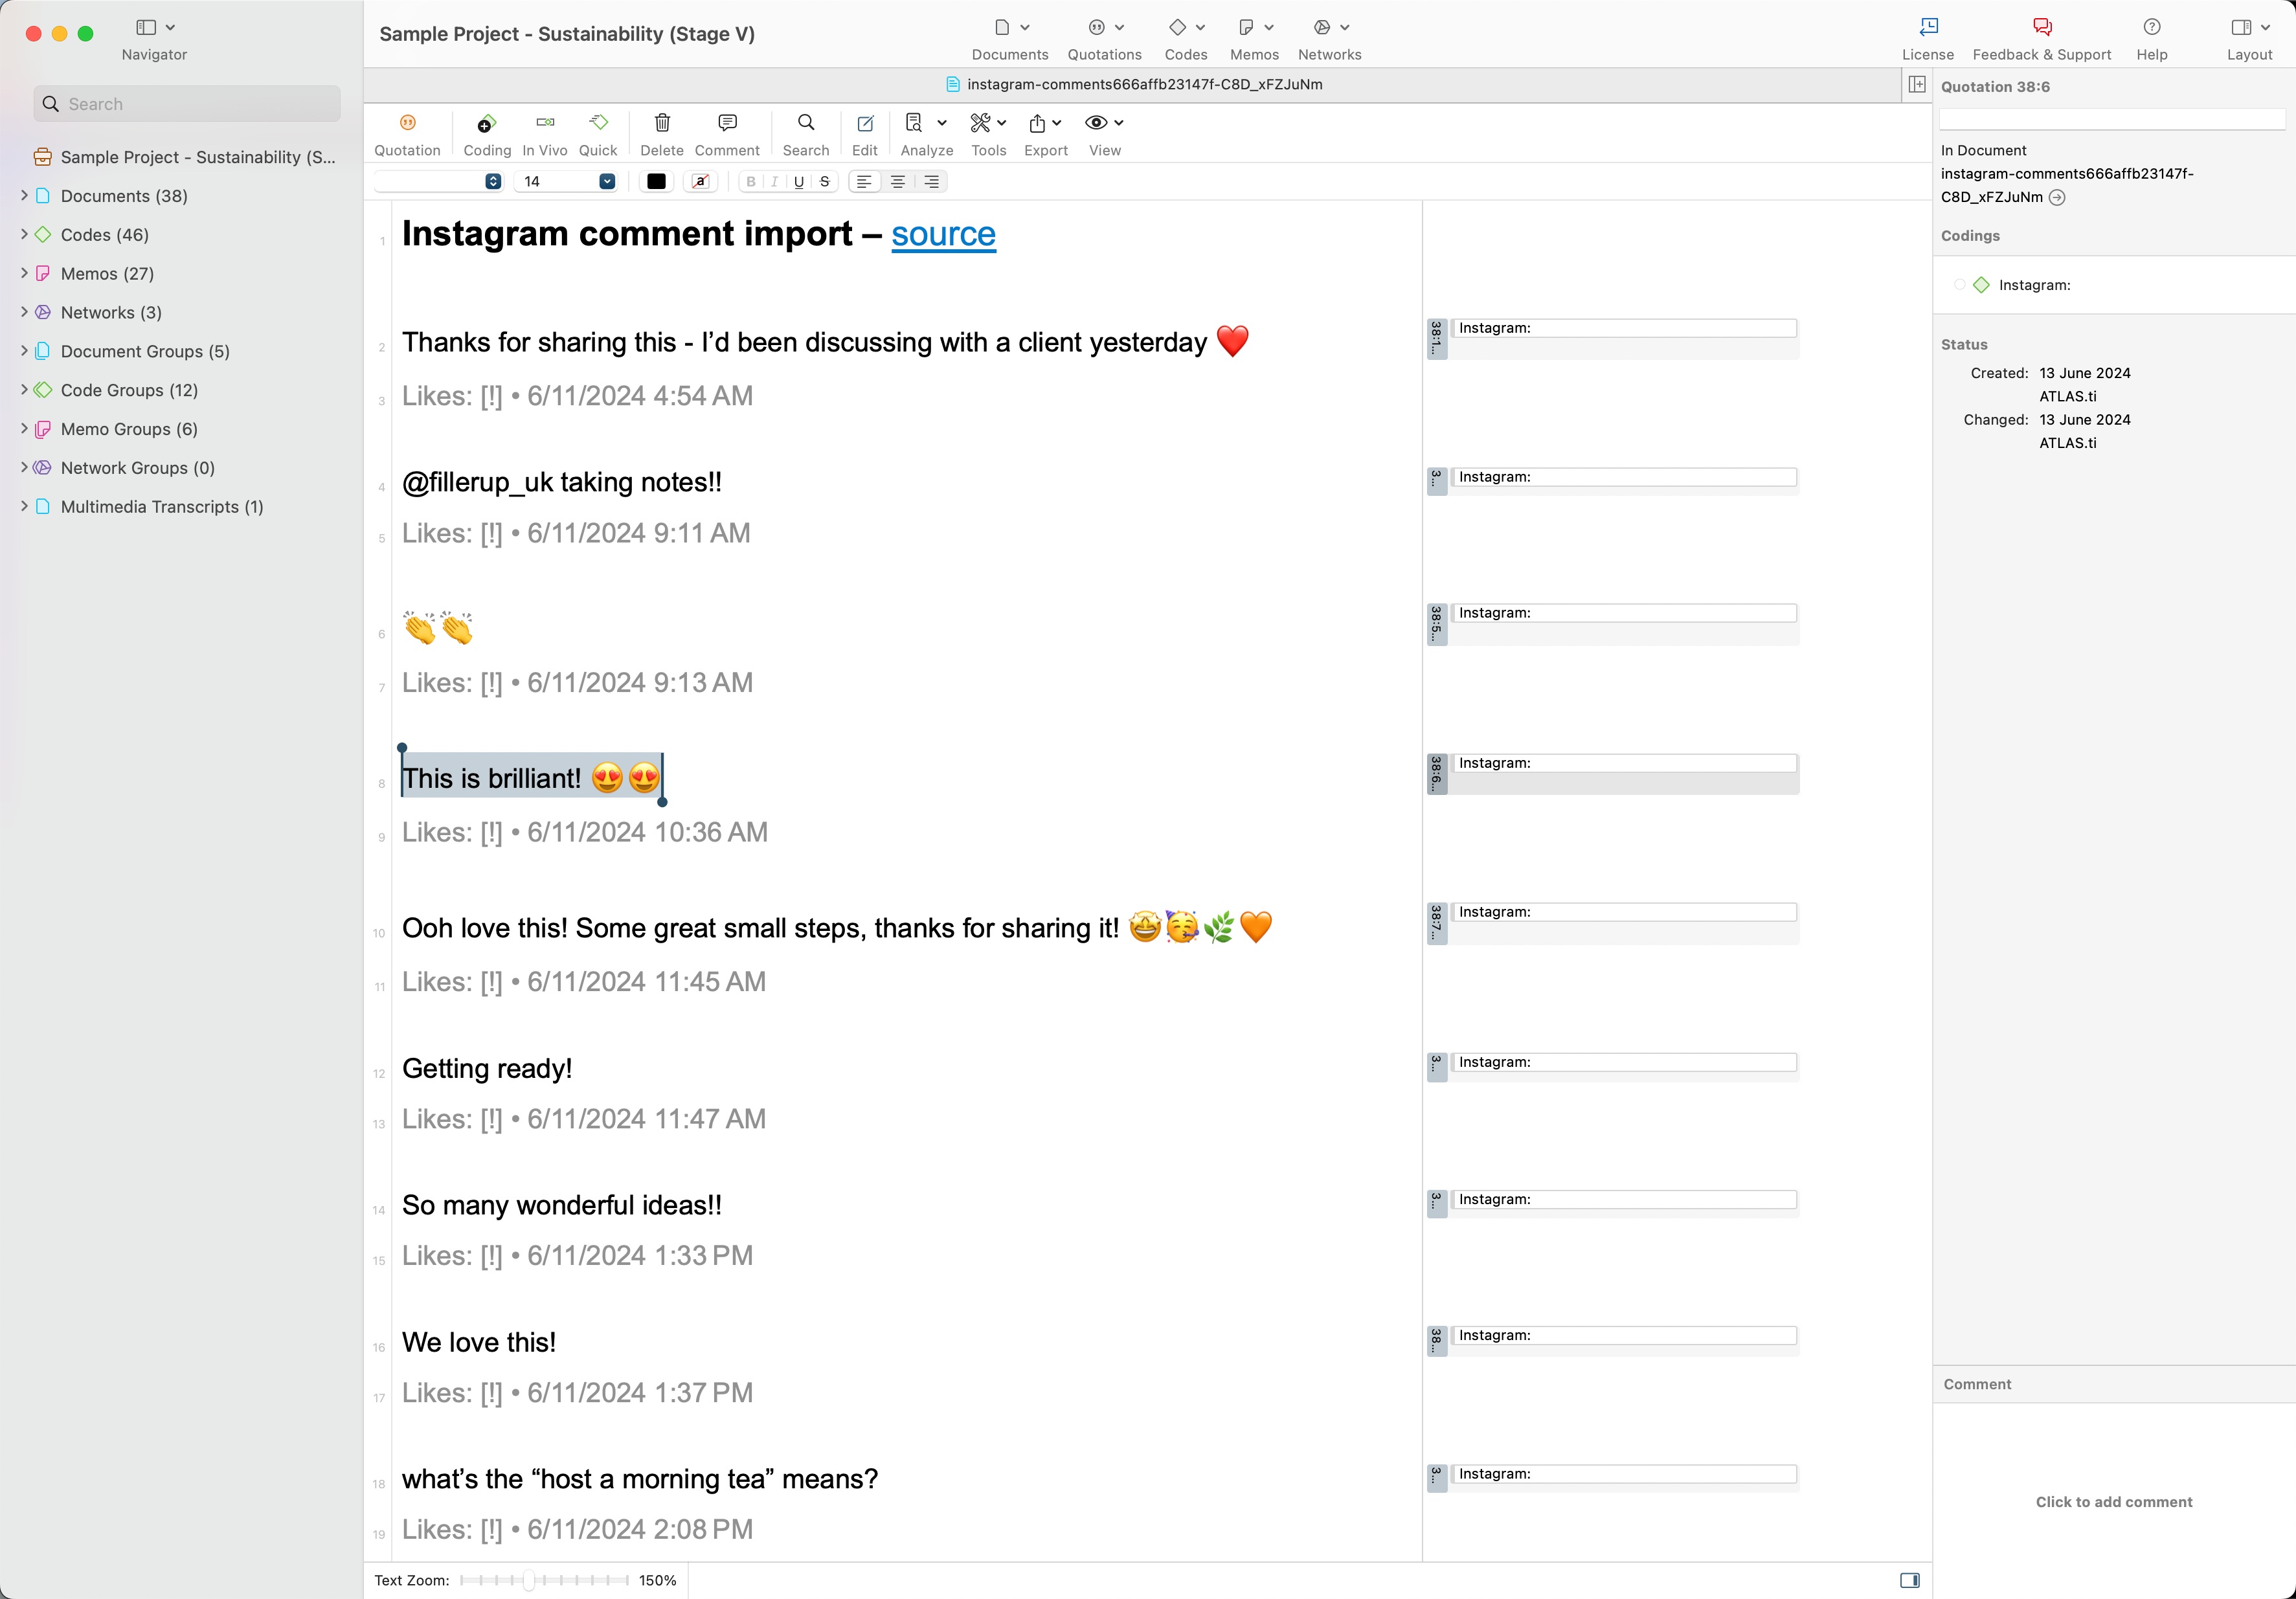
ATLAS.ti accommodates multiple data formats including plain text and Word documents, PDFs, multimedia files (audio and video data), eBooks, and geospatial data. Moreover, while ATLAS.ti and NVivo can handle social media data from Twitter, YouTube, and Facebook, only ATLAS.ti can also easily accommodate data from Instagram, TikTok, and other social media outlets compatible with exportcomments.com. This broad compatibility allows researchers to integrate and analyze data from different sources seamlessly, enhancing the richness of the analysis.
Notably, ATLAS.ti can handle large PDF files and preserve annotations and comments as quotations which can be critical for literature reviews and data extraction. In other words, researchers can import their PDFs without losing any of their highlights and notes, as these become automatically converted into quotations in ATLAS.ti, allowing researchers to pick up right where they left off.
While NVivo also supports various data types, it faces limitations with larger PDF files and offers less flexibility with non-standard data types. In contrast, ATLAS.ti provides more robust support. This ensures that researchers can work with their data in its original format without the need for time-consuming conversions, facilitating a more efficient and comprehensive analytical process.
Comprehensive Support System
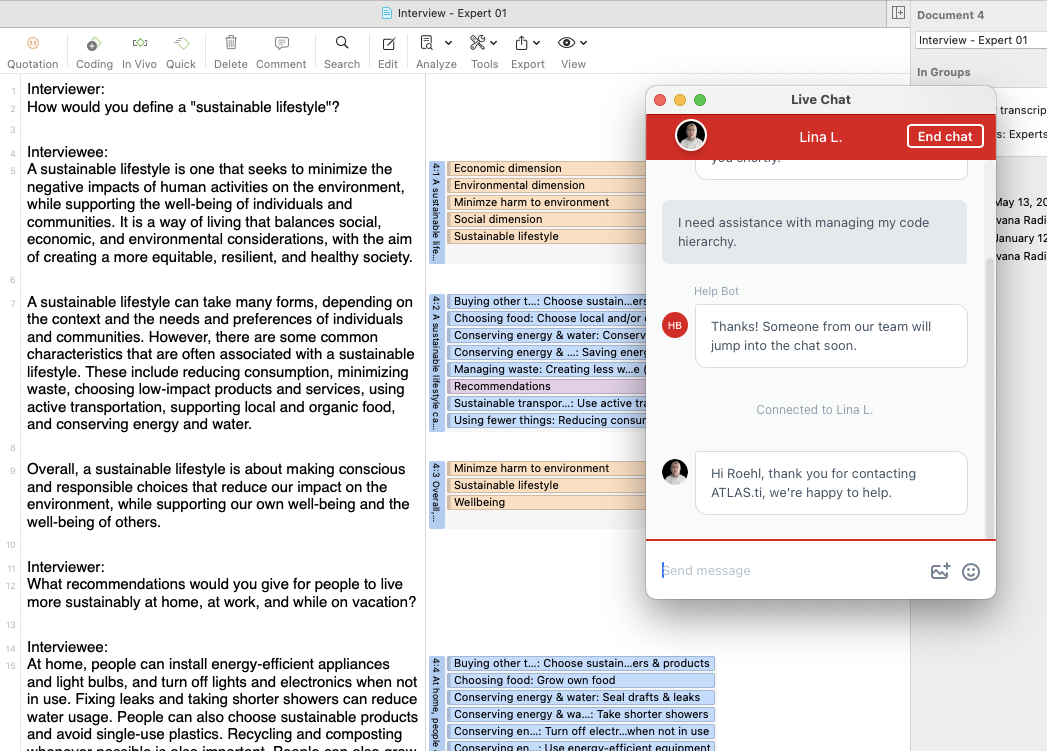
ATLAS.ti’s commitment to supporting researchers extends beyond the software itself. The ATLAS.ti website offers extensive training resources, including free video tutorials, webinars, sample projects, and user guides, all designed to enhance users' skills and confidence in handling qualitative data. Additionally, ATLAS.ti provides around-the-clock access to a support team ready to assist with both technical and methodological queries, ensuring researchers have the help they need whenever they need it. Any researcher can contact the ATLAS.ti team 24 hours a day, 5 days a week, via live chat, telephone, and email. Ultimately, ATLAS.ti's objective is to go the extra mile to support qualitative researchers at all levels of their career to ensure quality research in various fields, which requires holistic support for all issues great and small.
Putting It All Together
After examining the capabilities of ATLAS.ti and NVivo in depth, it becomes evident how the features of ATLAS.ti can significantly enhance the qualitative research process. The distinctions between these tools and other tools show why ATLAS.ti may be a more advantageous choice for researchers looking for efficiency, flexibility, and comprehensive support.
Intuitiveness and User-Friendliness
ATLAS.ti is designed to minimize the learning curve, offering a user-friendly interface that makes it easier to engage with complex qualitative data. The software’s intuitive navigation and streamlined data management reduce the time researchers spend on routine tasks, allowing more focus on in-depth analysis.
This ease of use is enhanced by features like drag-and-drop coding and seamless transitions between different data types, making qualitative research more accessible and less daunting.
Flexibility in Data Handling
The ability to support a wide array of data types, from text and multimedia to geospatial data, makes ATLAS.ti particularly versatile for various research settings. Whether in academia, market research, or field studies, ATLAS.ti accommodates the diverse needs of researchers.
This flexibility ensures that no matter the data format, researchers can integrate and analyze their data without the need for cumbersome conversions or additional software.
Enhanced Collaboration
The real-time collaborative capabilities of ATLAS.ti Web and the cloud storage feature in ATLAS.ti's desktop versions are especially useful in projects that involve multiple researchers or teams. ATLAS.ti supports seamless cooperation among researchers from any institution or geographic location, such that anyone with any type of ATLAS.ti license can collaborate with other researchers.
ATLAS.ti Web ensures that all team members can work simultaneously on the same project and see updates in real time. This feature is crucial for maintaining coherence and consistency in collaborative research efforts. For ATLAS.ti Windows and Mac users, projects can also be shared asynchronously through the internal project cloud storage, which is available to all ATLAS.ti users at no additional charge. In contrast, NVivo imposes extra charges to researchers who wish use to its asynchronous project sharing features.
Licensing and Accessibility
With transparent licensing options and no hidden fees, ATLAS.ti makes it easy for individuals and organizations to access its full capabilities without additional financial burdens.
The software is available on multiple platforms, including desktop, online, and free mobile versions. ATLAS.ti was natively designed from the ground up within each unique operating system, ensuring optimal functionality. In addition, researchers can move their projects across ATLAS.ti Desktop, Web, and Mobile, with 100% back-and-forth compatibility between ATLAS.ti Windows and Mac. This means researchers can work flexibly from the office, at home, or in the field, and teams can work together even if they use a mix of Windows and Mac computers. This accessibility supports a dynamic research environment and caters to the modern researcher’s mobility needs.


