
|
Delve
|
ATLAS.ti
|
|
|---|---|---|
| AI-powered Data Analysis | ||
| Intentional AI Coding | ||
| AI Summaries | ||
| AI Suggested Codes | ||
| Conversational AI with data | ||
| Paper Search capabilities | ||
| Free access to 200M+ papers | ||
| Streamlined literature search | ||
| Advanced filters for relevant papers | ||
| Auto-Coding Tools | ||
| Coding speakers in transcripts | ||
| Sentiment Analysis | ||
| Concepts Tool | ||
| Opinion Mining | ||
| Named Entity Recognition | ||
| Text Search | Limited features | Full flexibility to customize searches |
| Visualizations | ||
| Treemaps | ||
| Networks | ||
| Code clouds | ||
| Force-directed graphs | ||
| Sankey diagrams | ||
| Compatible Social Media Data | ||
| Twitter/X | ||
| YouTube | ||
| TikTok | ||
| Compatible Text Files | ||
| Microsoft Word | ||
| Plain text | ||
| Rich text files | ||
| PDF files | ||
| Open Office | ||
| HTML files | ||
| Office Open XML | ||
| Other Compatible Files | ||
| Images | ||
| Video files | ||
| Audio files | ||
| Geographical data | ||
| MOBI eBook files | ||
| Support | ||
| Technical support | ||
| Methodological guidance | ||
| Project optimization | ||
| 24/5 support via telephone, email, and live chat | ||
| Miscellaneous | ||
| Real-time, online collaboration | ||
| Memos | Limited linking to project entities | Full flexibility to link memos to all project entities |
| Coded data retrieval | Limited retrieval options | Results dynamically change as data query options are selected |
| Intercoder agreement analysis | Calculation of Krippendorff's alpha only; no line chart for visual comparison | Multiple agreement measures and visualizations |
| AI-powered Data Analysis |
|
Intentional AI Coding
|
|
AI Summaries
|
|
AI Suggested Codes
|
|
Conversational AI with data
|
| Paper Search capabilities |
|
Free access to 200M+ papers
|
|
Streamlined literature search
|
|
Advanced filters for relevant papers
|
| Auto-Coding Tools |
|
Coding speakers in transcripts
|
|
Sentiment Analysis
|
|
Concepts Tool
|
|
Opinion Mining
|
|
Named Entity Recognition
|
|
Text Search
Limited features |
| Visualizations |
|
Treemaps
|
|
Networks
|
|
Code clouds
|
|
Force-directed graphs
|
|
Sankey diagrams
|
| Compatible Social Media Data |
|
Twitter/X
|
|
Facebook
|
|
YouTube
|
|
Instagram
|
|
TikTok
|
| Compatible Text Files |
|
Microsoft Word
|
|
Plain text
|
|
Rich text files
|
|
PDF files
|
|
Open Office
|
|
HTML files
|
|
Office Open XML
|
| Other Compatible Files |
|
Images
|
|
Video files
|
|
Audio files
|
|
Geographical data
|
|
MOBI eBook files
|
| Support |
|
Technical support
|
|
Methodological guidance
|
|
Project optimization
|
|
24/5 support via telephone, email, and live chat
|
| Miscellaneous |
|
Real-time, online collaboration
|
|
Memos
Limited linking to project entities |
|
Coded data retrieval
Limited retrieval options |
|
Intercoder agreement analysis
Calculation of Krippendorff's alpha only; no line chart for visual comparison |
| AI-powered Data Analysis |
|
Intentional AI Coding
|
|
AI Summaries
|
|
AI Suggested Codes
|
|
Conversational AI with data
|
| Paper Search capabilities |
|
Free access to 200M+ papers
|
|
Streamlined literature search
|
|
Advanced filters for relevant papers
|
| Auto-Coding Tools |
|
Coding speakers in transcripts
|
|
Sentiment Analysis
|
|
Concepts Tool
|
|
Opinion Mining
|
|
Named Entity Recognition
|
|
Text Search
Full flexibility to customize searches |
| Visualizations |
|
Treemaps
|
|
Networks
|
|
Code clouds
|
|
Force-directed graphs
|
|
Sankey diagrams
|
| Compatible Social Media Data |
|
Twitter/X
|
|
Facebook
|
|
YouTube
|
|
Instagram
|
|
TikTok
|
| Compatible Text Files |
|
Microsoft Word
|
|
Plain text
|
|
Rich text files
|
|
PDF files
|
|
Open Office
|
|
HTML files
|
|
Office Open XML
|
| Other Compatible Files |
|
Images
|
|
Video files
|
|
Audio files
|
|
Geographical data
|
|
MOBI eBook files
|
| Support |
|
Technical support
|
|
Methodological guidance
|
|
Project optimization
|
|
24/5 support via telephone, email, and live chat
|
| Miscellaneous |
|
Real-time, online collaboration
|
|
Memos
Full flexibility to link memos to all project entities |
|
Coded data retrieval
Results dynamically change as data query options are selected |
|
Intercoder agreement analysis
Multiple agreement measures and visualizations |
What makes the best QDA platform?
When it comes to qualitative analysis, there are many options to choose from, including desktop and web-based platforms. There are various aspects that can be used to assess any QDA software solution, so let's examine some of the more important dimensions.
Delve and ATLAS.ti - Key Differences
What makes ATLAS.ti the preferred choice for qualitative researchers over Delve? Here are the many different aspects in which ATLAS.ti can give you a distinct advantage in your research.
- Interface
- Literature Review Tools
- Compatible File Types
- Multiple Forms of Data
- Code Organization
- Project Dataset Search
- Auto-Coding Features
- Artificial Intelligence Capabilities
- Analysis Tools
- Data Visualizations
- Memos and Comments
- Collaboration
- Affordable Data Analysis
- Putting It All Together
Interface
Qualitative data analysis is only as good as the researcher's ability to conduct it. The easier it is to code and analyze qualitative data, the more powerful the findings. That's why both the desktop and web versions of ATLAS.ti have clear advantages over Delve with an interface that is both user-friendly and powerful.
ATLAS.ti Web has the edge when it comes to an intuitive interface where you can edit documents instantly and easily just like you would in a standard word processor. With ATLAS.ti, the rich text formatting of documents is preserved where documents in Delve would be converted to simple plain text, potentially leaving out important visual features that contextualize the data.
The desktop version of ATLAS.ti provides simplicity and flexibility with a tabbed interface to simultaneously view multiple documents and tools to display multiple analyses at the same time. In both the desktop and web versions, you can also take advantage of hotkeys to quickly navigate between parts of your project to easily draw connections between codes, documents, and other aspects of your research. This ensures that you can see the bigger picture behind your qualitative data to capture critical insights to persuade your research audience.
Literature Review Tools
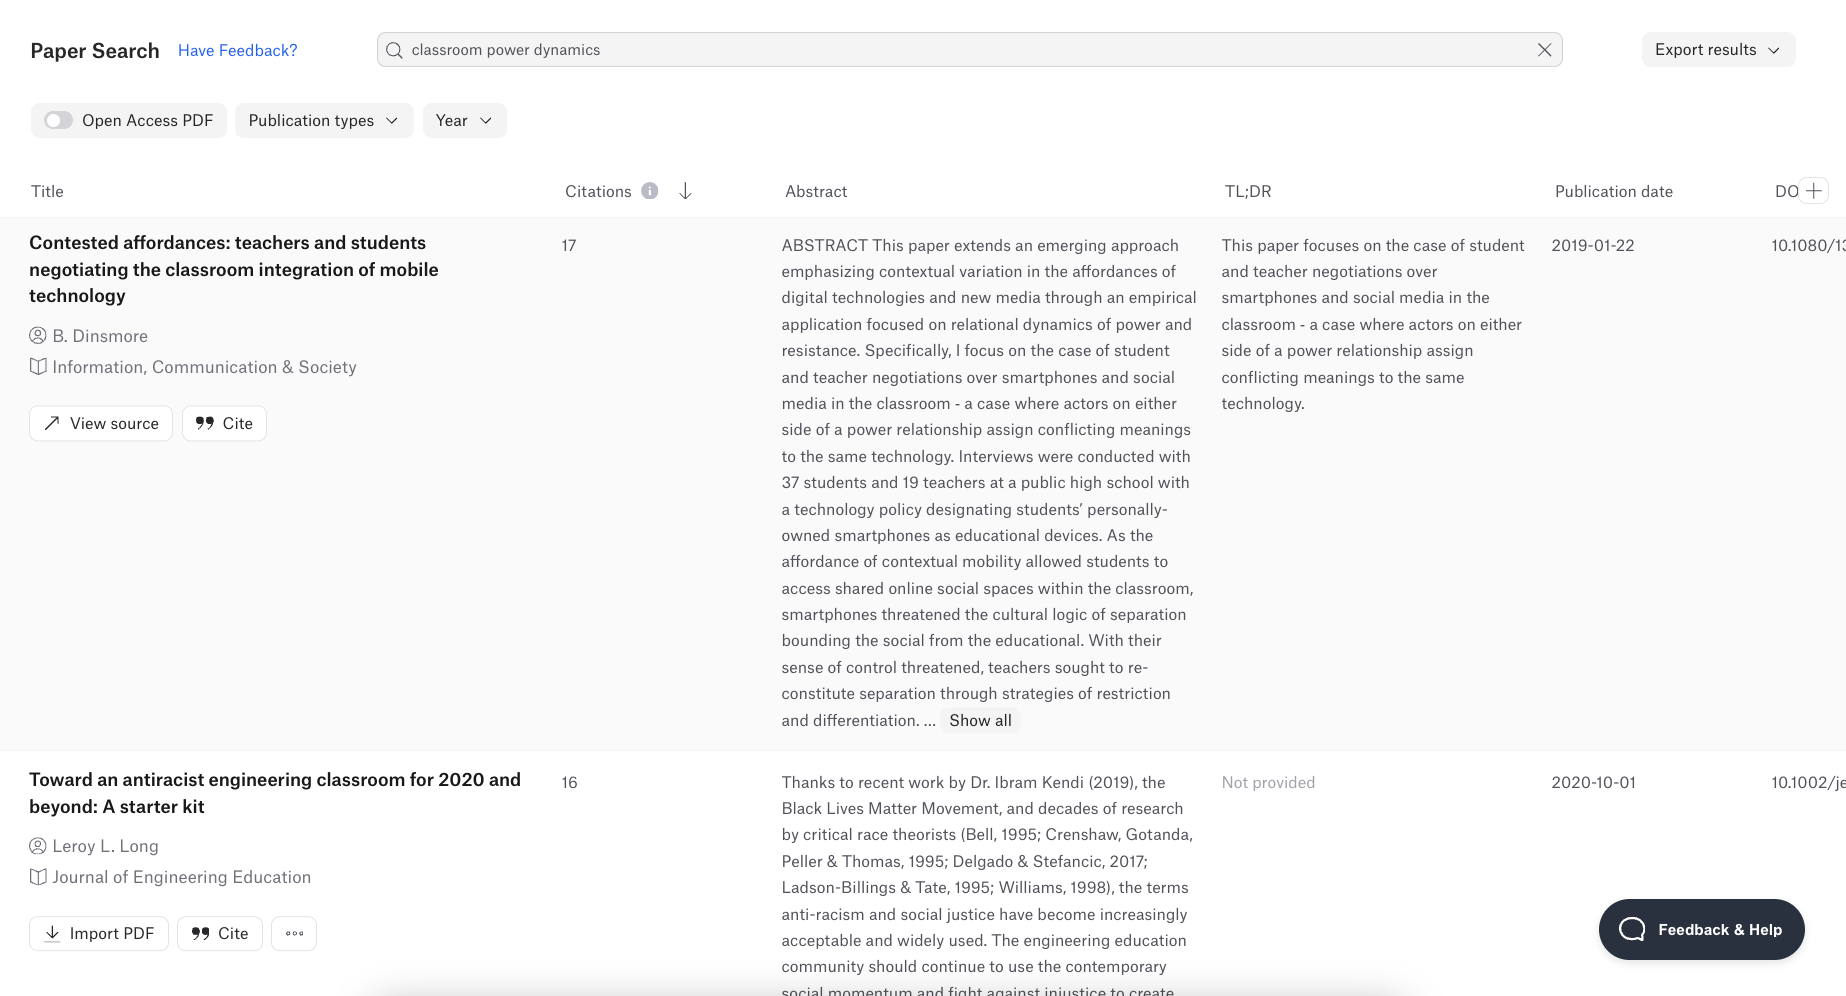
Researchers require tools that go beyond the coding of qualitative data. From start to finish, ATLAS.ti has features that support every step of the research process from conception to actionable insights. In particular, ATLAS.ti Web's Paper Search gives researchers a starting point to build their research agenda with a searchable database of over 200 million papers thanks to Semantic Scholar.
Utilizing artificial intelligence, you can simply type in your research question and Paper Search will find the most relevant published research and summarize the main insights to guide your research design. No other major QDA platform provides this capability, making ATLAS.ti the preferred solution for comprehensive qualitative research and literature reviews.
You can even supplement an ATLAS.ti Web project with your own collected literature, whether in plain text or in PDF form. This is another key distinction over Delve, which converts PDF files to plain text, where the context of important information can be lost. ATLAS.ti, on the other hand, has a native PDF viewer to preserve formatting, images, and other important visual elements that warrant analysis.
Compatible File Types
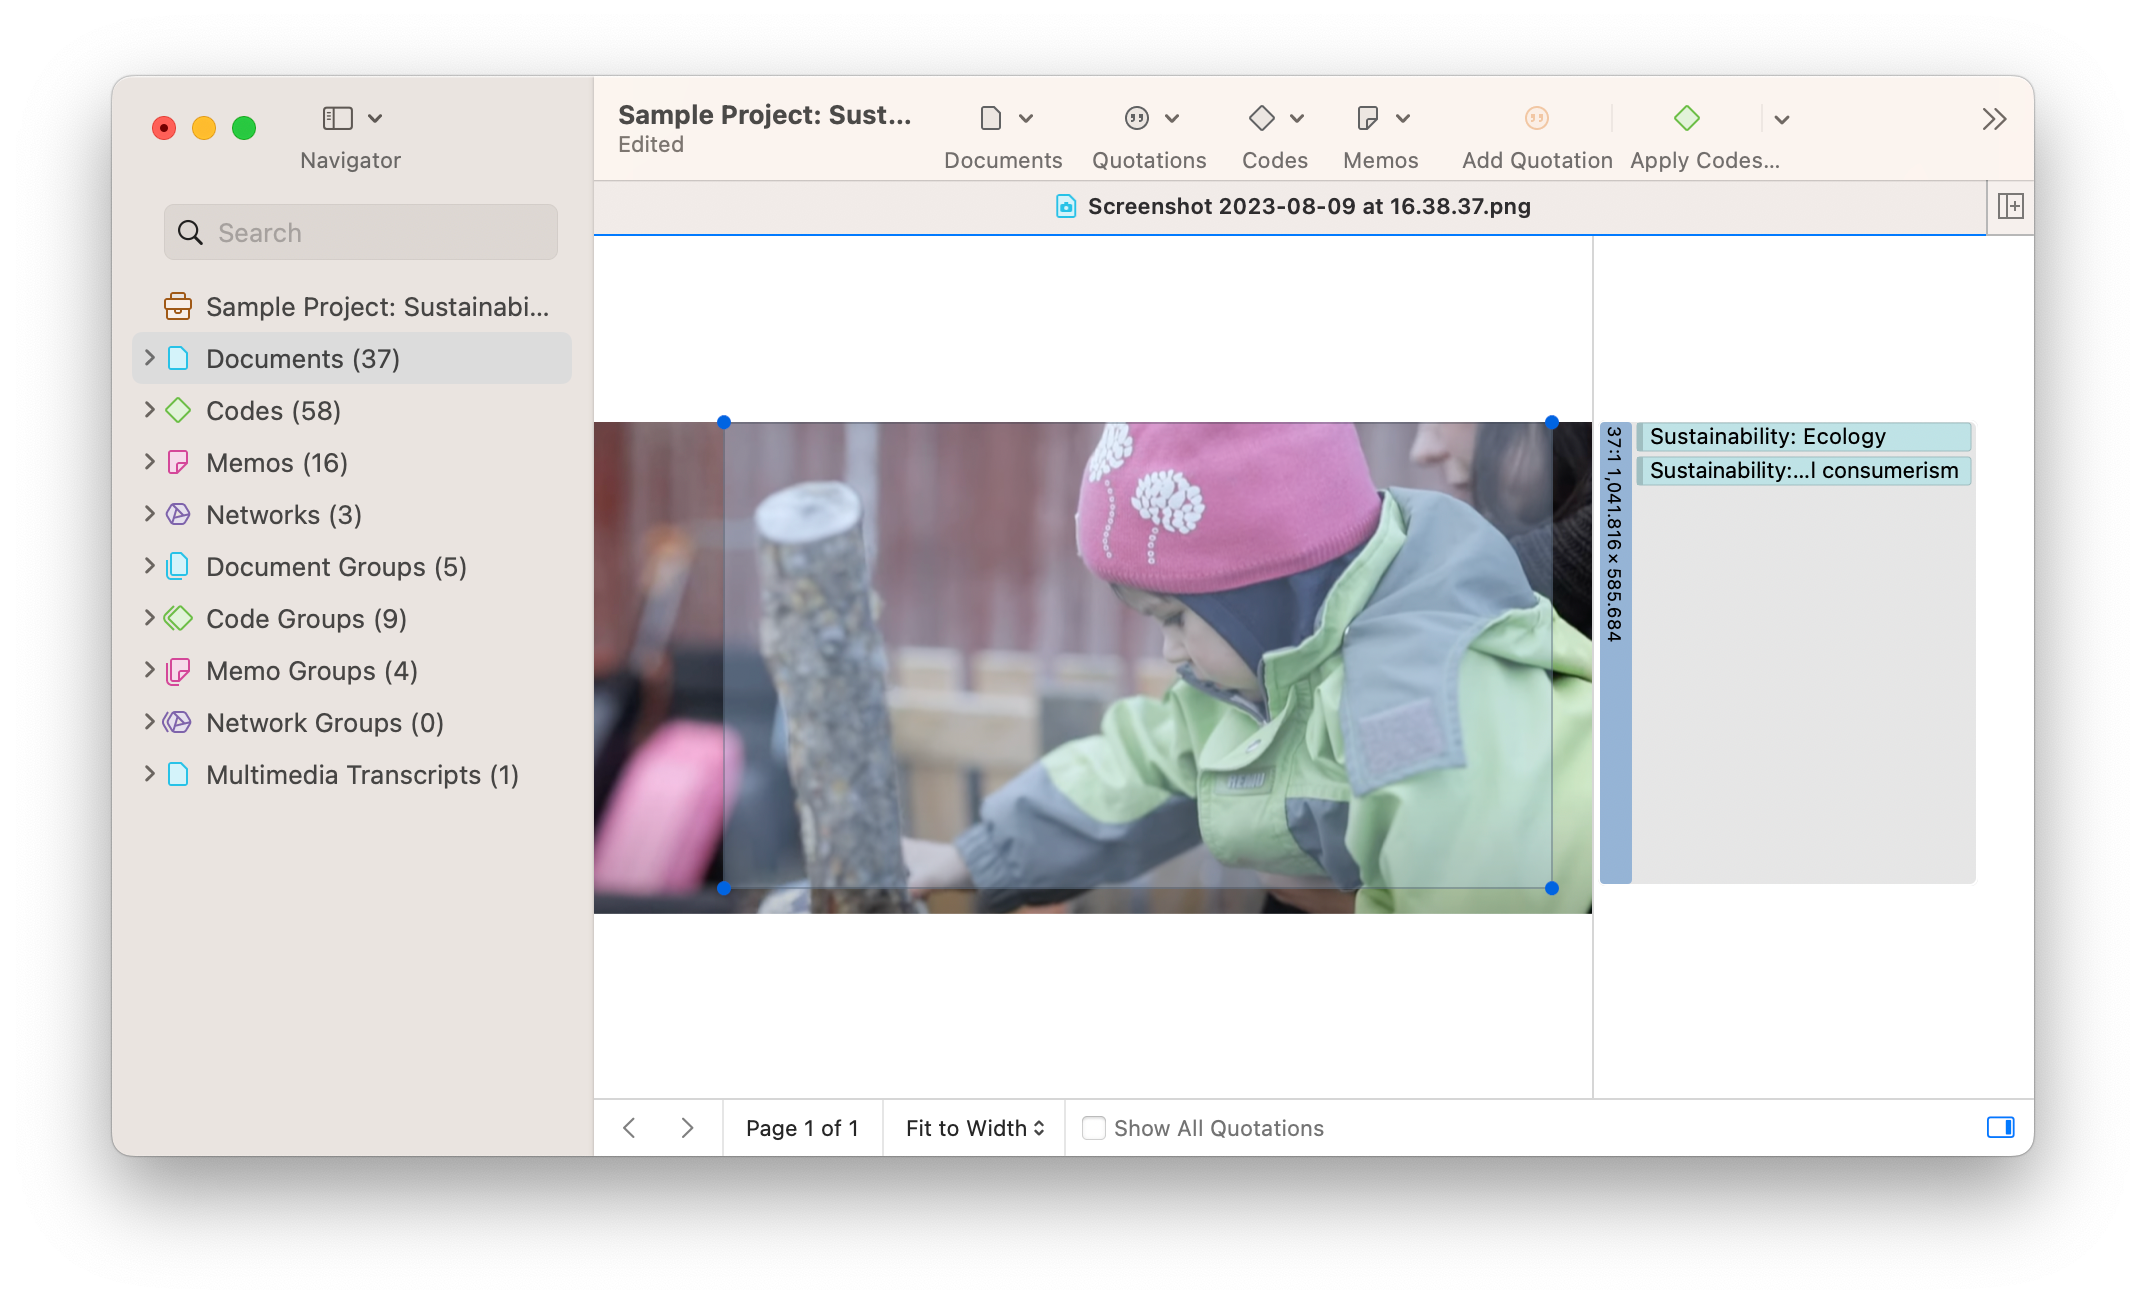
Qualitative data takes on many forms as researchers pursue countless approaches to data analysis. A good QDA platform should focus not only on plain text but on all the forms of data that can provide meaning and insight.
Delve's exclusive focus on transcript data can hamper your research when you want to code and analyze data for more complex studies involving ethnographic research or mixed methods research. Qualitative data analysis often relies on research data other than text data, such as images, videos, audio files, and geographic data. As a result, ATLAS.ti accommodates a wider array of files to facilitate a greater variety of research methods and analytical approaches.
Multiple Forms of Data
A good QDA platform should not only read various types of data but be able to convert them into a usable form that facilitates data analysis. This is where ATLAS.ti has a distinct advantage in accommodating data from surveys, reference managers, and even social media.
Both platforms accommodate survey data, but only ATLAS.ti's desktop version auto-codes survey data and organizes survey responses in useful documents and document groups to provide the greatest flexibility in data handling and retrieval. Just a few clicks can organize hundreds or even thousands of survey records ready to be coded and analyzed.
Unlike with Delve, ATLAS.ti users also enjoy the capability to import social media data and reference manager data directly into their projects. ATLAS.ti Mac and Windows guide users through the process of importing social media comments from platforms like Twitter/X, Instagram, YouTube, and others into data that can be searched and coded, while users can directly incorporate records of literature from their favorite reference manager software into their project to build their literature review.
Code Organization
Coding is the backbone for studies that analyze qualitative data. Coding in any QDA platform should be simple and easy, as is the case with both ATLAS.ti and Delve. In both platforms, applying codes is a matter of selecting meaningful data and choosing or creating the appropriate labels to mark the data. No learning curve should be required to code data, and both ATLAS.ti and Delve allow you to add data to your project and start coding right away.
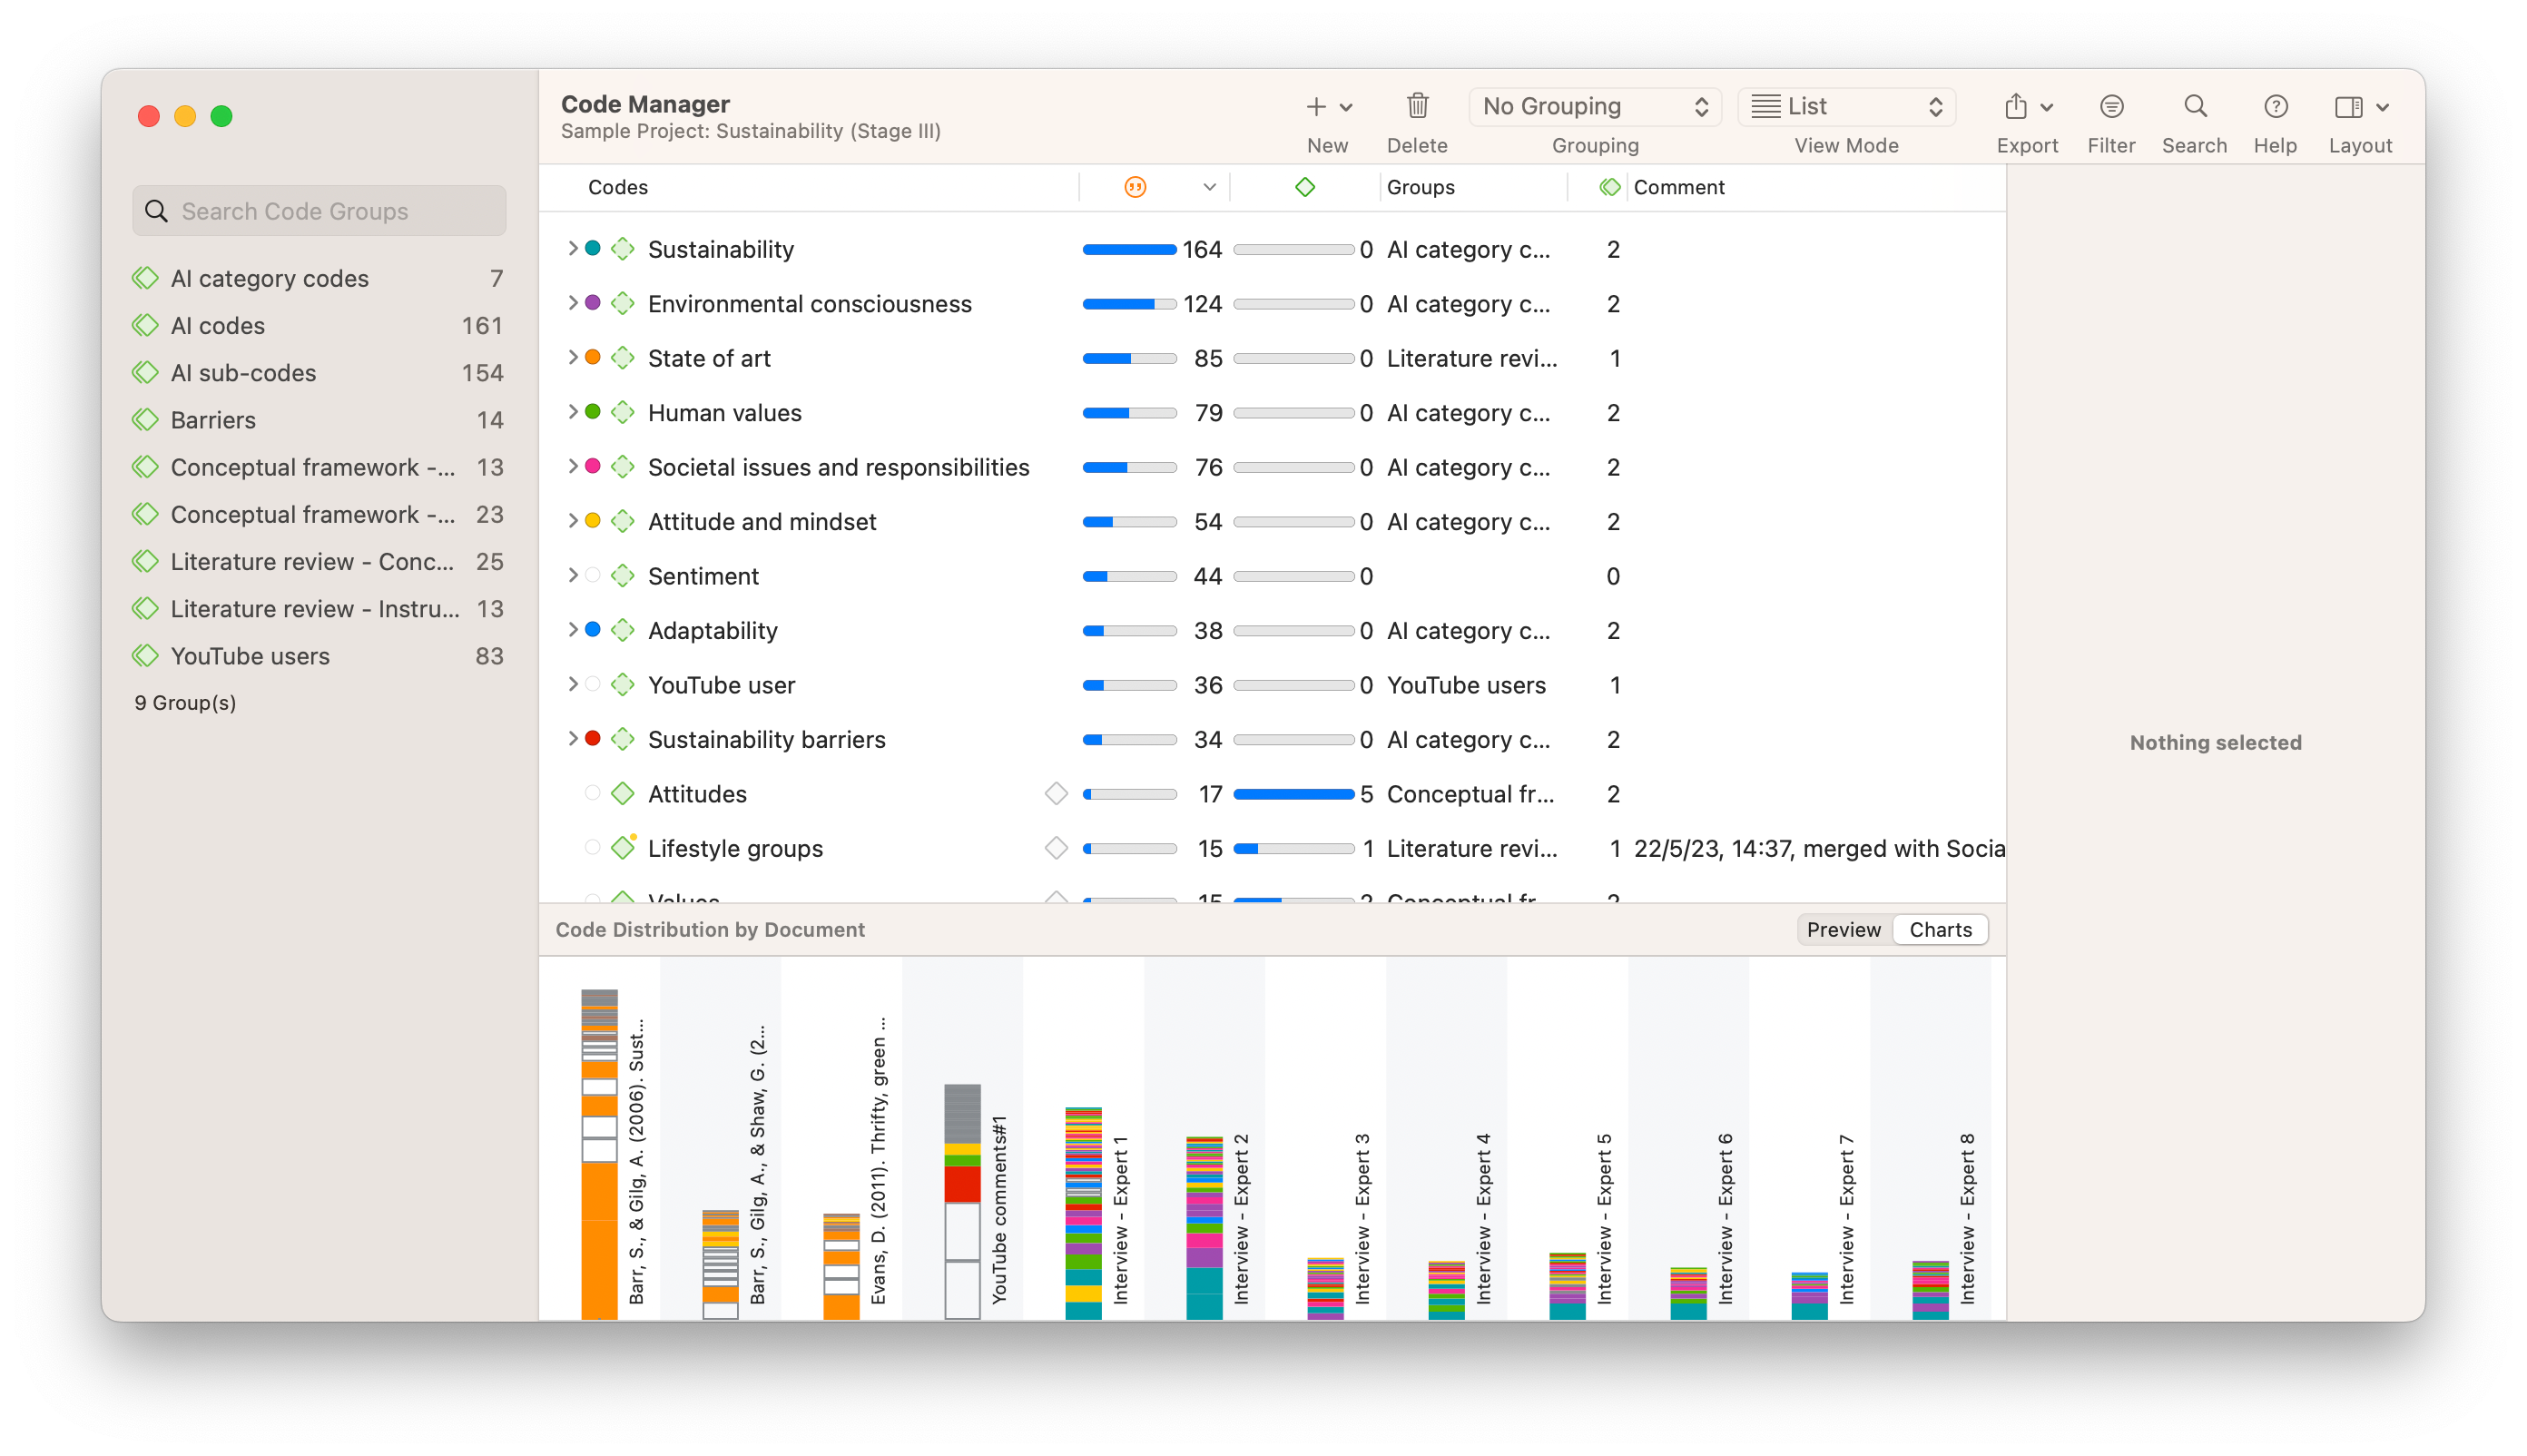
But what happens with larger or more complex projects? Even the most basic research can involve dozens of codes that require some organization before any meaningful analysis. When you want to identify patterns from a coded research project, ATLAS.ti has more features that facilitate the organization of your code hierarchy so insights are accessible to you and your research audience. Code groups, code colors, and smart codes are available only in ATLAS.ti to organize the coding system of any qualitative project to ensure a rich, comprehensive, and accessible structure to support qualitative data analysis.
The Code Manager in ATLAS.ti provides the capability and flexibility to organize a project's codes. While Delve has limited capabilities for adding, organizing, and sorting codes, ATLAS.ti's intuitive Code Manager makes building and developing a code hierarchy for inductive and deductive research approaches easy. Moreover, ATLAS.ti users can freely import and export their project codes for use in other programs, providing flexibility not found in Delve.
Project Dataset Search
Sifting through your dataset requires more than a simple search string with a key word or phrase. Even researchers with a project dataset of a couple dozen pages can benefit from powerful text analysis tools that narrow the scope of your data to facilitate coding.
Compared to Delve, ATLAS.ti has various tools dedicated to helping you sort through your data set. Artificial intelligence integrated into Text Search can identify segments of text based on search terms, relevant synonyms, and inflected forms of words, while Regular Expression Search allows you to customize complex searches to find specific text segments most relevant to your research inquiry. Other tools such as Word Frequencies and Concepts can also give you a sense of what words and phrases are most prevalent in your textual data, which you can further filter by parts of speech or sub-concepts for the most detailed text analyses.
Auto-Coding Features
Qualitative coders can always use a little help when it comes to coding the data. When you're working with multiple documents and countless pages of text, ATLAS.ti is the more convenient solution to auto-code data.
Where Delve has limited artificial intelligence capabilities to apply codes to data, ATLAS.ti has a variety of auto-coding features such as Focus Group Coding, Sentiment Analysis, Opinion Mining, Concept search, Named Entity Recognition, and more. These tools are powered by machine learning algorithms that recognize patterns and important keywords and apply codes accordingly, saving time and effort that can be dedicated to the richer tasks of qualitative data analysis.
Artificial intelligence capabilities
Generative AI has paved the way for significant advances in qualitative data analysis software. As a pioneer in developing AI-driven tools for qualitative research, ATLAS.ti values the utility of AI to make the research process easier for researchers of all backgrounds and methodological approaches. This is why ATLAS.ti's desktop platform and web version both incorporate the latest technological developments that provide virtual assistants capable of coding your data, providing the necessary inspiration for you to draw critical insights from your research.
ATLAS.ti's Intentional AI Coding provides the most powerful automated inductive coding tool of any major QDA software package. In contrast to Delve's limited AI coding capabilities, ATLAS.ti's Intentional AI Coding allows users to direct the AI to code their data based on specific research questions. Moreover, the AI-generated codes are automatically organized into a code hierarchy complete with code categories and subcodes to inductively represent the data.
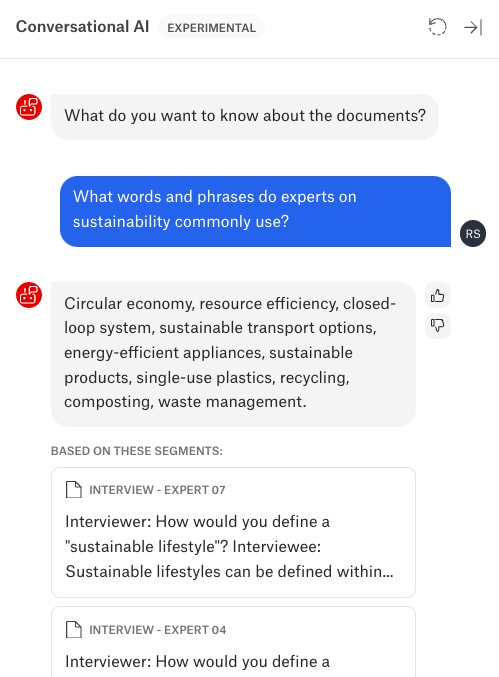
Conversational AI in ATLAS.ti Web is a powerful chatbot that examines your data and answers any questions you pose by pointing to relevant text segments, so you can easily verify any AI results and code your data. Delve's equivalent to Conversational AI is limited to generating answers based on selected segments of data while ATLAS.ti lets you analyze entire documents in the same project all with a few simple clicks.
Other AI-powered tools such as AI Summaries and Suggested Codes provide researchers with the greatest amount of flexibility in AI capabilities. With ATLAS.ti, you can choose to code a little bit of your data or code your entire project. AI can instantly generate a summary of your data, or you can ask specific questions to get insightful answers. You always remain in full control of how your data is analyzed, and you can choose among a broad range of AI-powered tools to meet your needs and preferences.
Analysis Tools
Qualitative data analysis oftentimes necessitates reorganizing or viewing data from different angles so you can develop deep insights. This means that QDA software should have the tools to easily reorganize and visualize data in various ways. Moreover, a good QDA platform lets you conduct as much of your analysis as possible in one place.
ATLAS.ti's sophisticated data retrieval tools ensure users can get to the most relevant data quickly and easily. The Query Tool lets you work with combinations of codes, documents, and groups to narrow down text segments to the data that can answer your research questions. Delve offers a similar tool that retrieves data that match code-based criteria, but ATLAS.ti allows users to set multiple conditions based on inclusion, exclusion, sequence, and overlap to suit all possible queries.
Users in both Delve and ATLAS.ti can query their coded data for co-occurrences, an essential component for understanding patterns in qualitative data. However, ATLAS.ti offers an interactive Query Tool that allows you to see the qualitative data corresponding to any parts of your project. What's more, you can also use ATLAS.ti's Code Co-Occurrence Analysis and Code-Document Analysis tools to conduct qualitative and quantitative analyses, and then view and export tables, Sankey diagrams, force-directed graphs, and bar charts to visualize your data.
Data Visualizations
Visualization of qualitative data is a critical component of the research process, especially if the goal is to persuade research audiences and stakeholders with the insights generated from data analysis. With this in mind, ATLAS.ti users can visualize their data analysis in ways that are not available in Delve.
In Delve, visualizations of code co-occurrence and code-document relationships are only available through export to Microsoft Excel. On the other hand, ATLAS.ti users can create illustrative figures such as Sankey diagrams, force-directed graphs, and column charts directly within the platform, making the development of visualizations for papers and presentations quick and easy.
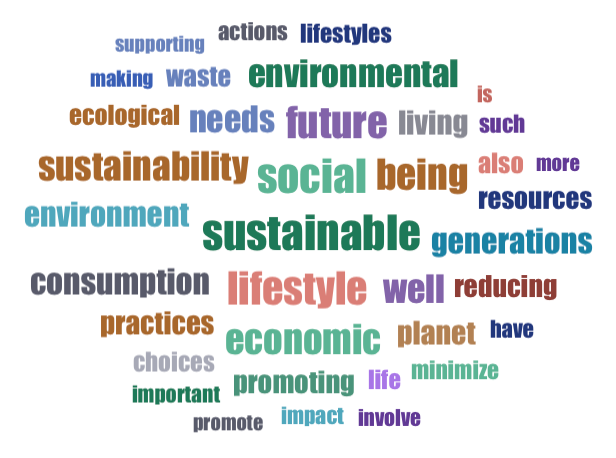
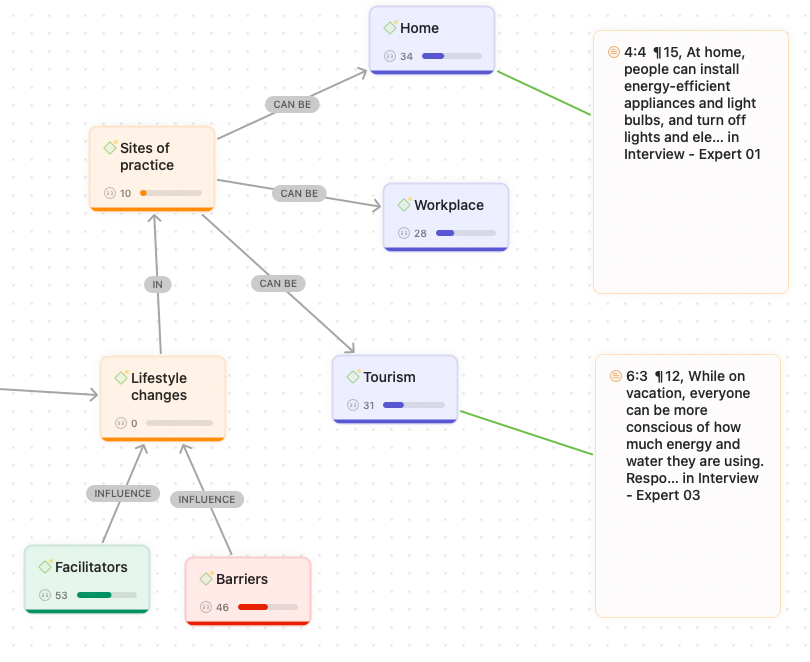
Other figures such as word clouds and Treemaps are readily producible to represent codes, documents, and other elements of your project, while the Network view can help you produce flowcharts and other diagrams of your developing theory and supporting evidence. While both Delve and ATLAS.ti facilitate the data analysis process, only ATLAS.ti offers the resources to illustrate the analysis to help you understand your data and convince your audience of the novelty of your research.
Memos and Comments
Qualitative research depends on research memos to document any critical insights or theoretical developments as they are crafted during the course of a study. The importance of a written record attached to any aspect of a research project cannot be overestimated, which is why ATLAS.ti provides space in projects for memos that can serve as standalone reflections or can be linked to various elements in your project. Images and quotations can be added to memos so that users can develop insightful reflections for later research dissemination.
In addition, comments can be added to any project element in ATLAS.ti, not just codes and data segments like in Delve, to provide an easy reference for you and your research team. This level of flexibility ensures that research data can be fully annotated and insights fully analyzed to make the most of your study.
Collaboration
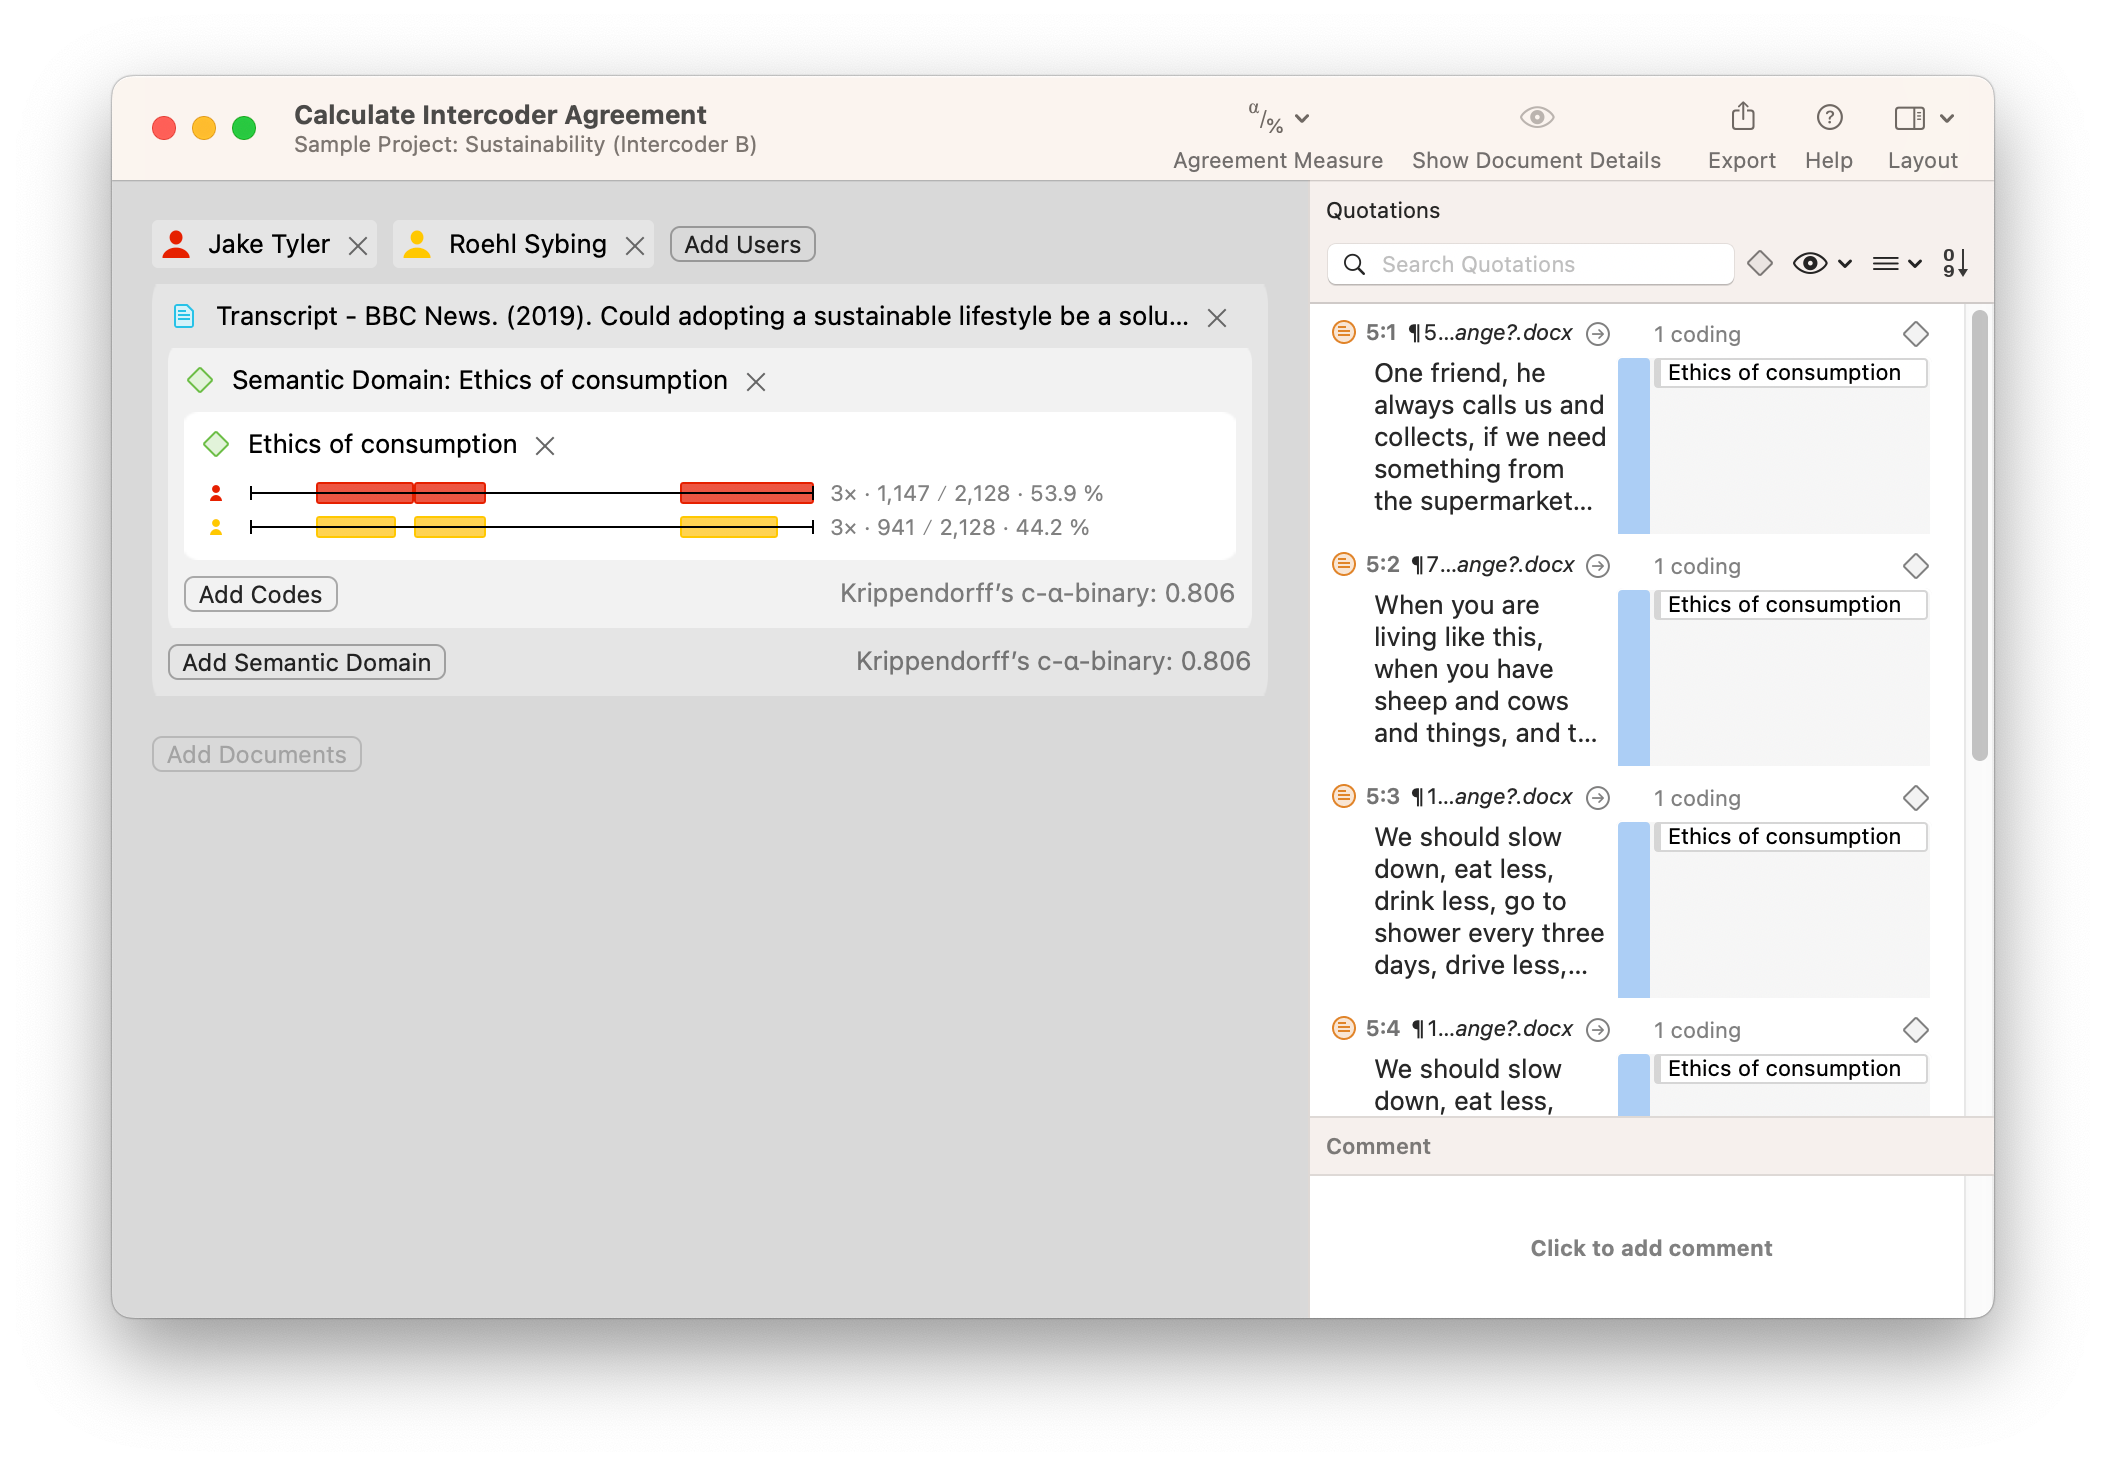
When coding qualitative data with fellow researchers, both ATLAS.ti and Delve provide a web-based tool to facilitate collaborative research among multiple users. Just like with Delve, the real-time collaboration in ATLAS.ti Web can address any administrative issues of teamwork and promote consensus building within a team of researchers. However, ATLAS.ti Mac and Windows also allow you to collaborate with your research team to code data asynchronously and calculate intercoder agreement with various agreement measures commonly accepted by qualitative and quantitative researchers.
What's more, only ATLAS.ti allows you to export your entire project when it's time to transfer research from one researcher to another, or between the web and desktop version of ATLAS.ti. While Delve has limited export options, the native ATLAS.ti file format in addition to the QDPX format ensures seamless integration between our platform and other qualitative data analysis software.
Affordable Data Analysis
Qualitative research need not be a cost-prohibitive endeavor. Everyone should have access to tools that help them make sense of their data without the financial burden. ATLAS.ti offers a flexible annual subscription model that provides more value for educators and students than the annual subscription rate for Delve. And as you add more members of your research team and purchase multi-year licenses with ATLAS.ti, the cost per user becomes even less expensive. Most of all, students can take advantage of the full analysis tools available on all compatible platforms with a Desktop+Web license for less than the cost of a license to Delve's web-only solution.
Putting It All Together
Delve is a functional platform that supports live collaboration of coding interviews and, to a limited extent, other textual data. On the other hand, ATLAS.ti provides the same capabilities with more auto-coding tools, enhanced artificial intelligence features, and powerful visualizations.
In addition, ATLAS.ti offers far more written resources and live training than Delve to support qualitative researchers. We have an entire support ecosystem, available for free, that not only assists users in overcoming any learning curve that comes with the software, but develops qualitative researchers to their fullest potential. With a full Research Hub of articles devoted to qualitative research, live webinars to demonstrate ATLAS.ti and qualitative methods, and perpetual support via email, telephone, and live chat, 24 hours a day, five days a week, ATLAS.ti is there to support all qualitative researchers with all forms of analysis of all types of qualitative data.